
Many areas of Computer Science are involved with the description of algorithms. For example, sorting techniques, syntax analysis and table handling all require the student to understand quite complex algorithms. In many cases, the advantages of a particular algorithm only become apparent when it is applied to a problem of realistic size. It is usually impossible to give the student a feel for a particular algorithm when working with examples that can be managed easily by hand. Computer Animation gives us the ability to present realistic problems in a way which allows the student to appreciate the subtleties of a particular method. The presentation will be illustrated by films used in the teaching of hash tables.
In many Computer Science courses there is a need to introduce a variety of algorithms to perform a particular task. The student must understand the concepts involved and be aware of which algorithm to use in a particular situation. The payoff may be in computing time, storage used or even complexity of coding. A good example is sorting a set of items into order where there is a great variety of methods in the literature [1]. The teacher must give a comparative study of the algorithms and indicate when each should be used, showing the advantages and disadvantages.
In many areas, the algorithms themselves are simple to describe and there is little difficulty in demonstrating the algorithm using a minimal example and estimating the efficiency by suitable approximations. However, there is quite often a difficulty in providing the student with a feel for the method on a non-trivial problem. In many cases, the benefits of a particular algorithm only become apparent when it is applied to a significant problem. For example, the choice of a particular sorting method will depend on the length of the list to be sorted, the size of main memory and whether the items in the list are already partially sorted. With sort times for N items depending on N2 or N log N (depending on the method chosen), it is difficult to make this difference apparent with a minimal example of 5 or 10 items.
Although it is possible to produce an analysis of an algorithm showing its efficiency mathematically, it is often more rewarding for the student if he can see the algorithm working. Using animation, it is quite feasible for films to be made demonstrating such algorithms. Such films are a useful pedagogical tool and can be made simply and efficiently using computer animation rather than conventional techniques.
Computer-generated films are normally produced using either a microfilm recorder or a camera attached to a display tube. The major benefits obtained in using computer rather than conventional animation are:
A criticism of using films rather than interactive programs associated with a display is that the student cannot experiment with his own data. By feeding different lists of numbers to be sorted into an interactive program which displays the algorithm, the student can experiment and see how the algorithm copes with situations such as partial ordering or reverse ordering. Assuming no limitations, this has considerable advantages. However, the amount of information that can be shown on a film frame is likely to be much higher than that which can be included on a display. With a refreshed tube there are likely to be flicker problems if too much information is displayed, while a storage tube with its picture completely re-drawn does not give the same effect as a film. The cost of on-line computer use is, of course, much higher than the print cost of a film.
Examples of the type of film that can be produced are a set of films on hash tables which have been generated by the author. Hash tables are widely used in compilers and other data handling fields where it is important that both accessing and entering items into a table are achieved efficiently. It is the standard method used in a compiler's Symbol Table of identifier names in a program. The fundamental idea behind the class of hash techniques is that the name or key associated with a particular entry is used to position or locate it in the table [6].
Given a hash table D of length M, with positions D1, D2, .....DM, it is necessary to define a many-one mapping function, I, which maps the set of all possible keys, K, onto integers in the range 1 to M. For best results, the number of keys (from the total population) mapped onto each integer should be as near equal as possible [7]. The simplest and most widely used method is the open hash in which a particular key, k, is looked up in the table as follows:
The action to be taken once a position is located will depend on whether the key is being entered or accessed. The length of search (that is, the number of entries examined before the correct one is found) indicates the efficiency of the method. Assuming all entries are equally likely to be accessed, the average length of search, A(ς), for the open hash method can be shown to be approximately:
A (ς) = (2 - ς) /2 (1-ς)
where ςM is the number of entries in the table.
It is a simple matter to present the hash table concept to the student in the way described above. However, it is difficult to get the student to appreciate how the hash method was derived, why its access time is so short (a table which is 80% full has an average length of search of 3) and why the average length of search increases quite dramatically as the table becomes nearly full. The set of hash films was generated in order to help the student in understanding these points.
Considerable time was spent in defining the basic format for the set of films. It was important to make the circulatory nature of the table evident and a power of 2 was chosen as the table size so that specific quadratic hash films could also be generated. A table size of 128 was finally chosen. A smaller table size of 64 entries turned out to be too small to exhibit some of the effects while a larger table size tended to produce a film which was too long.
Although it would have been possible to show both entries and accesses to the table, the points to be illustrated can best be shown by gradually filling the table as entries are made and ignoring accesses completely. The process of making an entry in the table is shown by first putting a box around the initial position in the table tried. If this position is empty then the entry is made by removing the box and inserting a symbol in the table position to indicate that it has been allocated. If the first position tried is already allocated (the table position is non-empty) then a box is displayed around the next entry tried. Boxes continue to be displayed around subsequent entries in the search path until an empty position is found. Thus the search path is marked out by the boxes until the entry is made.
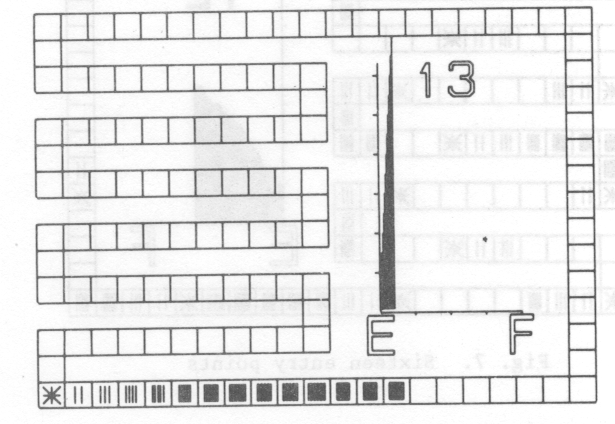
Rather than use a standard symbol to define an allocated entry, the symbol is used to indicate the length of search required for that entry. In general, a table entry which requires a search length of S is represented by S equally spaced vertical lines. The entries with a search length of 1 are not represented by a single vertical line but by an asterisk. This is done so that the minimal search length entries stand out. The student should realise how large a number of entries is accessed with a minimal search length.
A typical frame of a film is shown in fig. 1. The table is shown as a set of squares around the outside of the frame and covering most of the left hand side. The unusual layout is so that the individual squares representing table positions are as large as possible. The importance of the average length of search as a measure of efficiency is emphasised by including a graph of this which is updated as the table fills. The E and F represent Empty and Full respectively while the scale in the y-direction is in units of 1. The final item on the frame is a number indicating the maximum search length of any entry made so far.
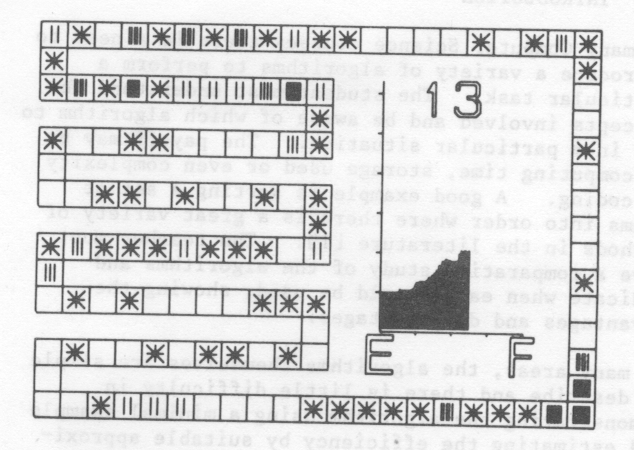
There was a temptation to increase the film speed as the table filling progressed. This was resisted as it was felt that more could be gained by letting the access times remain consistent. Consequently, as the search lengths get longer, the time to make each entry increases proportionately. Film time can therefore be compared directly with computing time.
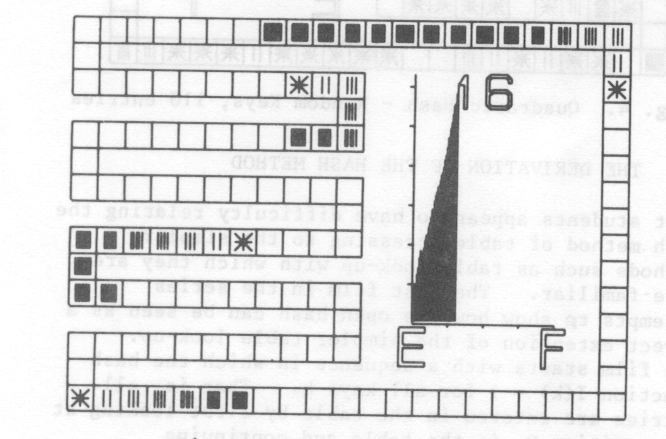
A typical film in the set is the one showing entries being made into an open hash table on the assumption that keys are being taken from the total population at random. Two frames from the film are fig. 1 and fig. 2. It can be seen that the graph generated exhibits the predicted average length of search with the rapid growth as the table becomes nearly full.
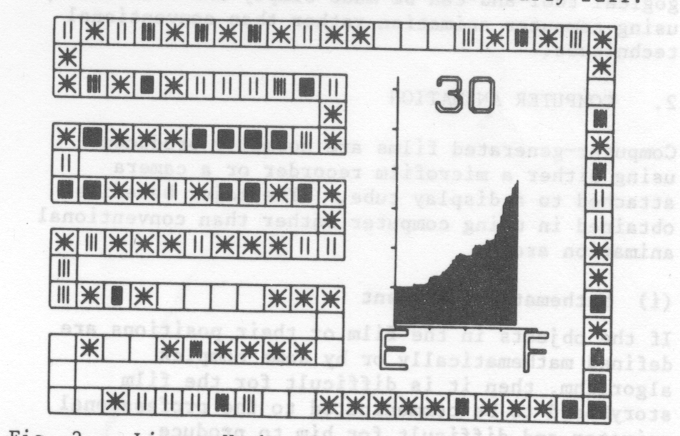
The main purpose of this film is to show that this is due to primary clustering [8]. As the table fills, small clusters of entries appear at a particular point in the table. This is either due to entries being made at neighbouring positions or several entries being made with the same initial hash position. As additional entries are made at this part of the table, the cluster will grow in size until it coalesces with its neighbour. Once two separate search paths come together in this way, they will stay together producing a much larger length of search for subsequent entries. As clusters grow in size, entries are more likely to be made to this part of the table and so the situation worsens.
Secondary objectives of this film are to show that the maximum length of search is unlikely to approach half the table size until the table is a few entries from being completely full. Also, it is important for the student to see the large number of entries accessed in a search length of 1. It is worth pointing out that the table, in practice, does not behave in the text book manner with the average length of search gradually increasing. Frequently, additional entries with short search lengths can lower the average length of search for a while.
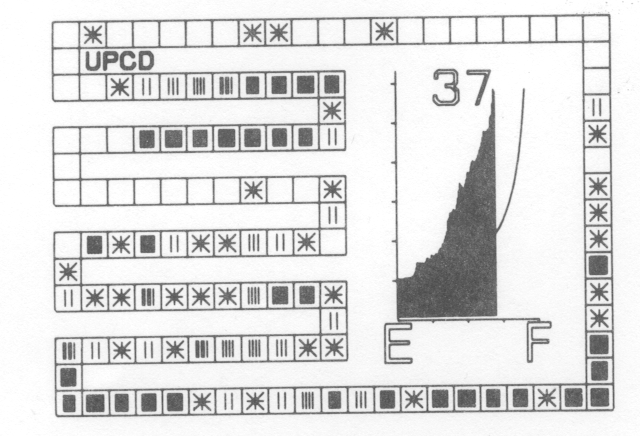
Additional films in the set demonstrate the effect of using actual rather than random keys as data and the improvement to be gained by the removal of primary clustering. The student should realise that whatever hash function is chosen, the data will not be random so that the results obtained in the first film are unlikely to be achieved in practice. A frame from the second film (fig. 3) shows the results of inputting identifiers from a typical FORTRAN program using a hash function depending on the first two letters of the identifier. The curve superimposed on the graph shows the theoretical average length of search.
The major drawback of the open hash method described above is the long search paths due to primary clustering. Once search paths from different origins come together, they stay together as the next entry in a sequence depends only on the previous entry. Most of the variations on the simple or linear open hash attempt to remove primary clustering by making the next entry depend on the origin and length of search so far, as well as the last entry in the sequence. An example is the quadratic hash method defined as follows:
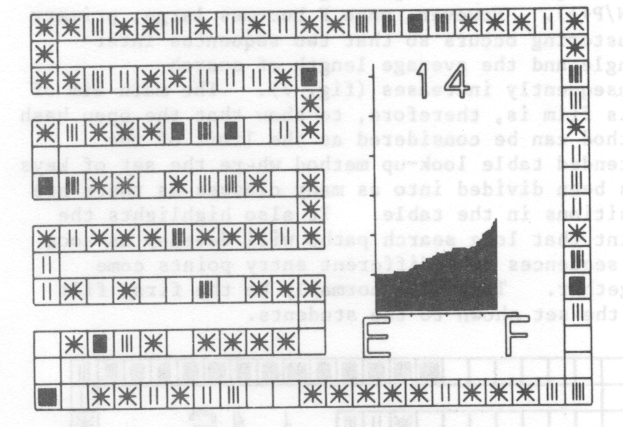
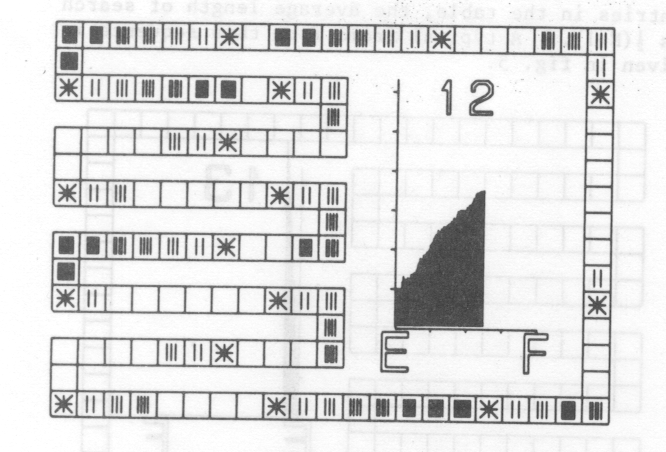
It can be shown that this method only searches all table entries when the table size is a power of 2 [8]. The next two films in the set are similar the first two except that keys are entered using quadratic hash method. Considerable improvement in the average length of search can be seen for the random keys in fig. 4. The film shows quite explicitly how the primary clustering has been removed.
Most students appear to have difficulty relating the hash method of table accessing to the simpler methods such as table look-up with which they are more familiar. The last film in the series attempts to show how the open hash can be seen as a direct extension of the simpler table look-up. The film starts with a sequence in which the hash function I(k) = 1 for all keys k. That is, all entries are entered in the table by first looking at the position Di in the table and continuing serially until an empty entry is found. This is the standard table look-up method and with N entries in the table, the average length of searl is ½(N+1). A typical frame from this sequence given in fig. 5.
An improvement in the average length of search can be obtained by splitting the set of keys into two halves (for example, identifiers to be entered in a Symbol Table could be split into two classes depending on whether the first character is in the first or second half of the alphabet). The first set of keys can be entered at the start of the table while the second can be entered at the middle. Assuming keys are taken uniformly from the complete population, the average length of search should now be ½(N/2+1). If the complete set of keys is divided into 4 and entered at four equally spaced positions in the table then the average length of search should be ½(N/4+1) and so on.
This is illustrated in this final film by following the sequence with a single entry point by sequences involving 4 entry points (fig. 6), 16 entry points (fig. 7) and finally 64 entry points. For each sequence, keys are taken from the complete population at random. At first sight it would appear that dividing the set of keys into P classes should give an average length of search of ½(N/P+1). However, once P becomes large, primary clustering occurs so that two sequences intermingle and the average length of search consequently increases (fig. 7). The main aim of this film is, therefore, to show that the open hash method can be considered as the limit of the extended table look-up method where the set of keys has been divided into as many classes as there are positions in the table. It also highlights the point that long search paths will develop as soon as sequences from different entry points come together. This will normally be the first film of the set shown to the students.
This set of films on hash tables has been used in one form or another in courses for the last few years. The students enjoy them and feel that they are helpful in explaining the methods. So far, there are insufficient examination results to get a quantitative evaluation. This paper has concentrated on just one small part of computer science teaching. However, the techniques described here can be used to generate films on a wide range of topics. The author has used films on syntax analysis to illustrate the differences in the major methods. A complete set of films covering a number of areas would be a valuable addition to computer science teaching.
[1] William A. Martin, Sorting, Computing Surveys, vol. 3, no. 4, December 197], 147-174.
[2] D. C. Toll and F.R.A. Hopgood, GROATS Manual, Atlas Computer Laboratory, June 1973.
[3] A.H.Francis, F.R.A. Hopgood and D. Ralphs, CAMP and CAMPER on the 1906A and PDP15, Atlas Computer Laboratory, February 1973.
[4] John W.E. Lewis, POLYGRAPHICS on the IBM 370/195, Atlas Computer Laboratory, June 1973.
[5] R.E. Thomas, SPROGS Manual, Atlas Computer Laboratory, March 1973.
[6] Robert Morris, Scatter Storage Techniques, Communications of the ACM, vol. 11, no. 1, January 1968, 35-44.
[7] K. Iverson, A Programming Language, Wiley, New York, 1966, 144-155.
[8] F.R.A. Hopgood and J. Davenport, The quadratic hash method when the table size is a power of 2, The Computer Journal, vol. 15, no. 4, November 1972, 314-315.
Attached are some modern updates of the original films using SVG animation.
