
The term data processing is now used in a variety of contexts, from office accounting to industrial process control. This paper is concerned only with the processing of data derived from a physical experiment or test of some kind. Now such an experiment is not complete until the results obtained from it are presented in a form suitable for evaluation by the scientist or engineer. We shall take the term data processing to embrace the stages between the output of the instruments used in the experiment and the final presentation of results. Neither boundary is well defined, but we may, for convenience, sub-divide this central region as follows:-
The computational stage is a very variable quantity. At one extreme it may consist only of applying scale factor or calibration corrections; at the other - with which we shall be mainly concerned here -it will justify the use of an automatic digital computer. In the former case the computing virtually disappears as a separate stage and becomes absorbed into the reading or display stages.
About five years ago a survey was made of the work of a large number of junior staff at the Royal Aircraft Establishment who were loosely termed computers. It was found that only about half of their time was in fact occupied in computing - that is, doing sums; the remainder was spent in various activities falling within stages (2) and (4) - in reading experimental records, copying figures, punching tape or cards, and drawing curves. It was hoped that the arrival of the electronic digital computer (the first of which was installed at Farnborough in May 1955) would largely take care of the computing half of the business; it remained to do something about the other half.
The point to stress is that the data processing equipment and the computing equipment must be considered as a unified whole. To provide oneself with a powerful computer and leave it at that is like travelling from London to Nottingham by covering half the distance in a supersonic aeroplane and the other half in a Hansom cab.
The primary data - that is, the output of the instruments used in the experiment - may appear in a variety of physical forms. We may group these into two broad categories - analogue and digital. In the former, the quantity to be measured is represented by the magnitude of a continuously varying physical quantity, such as a voltage, the height of a trace on a film record, or the angle of rotation of a shaft. In the digital form of representation, on the other hand, the signals emitted from the measuring instruments are to be interpreted in terms of a code or language, usually one of the positional radix number languages, such as the familiar binary or decimal system. The individual signals often depend on the presence or absence of some physical effect, such as a voltage at a particular period of time, or a hole punched in a particular place on a card or tape. It is obvious that the processing of data in analogue form must introduce errors at every stage. Digital data, by contrast, can be manipulated without introducing any errors; the accuracy depends on the number of digits used Even so, analogue methods are often quite accurate enough and may well be simpler, cheaper and faster.
It is usually desirable to record the primary data before processing. Such recording acts as a partial insurance against loss of information due to breakdown of equipment and enables the time scale to be changed to one more convenient for the processing operations. Furthermore, in many cases only a proportion of the data needs to be processed, although the possibility of processing more later must be allowed for.
The immediate output of most measuring instruments is in analogue form; the choice then lies between recording the primary data in this form or digitising it before recording. While the trend of development is towards the latter alternative, the majority of existing data processing systems still adopt the former. One of the most common forms of analogue record is the line-trace on a film or paper roll. At low frequencies the trace is usually produced by a pen recorder, at medium frequencies by a galvonometer controlled spot of light, and at high frequencies by an electron beam impinging on a cathode ray tube. Another type of record is the direct photograph of, for example, a missile or rocket, while recording on magnetic tape is now coming into use.
Digital recording of primary data is attractive when the operation is essentially one of counting or when the readings are sampled at discrete intervals of time. When these intervals are of the order of a second or longer, it is convenient to record by means of holes punched on cards, paper tape, or film; at higher speeds recording on magnetic tape or photographic film becomes necessary. A numerical magnitude is usually recorded digitally as a combination of marks and spaces of some kind; that is to say, numbers are expressed in a binary scale. Such representation may be in direct binary, or, alternatively, each decimal digit may be expressed as a group of binary digits. Table 1, taken from reference 1, shows, for five commonly used materials, the number of binary digits that can be recorded on a given area.
| Material | Possible Packing Density, binary digits per sq in |
|---|---|
| Punched cards (Hollerith) | 40 |
| Punched tape (teletype) | 60 |
| Punched film | 130 |
| Magnetic tape | 1600 |
| Photographic tape | 10,000 |
Until comparatively recently most experimental records were read visually by human operators, perhaps using simple mechanical or visual aids. During the last twenty years a variety of both fully automatic and partially automatic devices have been developed for recording, reading and transcribing experimental data. It should be remembered, however, that it is often preferable to retain the human operator for part of the process; for instance, when the record is such that human intelligence must be used to interpret it, or when fully automatic equipment would be too inflexible, or unduly costly and elaborate - and hence correspondingly difficult to keep in working order.
Three illustrative examples of data processing systems that have been developed at R.A.E. will now be discussed. These are:-
Each of these systems is designed to cope with the situation in which the volume of calculation is sufficient to justify the use of an automatic computer The electronic digital computing equipment at R.A.E. consists at present of two DEUCE's and a Pegasus at Farnborough, and a HEC at Bedford, (A Mercury computer is on order). The systems discussed here were designed to operate with DEUCE. Data is fed into this machine on standard 80 column Hollerith punched cards at the rate of 200 cards per minute, a maximum of 384 binary digits of information being read from each card. (A recent modification has raised this figure to 768 bits). Each of the three systems, therefore, is designed to record the primary data on Hollerith cards, which are then fed manually into the DEUCE input card reader. A typewritten record of the primary data, for immediate inspection, can also be produced either in parallel with, or instead of, the punched cards.
The technique of automatic typing by actuating the key-levers of an electric typewriter by electromagnets is well known and will not be discussed further here. Three makes of typewriter adapted for automatic operation are commercially available in this country. The speed of operation is about 10 characters per second.
The immediate output of DEUCE, like its input, consists of Hollerith cards. These are then fed manually into one of a number of alternative devices whose function is to read the information punched on the cards and to present it in a convenient form for human assimilation and evaluation (Stage 4). At present three such items of equipment are in regular use at R.A.E: a line-at-a-time printing device attached to a Hollerith tabulator; a card operated electric typewriter; and a card operated graph plotter (Reference 1).
This equipment is designed to facilitate the reading of line-trace records on rolls of film or paper up to 6" wide. Each such record usually carries one or more timing channels and a datum trace. Many traces may appear on each roll, and they may intersect. The basic requirement is to measure the transverse displacement of a selected trace at some chosen point along the length of the roll corresponding to a known time. In reading multi-channel records it may be convenient either to read the displacements of one trace along certain parts of the record before dealing with other traces, or to read the displacements of several selected traces at each chosen instant of time before proceeding to consider the next instant.
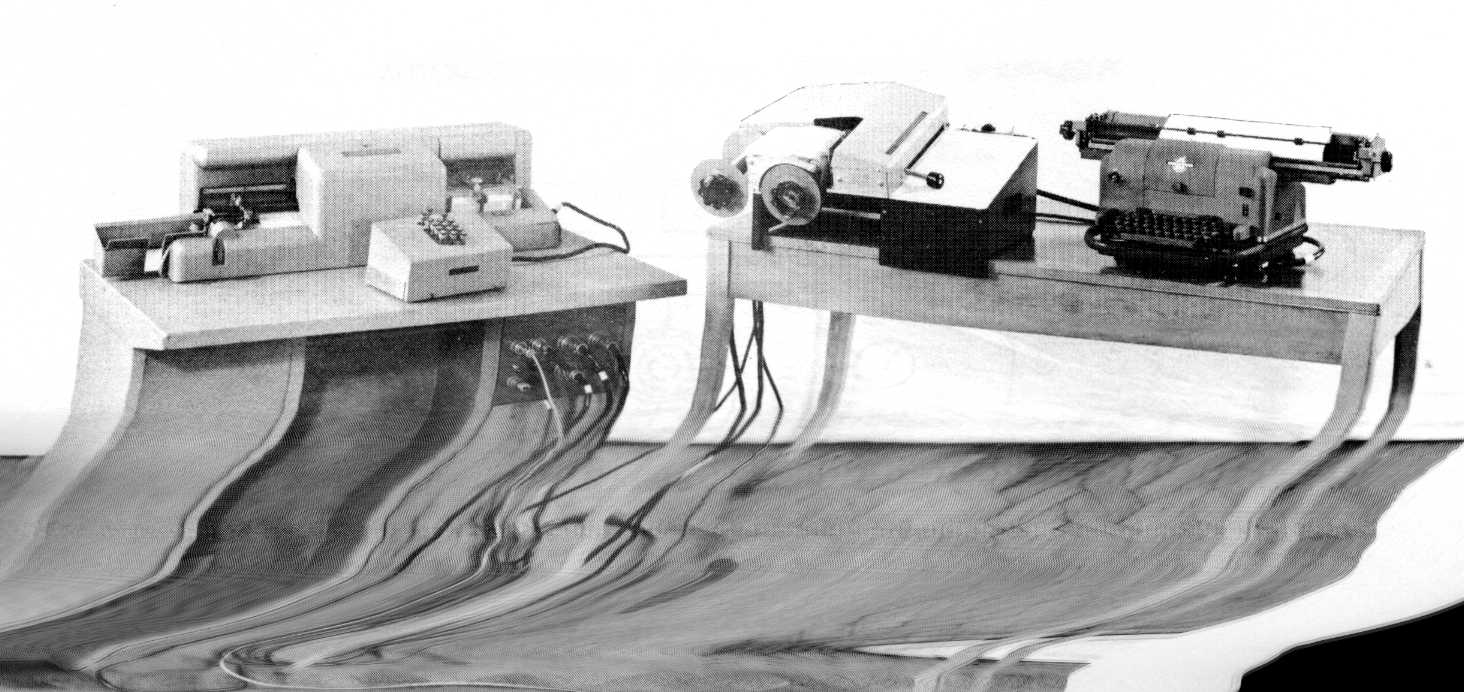
The R.A.E. system consists of a number of simple interconnected units, as shown in figure 1. The trace reader itself is shown in figure 2, and the complete set of equipment in figure 3. The reader acts effectively as a scale, which can be read automatically through a few relays in the decoder unit either to a solenoid controlled electric typewriter or to a Hollerith card punch (figure 3).
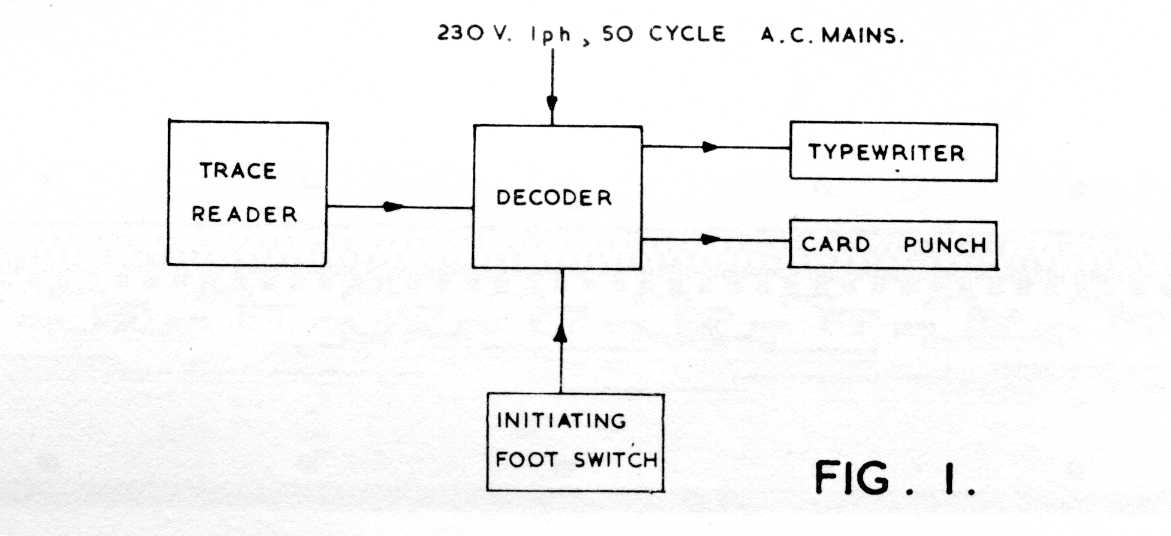
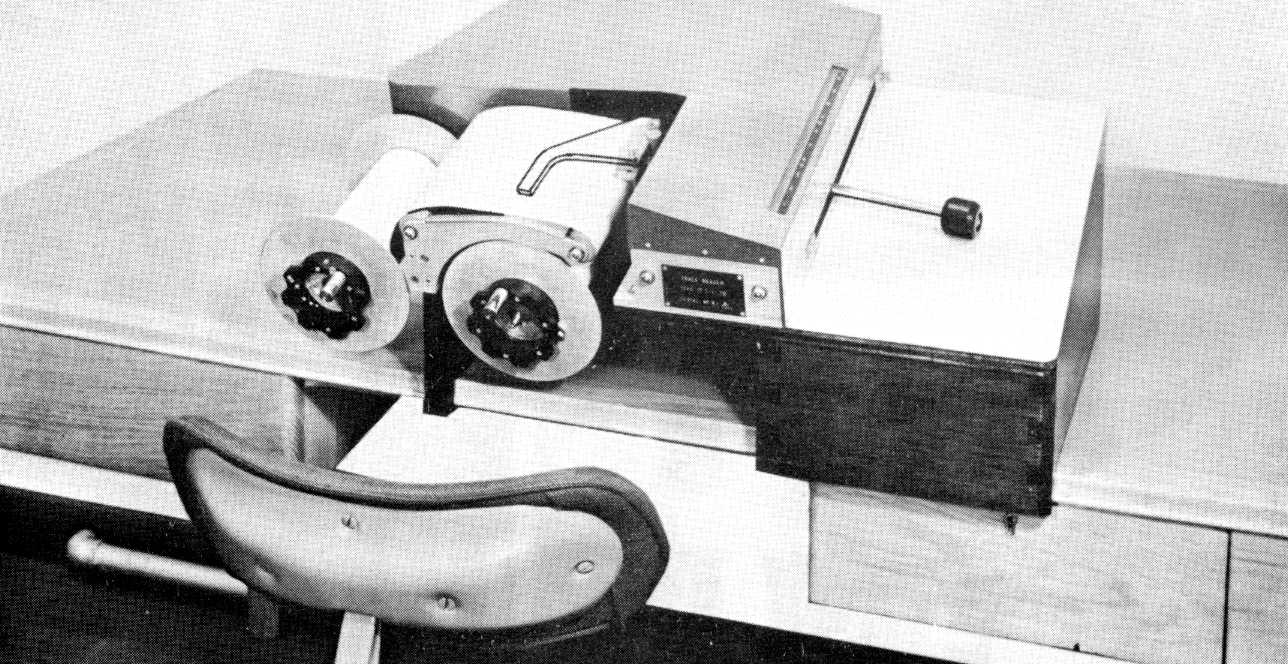
A magazine is provided on the trace reader to enable the roll of paper or film to be drawn from a feed spool over a platten and on to a take-up spool. The operator first selects an instant of time by moving the paper longitudinally from one spool to the other. He then ensures that the control knob (seen on the right of figure 2) is in the zero position and adjusts a cursor to cover the datum trace. He next moves the control knob until the cursor covers the required trace and in so doing unwittingly moves a set of reading brushes over a coded commutator or scale. By merely depressing a foot switch the operator can then transfer the readings of the brushes to the decoder unit. The function of this unit is to translate from the particular code used in the scale to the ordinary decimal representation, and then to emit pulses to selected solenoids on an electric typewriter and/or to a Hollerith programme board card punch. Such a punch, as its name implies, is fitted with a plugboard which can be plugged by hand to control the lay-outs of data on each card, just as the pre-set tabulate and margin stops on a typewriter control the layout of successive numbers along each line of type. The punches also incorporate several other useful features, such as the facility of copying selected information common to each card by means of connections in the plugboard.
The main feature of interest is the method of converting the measurement of a displacement into digital form as a set of electric pulses along a group of wires in parallel. The number code used in the trace reader belongs to a group of codes variously known as C.P. codes (cyclic progressive, continuous progressive or cyclic permuted), Grey codes or reflected codes. The essential property of these codes is that only one digit changes - and that by only one unit - in moving from the digital representation of any integer to that of the next. Since information is delivered to the card punch and the typewriter in ordinary decimal form, it is convenient to consider the coding problem in two stages:-
| Ordinary Decimal | C.P. Decimal | R.A.E. Code |
|---|---|---|
| 08 | 08 | 0101,1001 |
| 09 | 09 | 0101,1100 |
| 10 | 19 | 0001,1100 |
| 11 | 18 | 0001,1001 |
| 518 | 581 | 1110,1001,0001 |
| 519 | 580 | 1110,1001,0101 |
| 520 | 570 | 1110,1011,0101 |
| 521 | 571 | 1110,1011,0001 |
| 698 | 691 | 1010,1101,0001 |
| 699 | 690 | 1010,1101,0101 |
| 700 | 790 | 1011,1101,0101 |
| 701 | 791 | 1011,1101,0001 |
The conversion rules for stage l, generalised for any even radix of numeration, R, may be expressed as follows:-
If Pn-1 .... P1 is a number expressed in the ordinary radix notation (P1 being the least significant digit) and Cn, Cn-1 ........ C1 is the C. P. equivalent, then
Cn = Pn if Pn+1 is even or zero, and
Cn = (R-1) - Pn if Pn+1 is odd
In reverse, we have
Pn = Cn if ΣCr, r=n+1 to N, is even or zero, and
Pn = (R-1) - Cn if ΣCr, r=n+1 to N, is odd
The second stage consists of coding each decimal digit as a set of 4 binary digits. This can be done in some 8,000 different ways, so we have considerable freedom of choice. It is clearly desirable to preserve the C.P. property, and the natural choice would be to represent each decimal digit by its standard C.P. binary equivalent, as shown in col. 3 of Table 3. (By standard C.P. we mean the C.P. code formed in accordance with the rules given above). However, the decoding problem may be simplified by adopting a modified C.P. binary code, and the scheme adopted at R.A.E. is shown in the last column of Table 3.
| Decimal | Plain Binary | Standard C.P. Binary | R.A.E. Binary |
|---|---|---|---|
| 0 | 0000 | 0000 | 0101 |
| 1 | 0001 | 0001 | 0001 |
| 2 | 0010 | 0011 | 0011 |
| 3 | 0011 | 0010 | 0010 |
| 4 | 0100 | 0110 | 0110 |
| 5 | 0101 | 0111 | 1110 |
| 6 | 0110 | 0101 | 1010 |
| 7 | 0111 | 0100 | 1011 |
| 8 | 1000 | 1100 | 1001 |
| 9 | 1001 | 1101 | 1101 |
The R.A.E. code possesses the following features:-
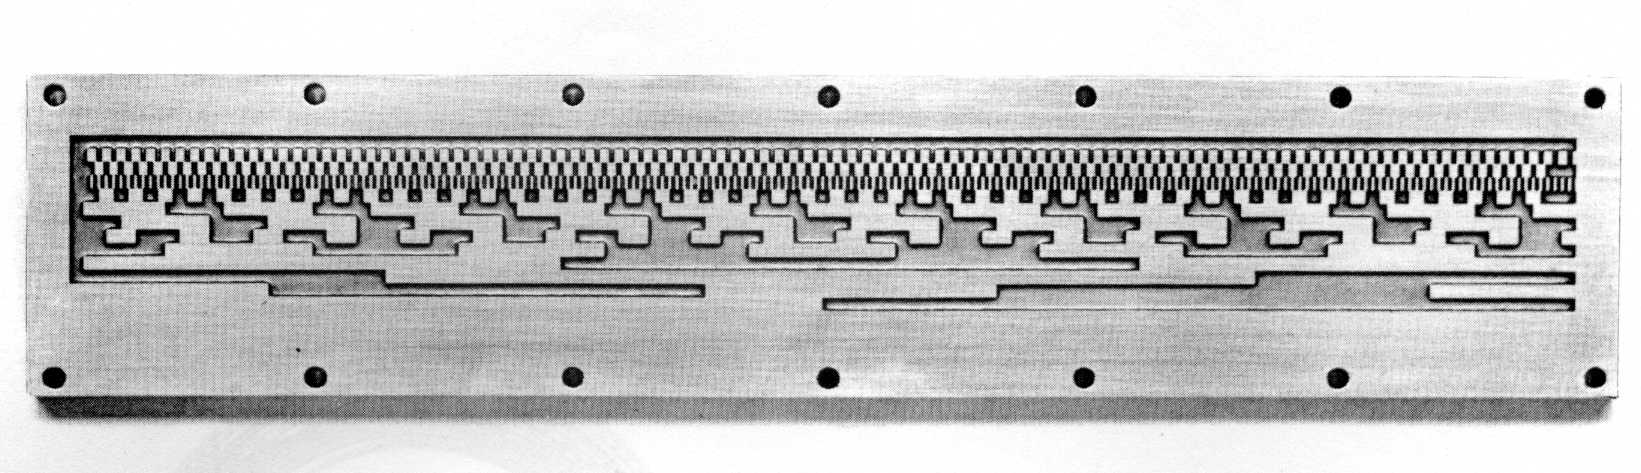
The trace reader scale is divided into a thousand divisions (from 000 to 999), each of which bears a code according to the above scheme on 12 channels. The surface of the scale consists of a pattern of conducting and insulating segments - corresponding to 1's and 0's in the number code - as shown in figure 4. The pattern is read by a set of 12 balls sprung against the surface. The C.P. feature of the code ensures that not more than one ball can be on a boundary between an insulating and conducting segment at any one time. It follows, therefore, that the maximum error in reading is never more than half a division, corresponding to 0.003" on the record. Indeed, the accuracy of a reading is limited effectively only by the skill of the operator in placing the cursor over the selected point.
Several sets of trace reading equipment have been in regular use at R.A.E. for some years, and the constituent units are now available commercially. Operators quickly settle down to a conversion rate of about 1000 readings per hour.
The equipment described above has been designed to do a specific and limited job - the reading and digitising of displacements in the y-direction, the x-co-ordinates (representing time) being selected manually and not recorded - and the emphasis has been placed on simplicity and cheapness. A number of more elaborate devices in which both x and y co-ordinates are recorded in digital form also commercially available and in use at R.A.E. (Reference 1).
The need for automatic devices to speed up the processing of data obtained from wind tunnels first became urgent at R.A.E. during the war. Delays of up to six weeks used to occur between the completion of a tunnel test and presentation of the final results - in spite of the employment of about 20 computers with electric desk calculators. About half the time was occupied in computing, the other half in transcribing data and plotting results. The procedure was to photograph on cine film the various instrument dials showing the forces, moments, pressures, etc., on the model in the tunnel. The films, after being developed and printed, were then read by one operator, while a second one wrote down the figures.
In 1947 Diprose proposed a system which could be applied to existing wind tunnels as well as to new ones (Reference 2). The main features of this plan were that all readings would be converted to shaft rotations and transmitted by step repeaters to a central point. The shaft rotations at this central point would be converted into digital form suitable for automatic typing or card punching, on the lines discussed in the last section. Automatic plotting equipment would be used for plotting both the primary data for a quick visual assessment, and the final results obtained from the punched card output of the electronic computer. Another feature was that failure of any part of the automatic equipment would not leave the tunnel operator in a worse position than if no automatic equipment had been installed.
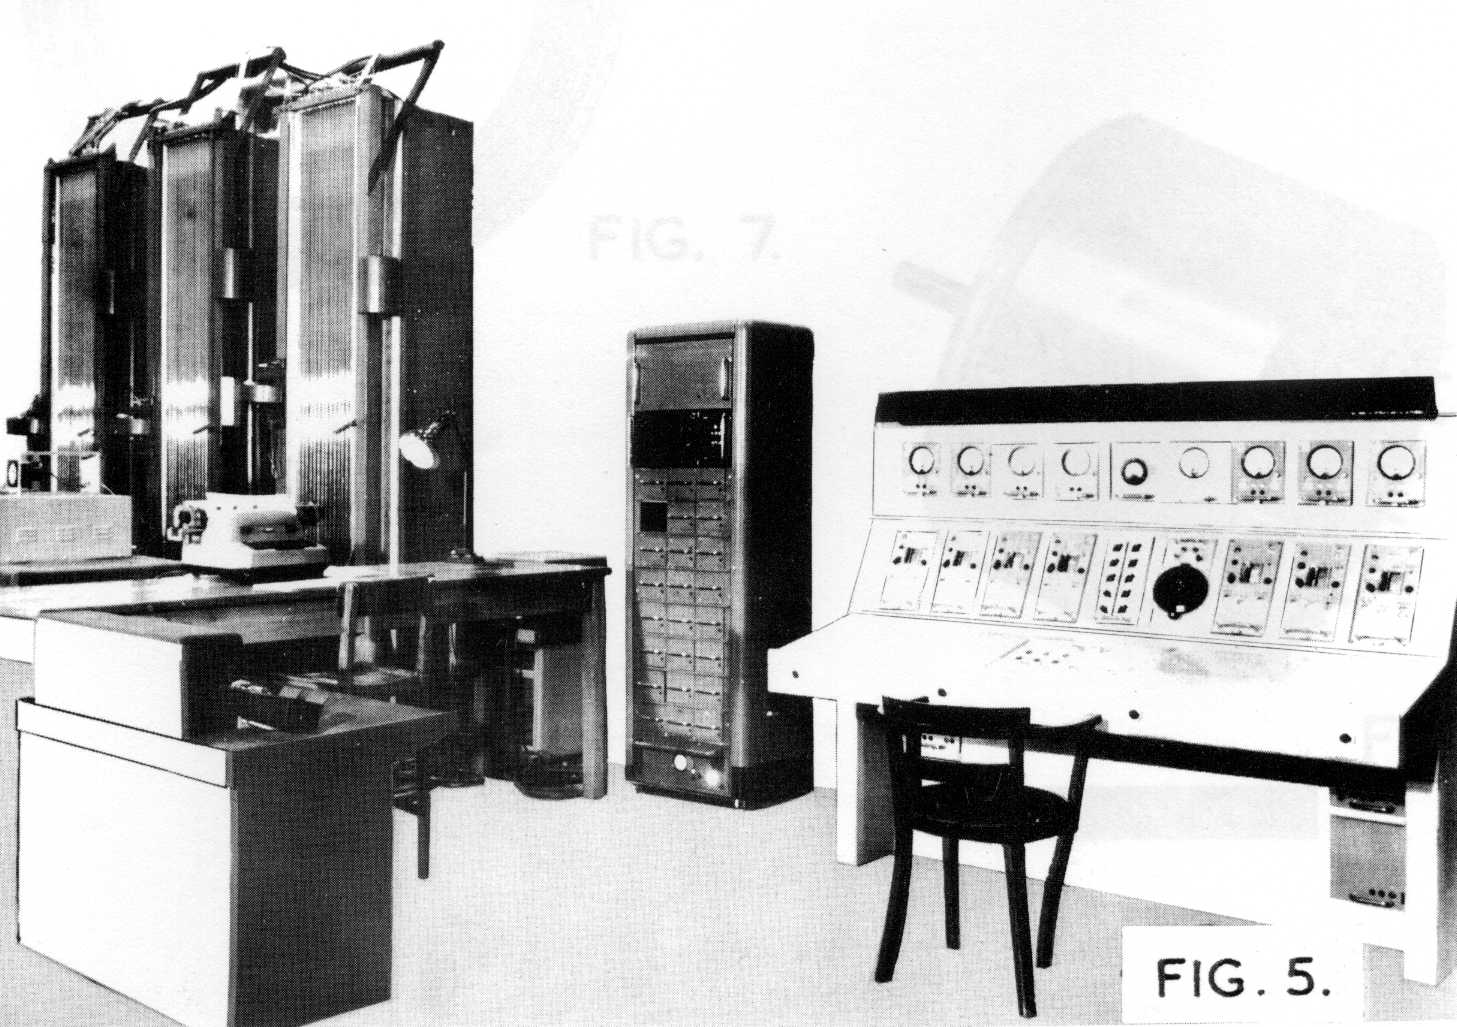
This system was introduced in stages during the next few years. Figure 5 gives a general view of the whole automatic system, which was installed in 1952. The Hollerith punch and solenoid operated typewriter can be seen on the left, with the central unit containing the shaft digitisers and the scanning equipment in the centre, and the tunnel operator's console on the right.
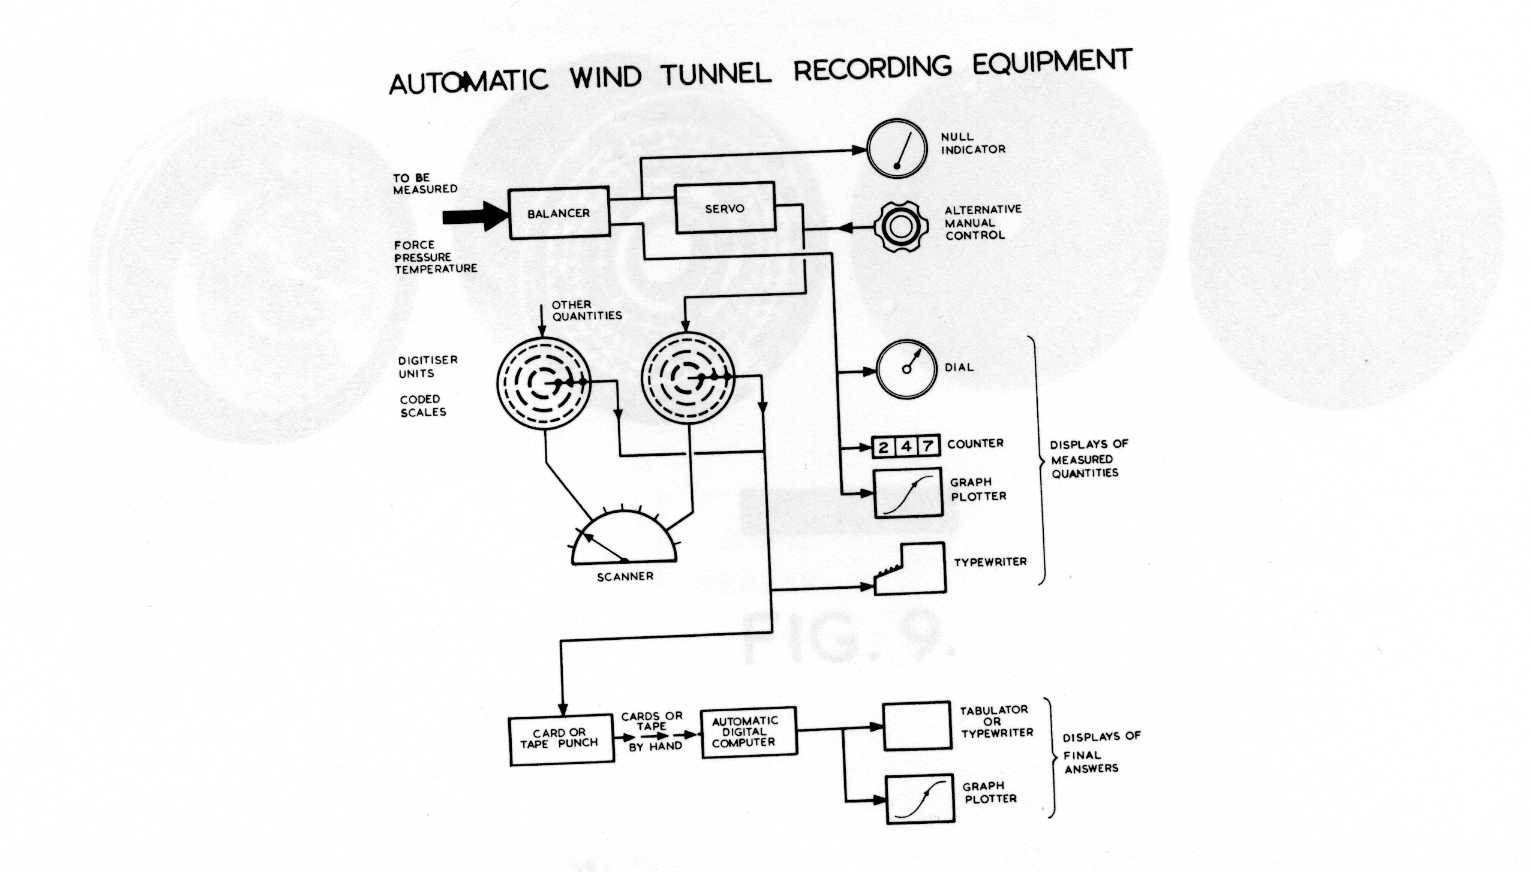
The function of a digitiser is to indicate the angle of rotation of a shaft by means of electrical signals, which can be interpreted in terms of a convenient binary digital code. The output signal on any wire indicates a '1' in the corresponding digital position; the absence of a signal indicates a '0'. The digitisers, one of which is required for each measured quantity are selected in sequence by a scanner, which controls the feeding of the digital information to the card punch and/or typewriter. A block diagram of a complete scheme is shown in figure 6.
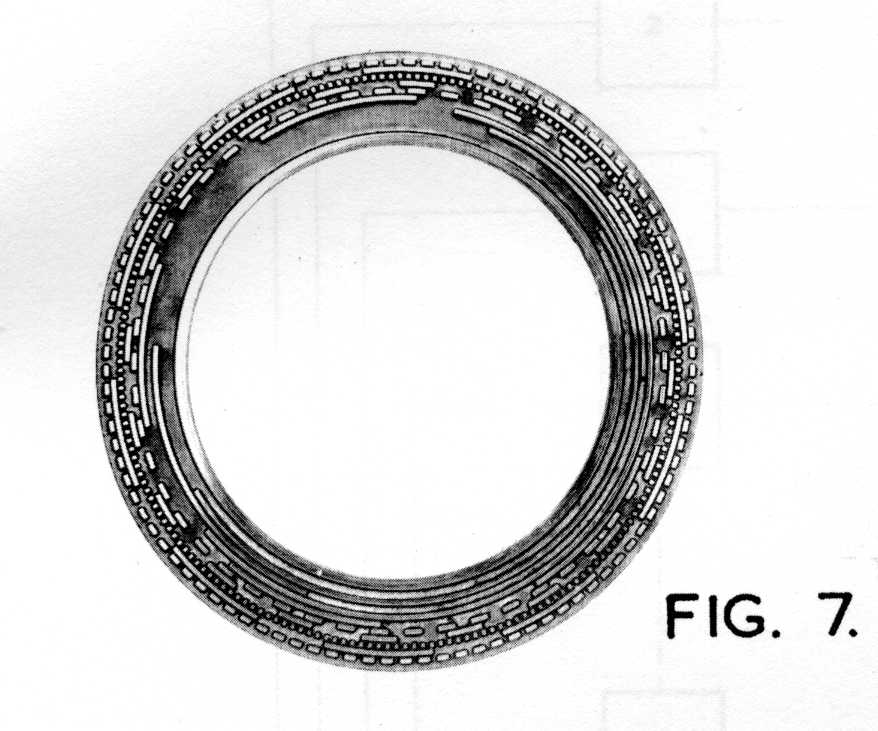
The shaft digitiser in its original form consisted of a series of decade units, each bearing one decimal digit, cascaded through interconnecting 10:1 step-down gearing. It was necessary, in order to avoid possible ambiguities of readings to make arrangements to eliminate errors due to backlash. During the last few years the geared digitisers have been progressively replaced on all the major R.A.E. wind tunnel installations by digitisers of the coded disc type. Their mode of operation is similar to that of the linear scale already described, with the difference that the analogue quantity to be digitised is now a shaft rotation instead of a linear displacement. Figure 7 shows a typical coded disc with a number of concentric patterned rings. The method of coding a decimal number as a sequence of binary digits is the same as that described in the last section; the scale shown in figure 7 has a resolution of one thousandth part of a complete shaft rotation. A variety of other coded disc digitisers have been made for particular purposes; for example, a scale reading from -29.95 to +29.95 in steps of 0.05 for measuring the incidence angle of tunnel models.
A more recent development has been the provision of a range of multi-turn digitisers for encoding the position of shafts which can rotate through more than 360°. Figure 8 shows one which digitises a shaft rotation to one part in a hundred and counts up to one hundred turns. Figure 9 shows an exploded view. This digitiser contains two coded scales, each formed by printed circuit techniques, geared together so that the more significant scale rotates at one hundredth of the speed of the less significant scale.
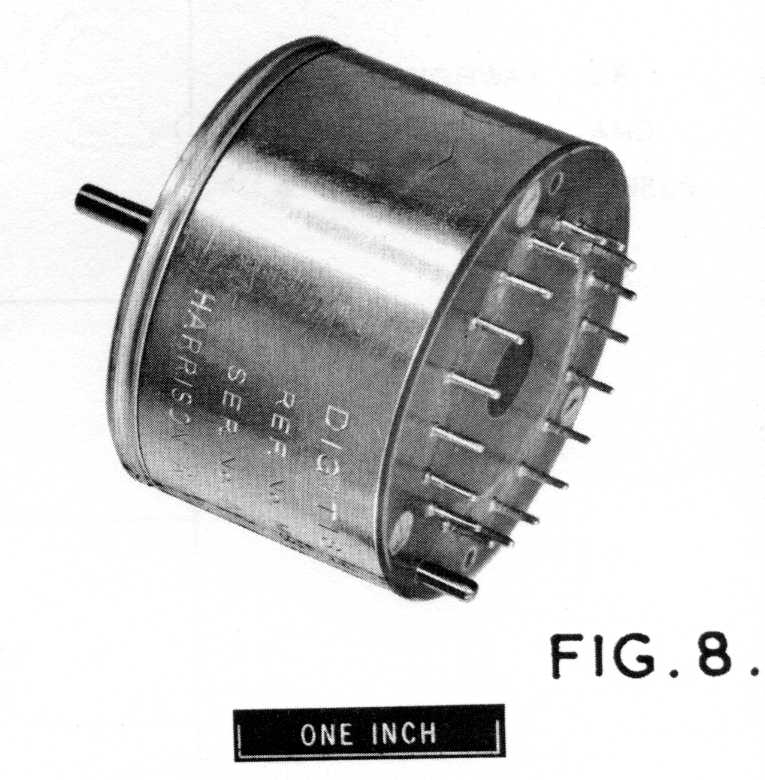
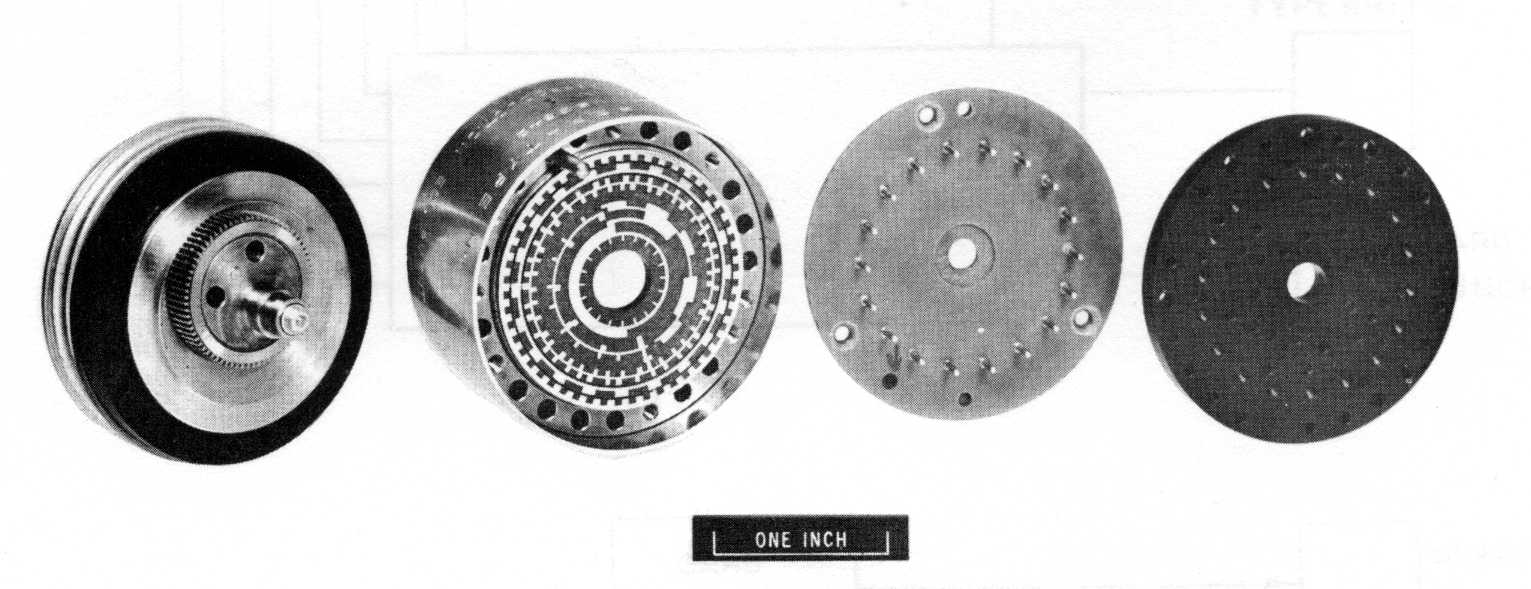
Figure 10 shows the block schematic of the system in current use at R.A.E. The coded disc digitisers are fitted to self-balancing bridges associated with resistance strain gauges on the model. They may also be associated with capsule manometers for reading pressures, or indeed with any measuring device which indicates the magnitude of a quantity by the rotational position of a shaft. In this scheme, unlike the earlier one (Fig. 5), the digitising operation is performed at the shaft itself. The digital signals from all the digitisers are transmitted to the scanner along a common data highway as shown in figure 10. Each of 16 wires of the highway is associated with a channel of given significance in the digitisers, a further 9 wires being used for control purposes. The information passes along the highway in the form of pulses and enters the scanner for decoding and feeding out to a typewriter or card punch. Also connected to the data highway are serial counters and a group of hand set switches. The purpose of the former is to enable a serial count of the number of times the scanner has been initiated to be typed or punched along with the measured information.
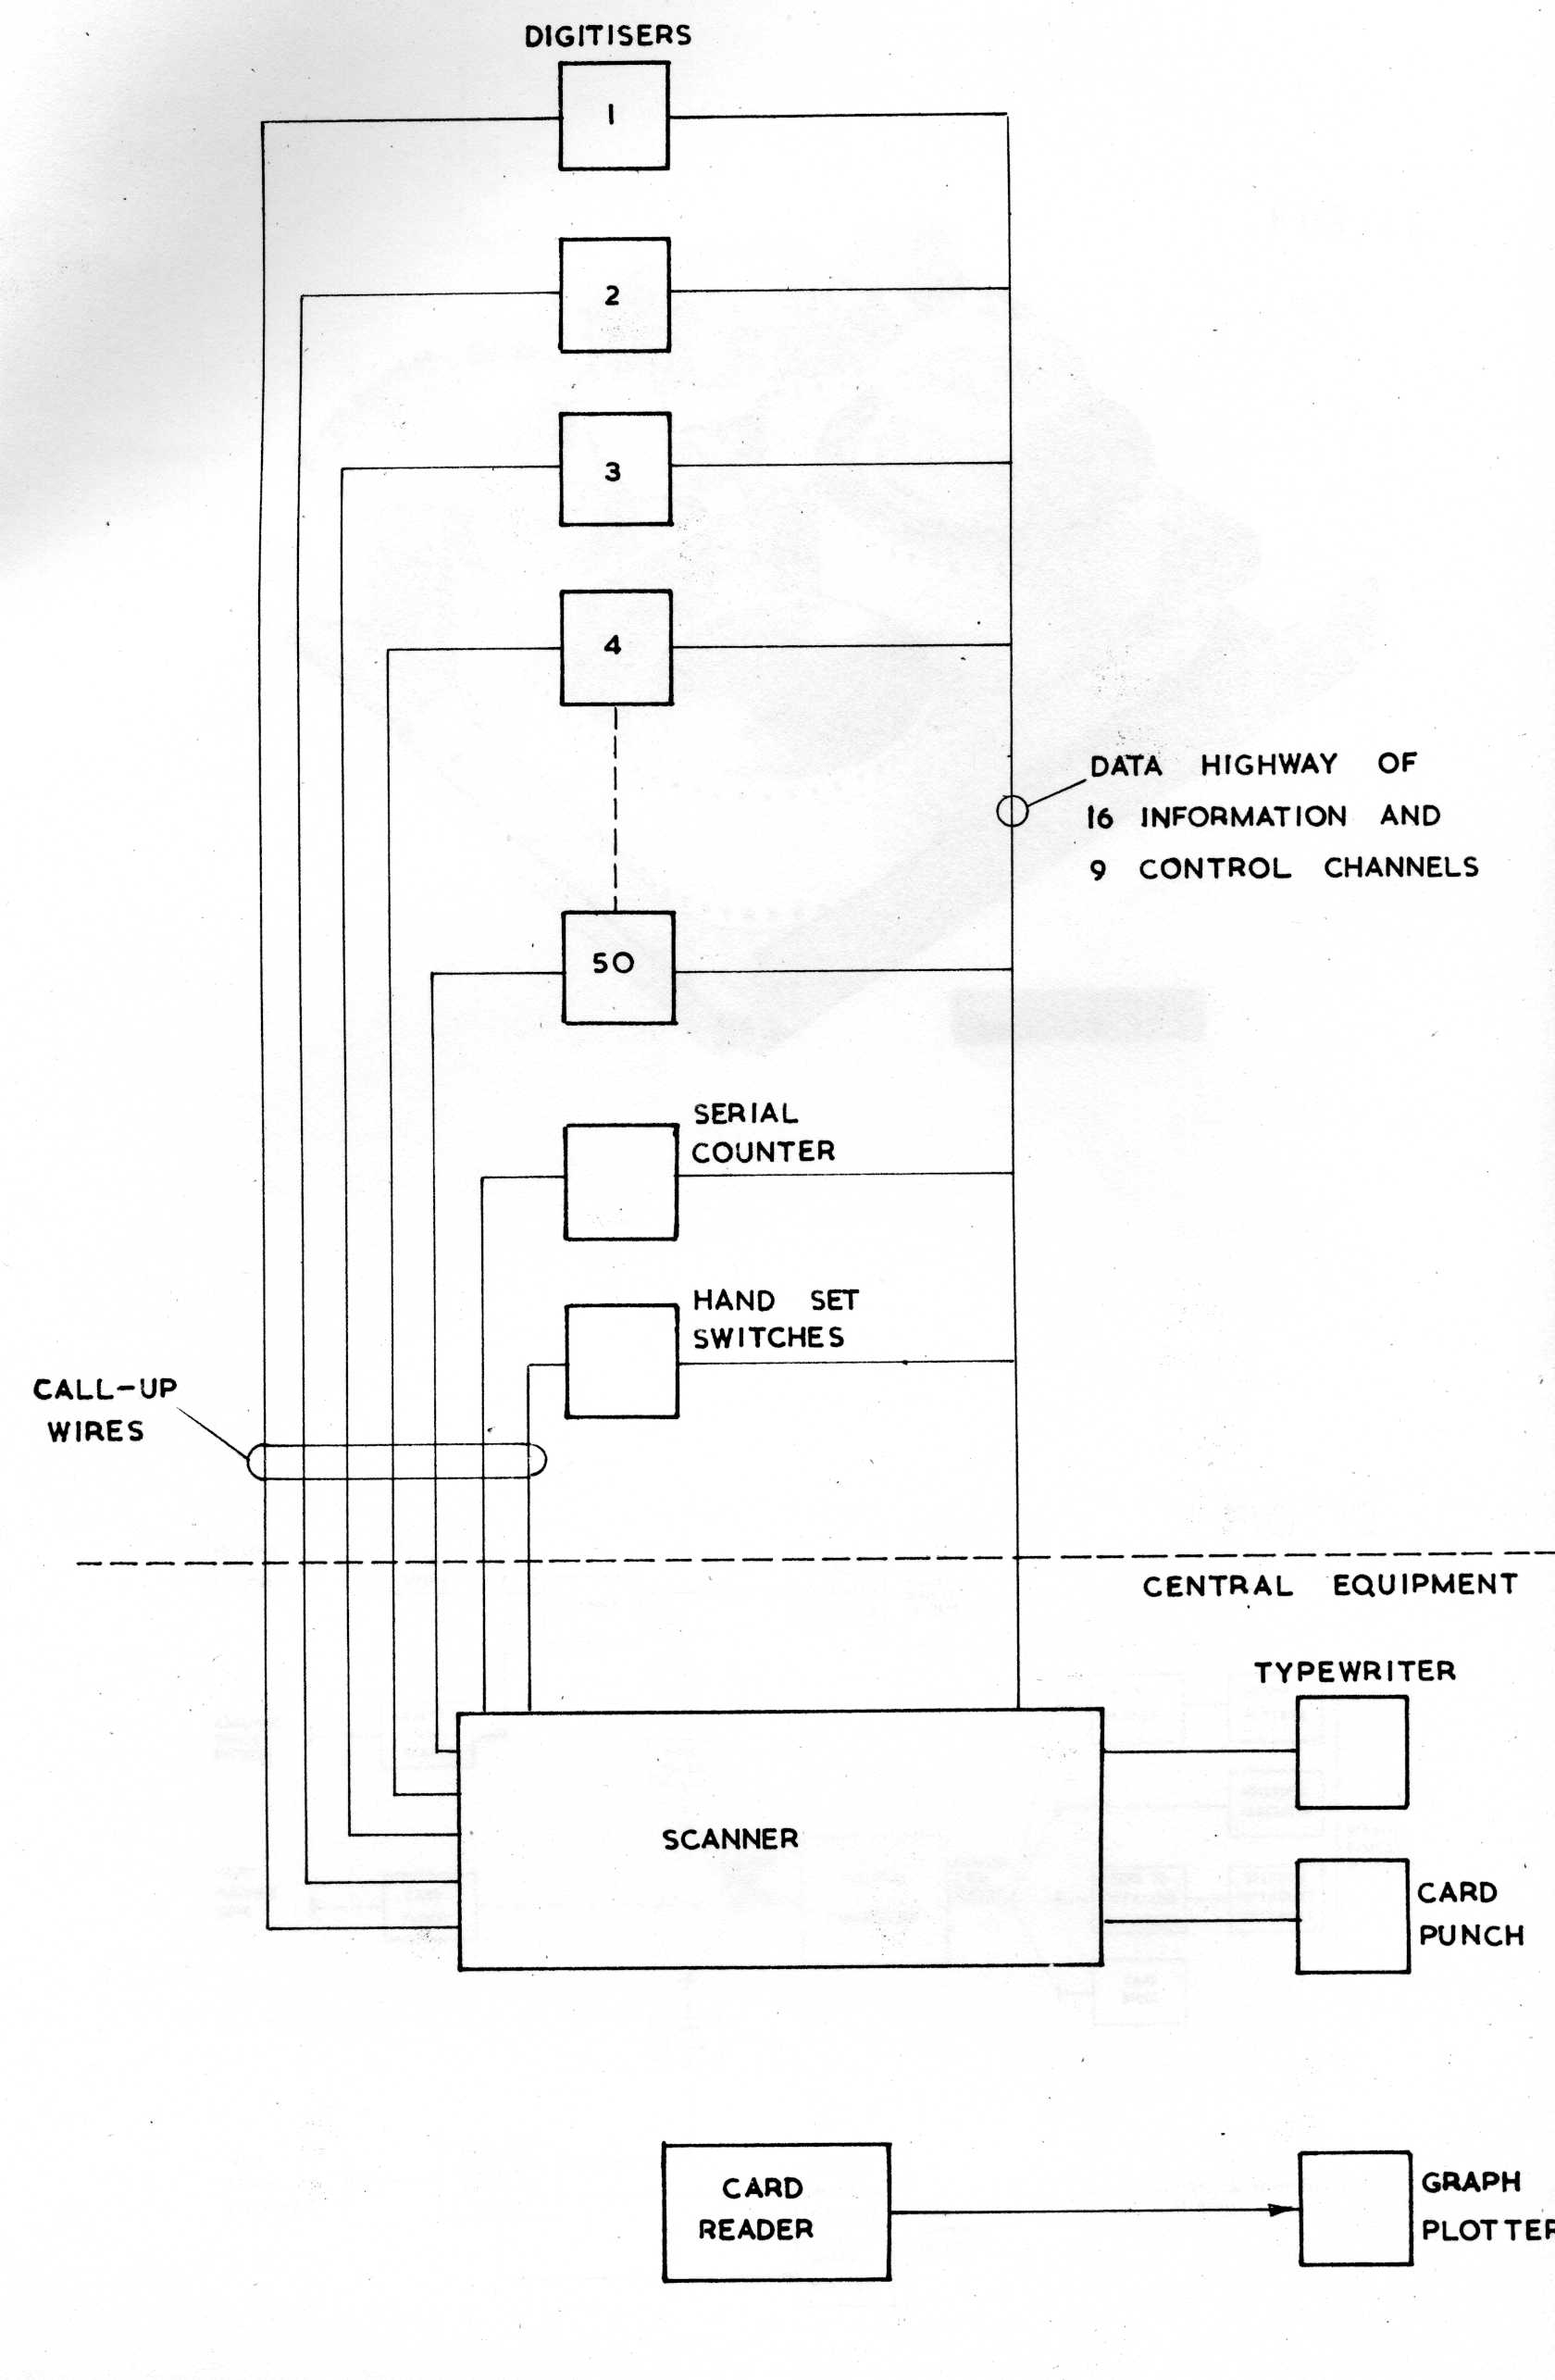
A call wire from the scanner, associated with each of the digitisers, allows an investigate pulse from the scanner to be passed through a selected digitiser and reach the data highway channels in accordance with the patterns set up within the digitiser. This pattern is stored in the scanner in readiness for decoding. The scanner is the heart of the data handling system, and is in complete control throughout. Its function is to call up the digitisers in a predetermined order, transfer their settings as a pattern of pulses along the common data highway back to the scanner, decode the settings into ordinary decimal form and pass the coded information to a typewriter and a card punch. The order in which the various digitisers are called up is determined by making suitable manual cross connections on a plugboard.
Turning now to the future, we may expect improvements in data processing systems for wind tunnels in two main directions; first, the introduction of a fully electrical system with no moving parts, and second, an increase in operating speed. The elimination of moving parts from the system should result in improved life, and reduce the amount of maintenance required. An increase in operating speed would be of particular value in intermittent tunnels where the time available for a test is limited.
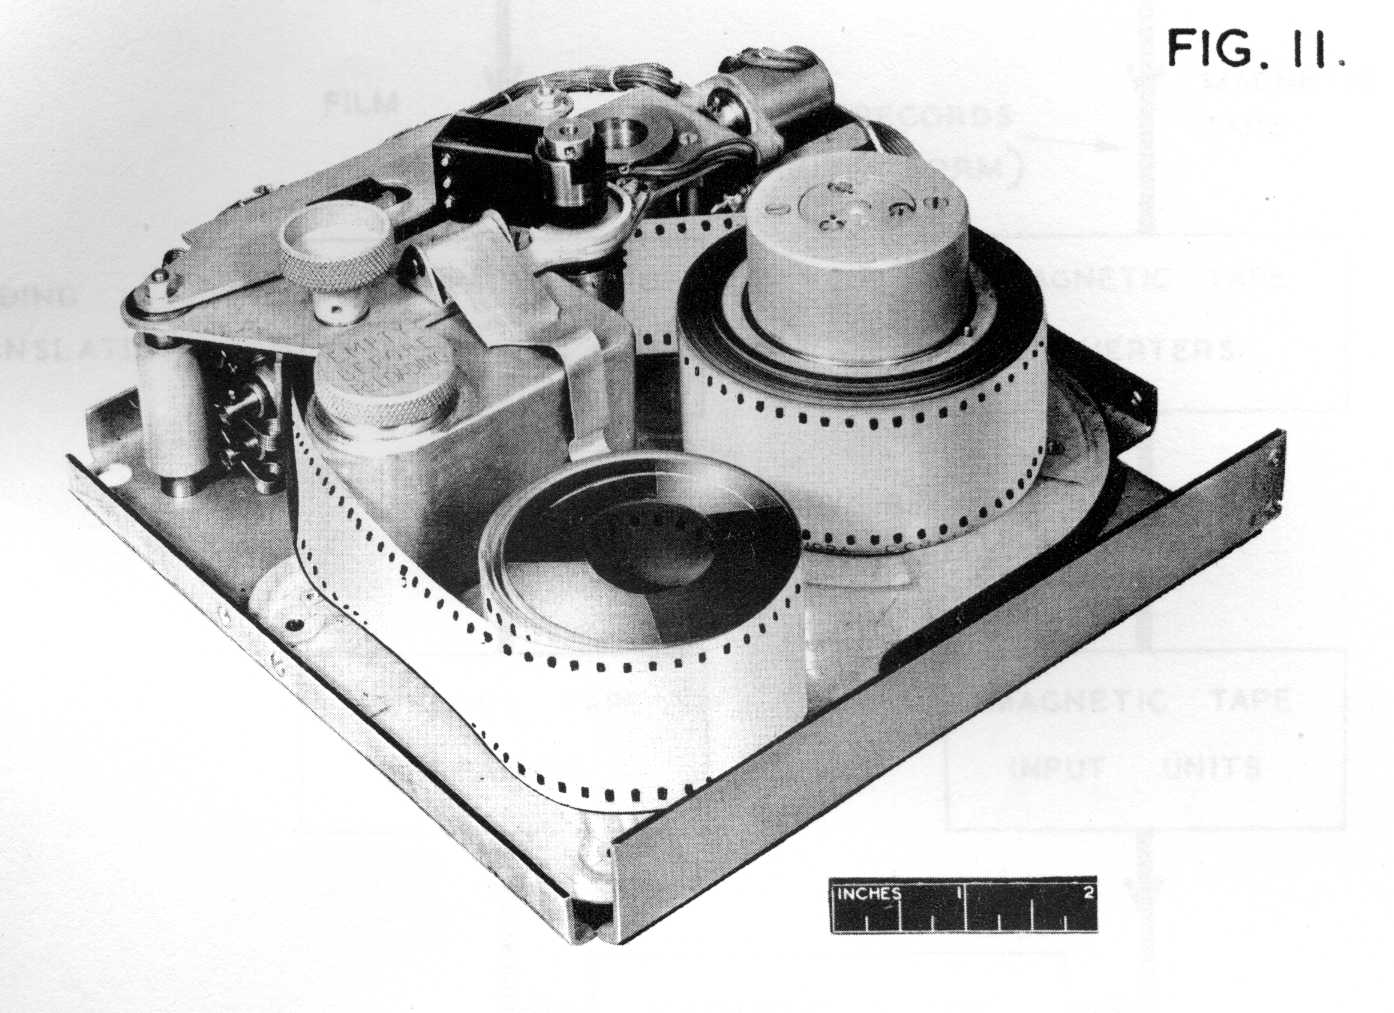
Many of the analogue type trace records processed at R.A.E. are obtained from aircraft flight tests, conversion to digital form being done subsequently on the ground with the aid of the trace reading equipment already described. With the successful development of coded circular scale digitisers, it became a practical proposition to record the primary data in the air directly in digital form. The first approach was to fit standard aircraft instruments with slave units which should follow the instrument pointer without adding extra frictional or inertial loads. Each slave carried a coded scale which could be read at will through a central scanning unit to a multi-channel recorder without any decoding. Figure 11 shows a small digital recorder - a film punch - that has been designed at R.A.E, and used experimentally for recording the response of aircraft to gusts. 35 mm. cine film was selected as the recording medium because of its toughness and convenient width and because a higher density of punching is possible with film than with paper (Table 1). Twelve holes are punched across the film in two groups of six. The overall size of the punch is 8" × 8" × 4" and it can punch groups of 12 holes twenty times per second. If the information is recorded in coded decimal form, an instrument reading can be recorded at each punching operation to an accuracy of 0.1%. The magazine is large enough for the recording of 12,000 such readings, the quantities to be recorded being sampled according to a predetermined programme.
For routine airborne use, however, photographic methods are more attractive than punched film; for one thing, a much higher packing density can be achieved (Table 1). A scheme for recording the instrument readings digitally on a bank of ultra violet or neon lamps, and then photographing them on 16mm. film using a standard air camera has recently been developed at R.A.E. The film is read on the ground with the aid of a standard 16 mm. projector, the negative being projected on to a similarly patterned bank of photo-electric cells. The output from the cells is fed to an electric typewriter or card punch in the usual way. In the first instance two rows of 16 lamps (32 binary digits) will be recorded on each frame with a recording rate of 16 frames per second, or a single shot repeatable after 1/8 second. The packing density is initially 267 binary digits per square inch of film, but as there is room for 12 rows of 16 holes, a density of 1600 binary digits/sq.in. is available if required.
There is little doubt that the trend of development in the field of experimental data processing is firmly in the direction of digitising primary data at as early a stage as possible. Many measuring instruments give an electrical output, with the magnitude of the physical quantity to be measured appearing as a voltage level. In such cases, it is clearly desirable to eliminate a further intermediate analogue stage, such as a shaft rotation. A considerable amount of work on these lines is being done at R.A.E. and elsewhere. We may mention, for example, the recent development of a transistorised analogue-to-digital voltage converter which can deal with 800 binary digits per second. The next stage is to develop an electronic switch to enable the converter to sample a large number of such voltage sources. A system of this kind can be used with a variety of air and ground measuring instruments which give output levels of about 20 volts maximum. Instruments such as strain gauges or thermocouples, where the output is smaller, require some pre-amplification of the signal before digitising, and this becomes expensive when the number of instruments is large. For large installations of transducers giving output at the millivolts level, an electronic scanning switch which is accurate enough to require no pre-amplification remains to be developed.
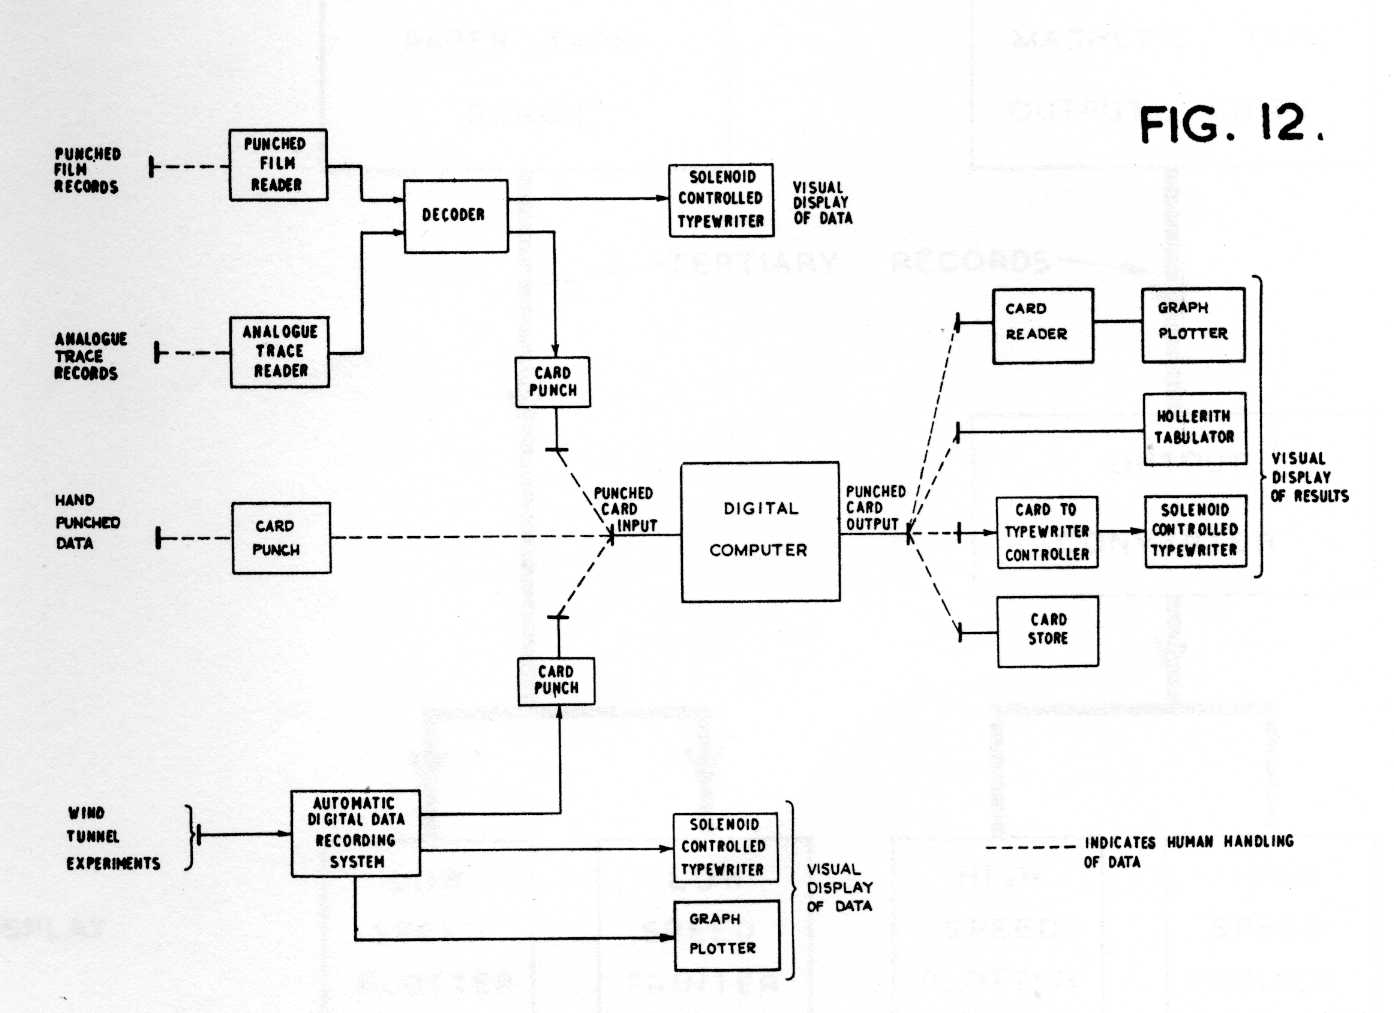
The three data processing systems described in this paper are exhibited side by side, in schematic form in figure 12. In each case the terminal equipment consists of a card punch or an electric typewriter, the Hollerith cards produced by the former being fed by hand into a central electronic computer - one of the R.A.E, DEUCE machines.
The first R.A.E. DEUCE came into operation in May 1955, the second in December 1956. Up to the end of June 1958, between 9000 and 10,000 hours of good computing time have been obtained from these two machines, an average during the last year of about 50 hours per week per machine. About 30% of this has been spent on testing new programmes and carrying out pilot runs, the remaining 70% on production calculations.
It is only fair to point out that the processing of experimental data has occupied the DEUCE computers for little more than 5% of their working time - an average of 2½ hours per week per machine - made up approximately as follows:-
                                 %
Wind tunnel data	            35
Aircraft gust and fatigue data	15
Weapon trials	                25
Miscellaneous experimental
data processing	                25
TOTAL                          100
In assessing these figures, it must be appreciated that much of the experimental data obtained at R.A.E. does not need to be processed on an electronic computer. Some trace records, for instance, can conveniently be analysed with conventional punched card equipment; in other cases the computation is sufficiently light to be done manually with the aid of a desk calculating machine or a slide rule. The small amount of weapon trials analysis shown in the above table is due to the fact that much of the information obtained at the R.A.E, firing ranges is now processed by the contracting firms - often with the aid of their own digital computers. It is of interest to mention that trials data from the largest of these ranges at Aberporth in West Wales - are transmitted, admittedly rather slowly, to Farnborough along a special teleprinter link by land line. The computed results are sent back to Aberporth in the same manner. The information at the sending end of the line is recorded on Hollerith cards; a duplicate set of cards is punched and checked automatically at the receiving end.
We see, then, that the processing of experimental data has occupied, so far, a quite modest place in the automatic computing activities at R.A.E. The emphasis has been on simplicity of design, flexibility of use and economy of hardware, rather than on the provision of the more sophisticated special purpose equipment needed to process large masses of data at high speed. In particular, little use has yet been made at R.A.E. of magnetic tape, either as a digital recording medium or as an auxiliary computer storage medium. This situation will no doubt change in the course of the next few years. However, the use of magnetic tape for the bulk storage of information is becoming so fashionable that some mention should clearly be made of its role in experimental data processing. The example selected by way of illustration comes from the Weapon Research Establishment in South Australia.
This establishment is responsible, among other things, for processing the data obtained from trials at the Woomera Rocket Range. Automatic real time recording is used throughout a trial; some of the information is recorded on film and some on magnetic tape. The subsequent stages in the processing of the two kinds of data are shown in simplified diagrammatic form in figure 13.
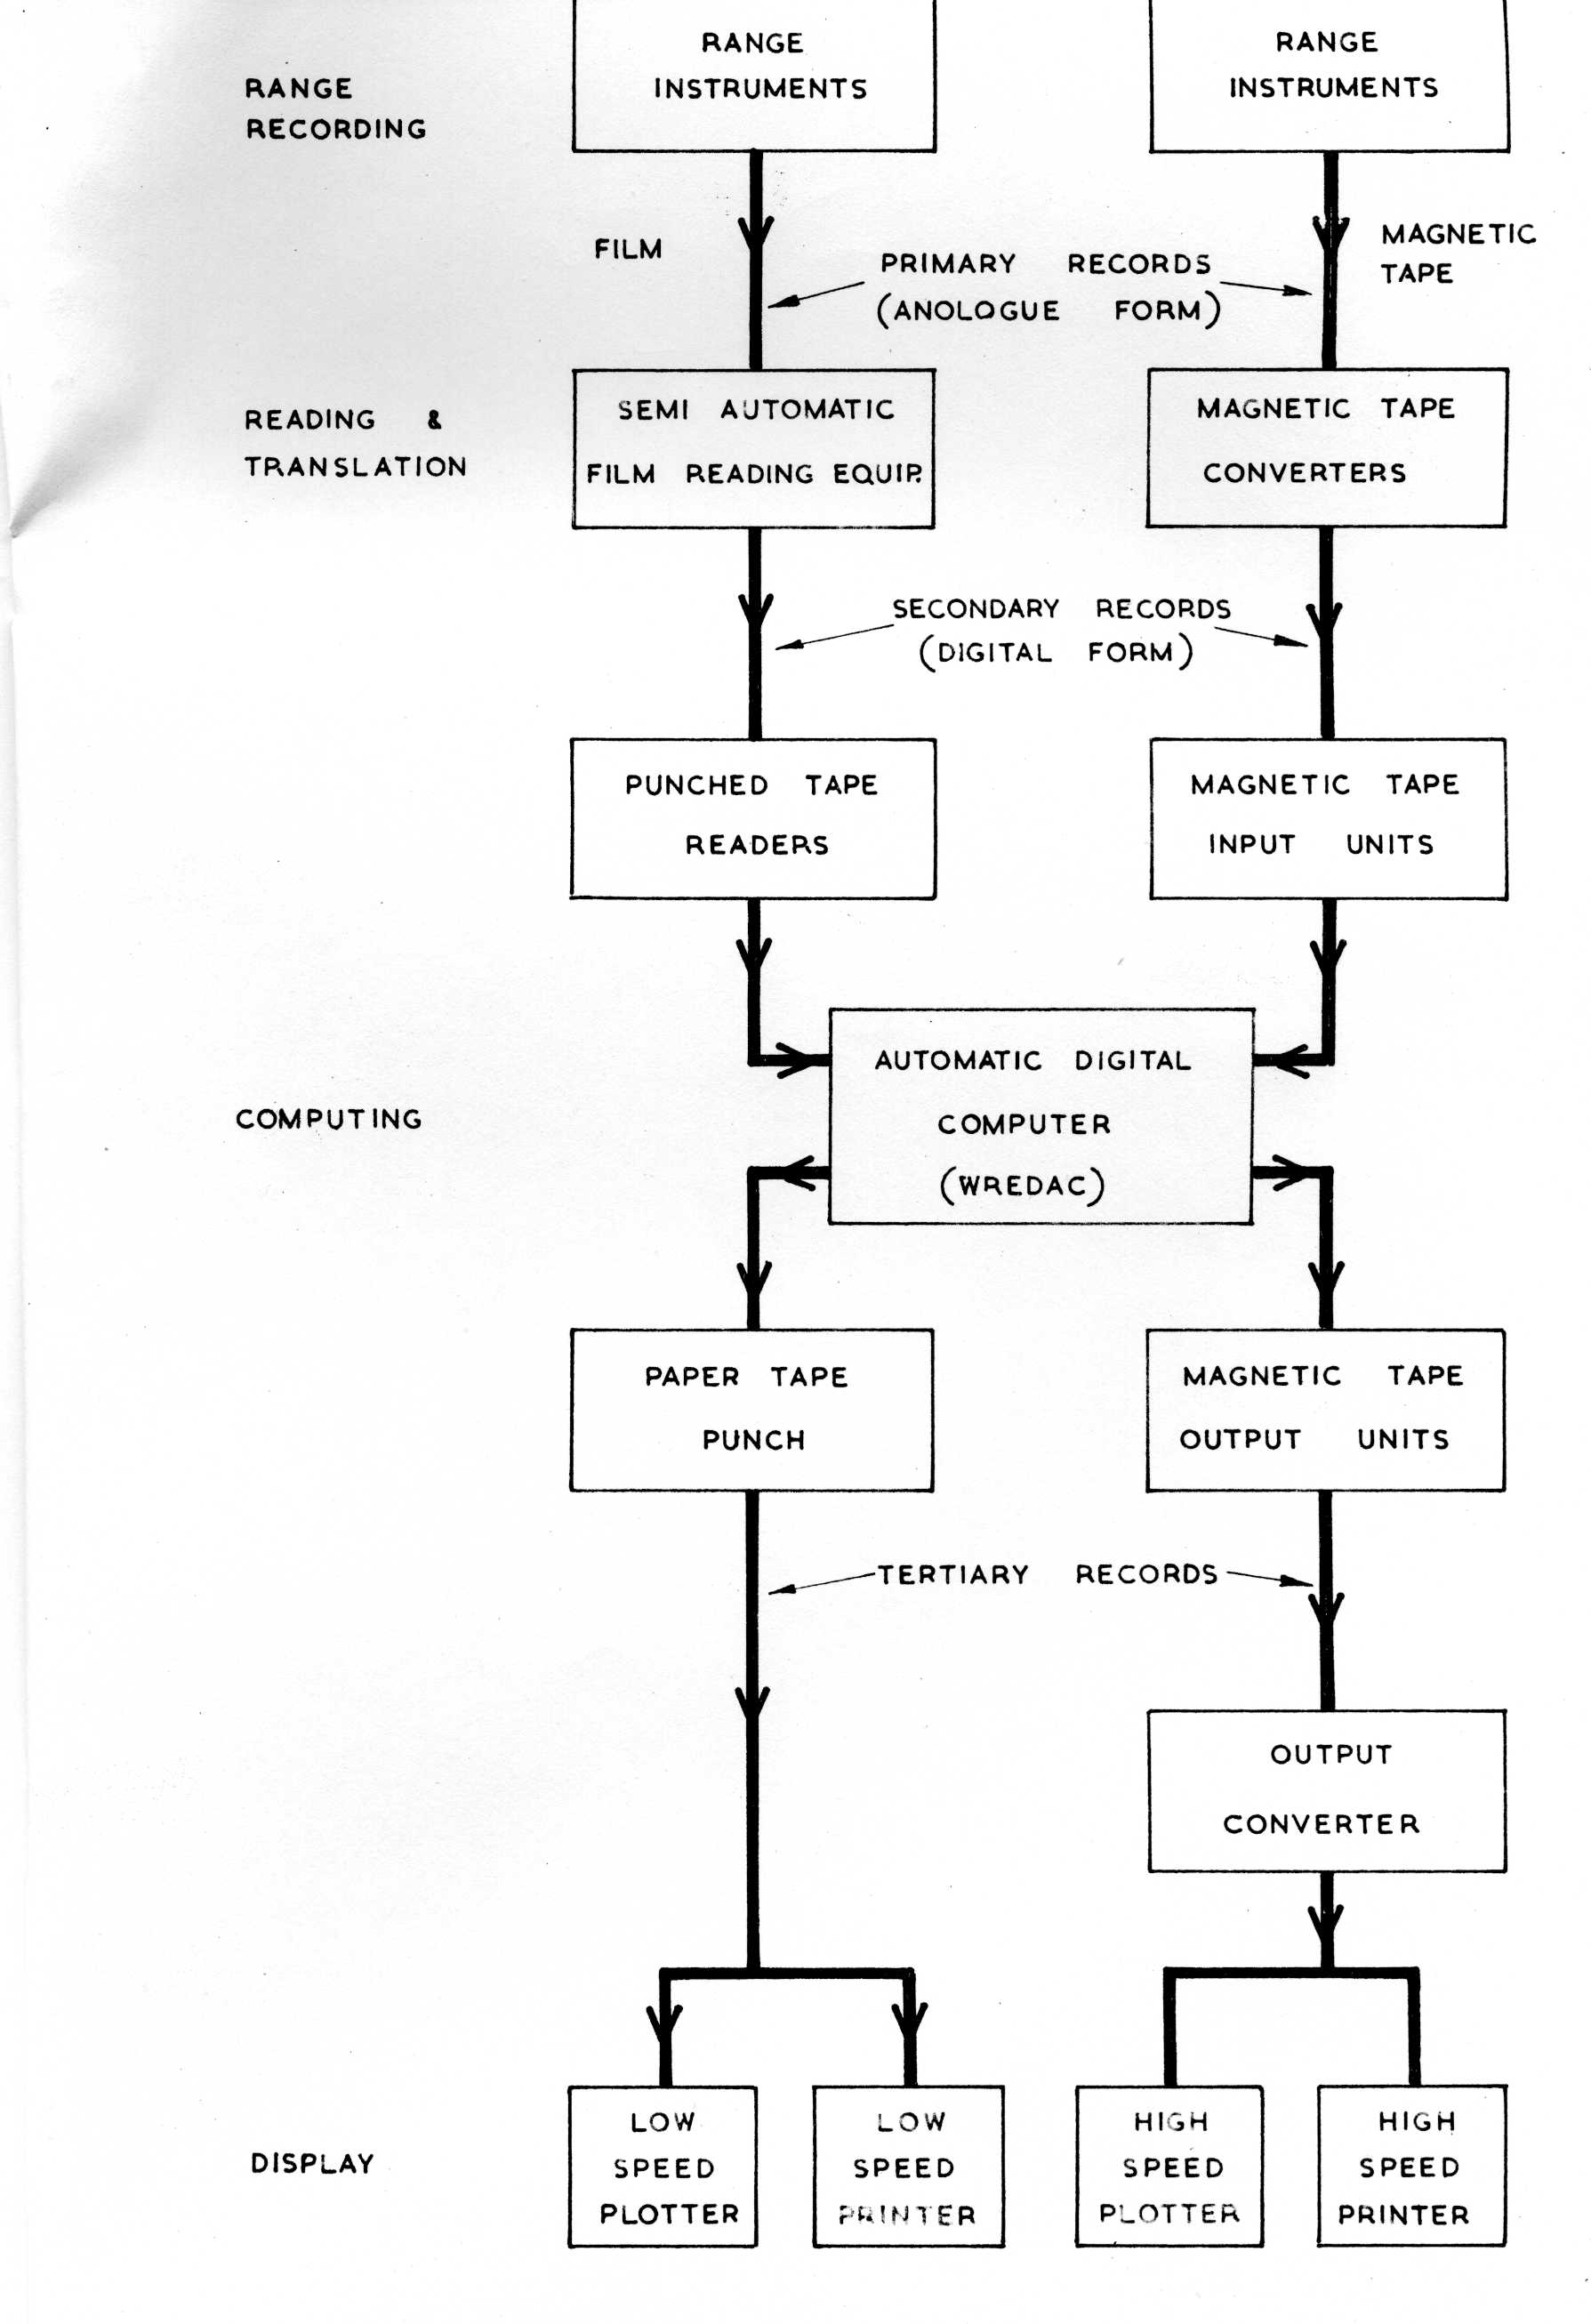
The Australians took delivery of their automatic digital computer (known as WREDAC) in July 1956. The machine was designed to a W.R.E. specification and manufactured by the British firm of Elliott Brothers Ltd. WREDAC belongs to the same family as the Elliott 401,402 and 405 models, but has a number of special features. In particular, it can both accept data and put out its computed answers either on punched paper tape or magnetic tape, as indicated in figure 13.
Little need be said here about the processing of the film records at W.R.E. The techniques are similar to those in use at R.A.E. and elsewhere, as described in paragraph 3 of this paper and in reference 1. The films are read by means of semi-automatic film readers, the output of which is ordinary 5-hole teletape which can be fed into WREDAC for the computing stage. By feeding the output punched tape from the computer into a tape controlled plotting device or into a teleprinter, the final results can be displayed in either graphical or tabular form.
The main interest of the W.R.E, system lies in the other data processing route - as shown on the right hand side of figure 13. Here primary data - obtained from either telemetry or doppler instruments -are recorded directly on magnetic tape, but in analogue form. It will be convenient, for brevity, to focus attention on the processing of information transmitted from the missile to the range instruments by the technique of telemetry.
The main telemetry system installed at Woomera is a frequency modulated time multiplexed 24 channel system with one synchronising channel and 23 information channels. The magnetic tape converter (figure 13) has the following functions:-
Since it is unlikely that all the information recorded from the telemetry sender will be required in digital form, a low speed photographic record is also available which enables the customer to select which part of the record need be accurately processed in digital form. It is possible to programme the converter to digitise and to record on the secondary record only such relevant data. This reduces the length of the tape needed to read into the computer and thus saves valuable time. The range information is recorded at a rate of 75 ins./sec. on up to 3 channels of the 4 channel ¼ inch tape with a constant frequency of 100 KC/s. on the fourth channel. The tape is played back into the converter at the reduced speed of 7.5 ins./sec.
The secondary magnetic tape is read directly into WREDAC, the output of which consists of tertiary magnetic tape giving a record of the computed answers. This record is, of course, quite useless until it has been converted into an intelligible form. The paper tape displays units shown on the bottom left hand side of figure 13 are too slow to match the high rates at which magnetic tape information is recorded and computed. A fast display unit was therefore incorporated as part of the integrated data processing system. The function of this unit is to provide graphical and/or printed displays from the tertiary magnetic tape record which is the output from the computer. When the start switch is pressed, the action of the output converter (figure 13) is to read the number of words required from the magnetic tape records, transform them into an appropriate code and then store this record in serial registers via selection plug boards. These selected numbers are then supplied automatically to the display units, after which a new block of numbers is read in and the action is repeated.
The high speed printer used at W.R E. is a line-at-a-time printing device manufactured by the Bull Co. in France; it can operate at two lines of 92 characters per second. The high speed plotting equipment consists of 4 units operating in parallel, each of which can plot at the rate of 2 points per second.
Various items of equipment which now comprise the W.R.E. magnetic tape data processing system were introduced piecemeal over a period of 3 years, The main stages are indicated in Table 4, which also shows comparative times to process 10,000 points of telemetry data.
| Total Working Hours |
|||||
|---|---|---|---|---|---|
| System | Description | Processing | Hours | Total | |
| 1 | Hand projection of film | Film processing | 8.00 | ||
| Film reading | 48.00 | ||||
| Desk machine computing | Computing | 50.00 | |||
| Hand plotting of results | Hand plotting | 12.00 | 118.0 | ||
| 2 | Semi-automatic film readers | Film processing | 8.00 | ||
| Film reading | 12.00 | ||||
| Punched card computing | Hollerith computing | 28.00 | |||
| Electro-plotter for display | Display by electro-plotter | 8.00 | 56.0 | ||
| 3 | As (2) but WREDAC for computing (paper tape input and output) | Film processing | 8.00 | ||
| Film reading | 12.00 | ||||
| Computing, including punching paper tape | 1.00 | ||||
| Display | 8.00 | 29.0 | |||
| 4 | Magnetic tape recording on range. Automatic reading. Magnetic tape input for WREDAC | Conversion and automatic reading of magnetic tape | 0.25 | ||
| Computing | 0.85 | ||||
| Display | 8.00 | 9.1 | |||
| 5 | As (4) but with magnetic tape output from WREDAC and fast output display equipment | Conversion and automatic reading | 0.25 | ||
| Computing | 0.17 | ||||
| Display | 0.17 | 0.6 |
This table brings out two points. First, the enormous overall saving in time - from 118 hours to less than one hour; secondly, the fact that this saving has been achieved by treating the complete process as an integrated whole. Not only have automatic techniques been applied at each stage, but particular attention has been given to dovetailing the separate stages so as to give a smooth flow throughout the complete process.
It is clear that these general precepts are applicable not only to the processing of information on the performance of rockets or missiles, but throughout the whole field of data processing, from purely clerical activities, such as the calculation cf a payroll (one matter that obviously merits attention is the design of clocking-in equipment to enable an employee's clock card to be fed directly into a digital computer) to the automatic control of the flow of operations in a chemical plant.
This paper should perhaps close on a note of warning. Great as are the advantages of automatic data processing in favourable circumstances, the establishment of such a system is not a matter to be embarked upon lightly. The development, installation and maintenance of the necessary equipment is an exacting and time consuming business. An automatic data processing system is fully economic only when the volume of data to be handled is large and fairly homogeneous, and when the work load is such that the equipment can be operated to something approaching full capacity.
In a research establishment - in contrast to a production plant or a business office- much of the data processing work occurs in small and diverse packets. Furthermore, the requirements are apt to change at short notice due to the emergence of a new bright idea or the appearance of unexpected results. In such situations automatic techniques may have little merit, or at best, should be limited to quite simple devices designed primarily for operational flexibility.
The photographs are published by permission of H,M. Stationery Office; crown copyright reserved.
1. R.H. Tizard and W. T. Bane, Some recent developments in Data Processing Equipment., Transactions of the Society of Instrument Technology, Vol. 7, No. 2, (June, 1955).
2. K.V. Diprose, A Scheme for Automatic Data Reduction for Wind Tunnels. Memo for London A.G.A.R.D. Conf. , (Sept. , 1953).
3. J. F.M. Scholes, The automatic handling of experimental data in wind tunnels. British Communications and Electronics, Vol. 4, p. 604, (1957).
4. E. J. Petherick and A. J. Hopkins, Production of Coded Discs with the aid of Hollerith Cards.
5. E.J. Petherick, A Cyclic Progressive Binary-coded-decimal System of Representing Numbers.
6. E.J. Petherick and G. C. Rowley, A Semi-automatic System for Reading Continuous Trace Records.
7. E.J. Petherick, Recording and Processing Flight Data by Digital Methods.
8. E.J. Petherick and A. J. Hopkins, Some recently developed devices for encoding the reactions of shafts and the displacement of slides.
9. G. C. Rowley, Automatic Data Reduction Equipment for Wind Tunnels.
10. W. C.J. White, Introduction to the W.R.E. Data Processing System.
11. J.A. Ovenstone, The W.R.E.D.A.C. System.
12. G. E, Barlow, The Telemetry and Doppler Data Converter.
References 4-9 are unpublished R.A.E. Reports.
References 10-12 are papers (to be published) read to the Conference on Data Processing and Automatic Computing Machines, held at W.R.E., Australia in June, 1957.
