

Contents
2. The fuel resources of the Earth
That which burns never returns
(A slogan seen on the vans of a fire appliance company)
Timing
No more than a double period can be afforded for this Part, unless sacrifices are made elsewhere.
World consumption of energy
The United Nations statistical yearbook (1965) says that in 1964 the world as a whole consumed energy from fuels equivalent to the energy obtainable by burning nearly 5000 million tonnes of coal. (1 tonne is 1000 kg, very nearly 1 ton.) As there were about 3000 million of us, each person's share was the equivalent of about 1500 kg of coal; that is, about 1.5 tonnes-worth each. But of course the shares were not very even. North Americans consumed about 8.6 tonnes-worth each, and the United States with 6 per cent of the world's population consumed over 30 per cent of the total energy. Western Europeans consumed nearly 3 tonnes-worth each, while the inhabitants of the Far East and Africa consumed one-tenth as much each, equivalent to 0.3 tonne.
Figures 8 and 9
From Statistical Office (1969) Statistical yearbook. United Nations.
This uneven distribution of energy use among areas of the world is not simply a matter of unfair shares. A country cannot use energy if it has few power stations or industries to make fuel-using devices, and the Middle East offers a clear example of the difference between having and using energy. It produced 568 million tonnes-worth, but used only 53 million, so that each person consumed about the same as anyone else in Africa and Asia, that is, the equivalent of about 0.34 tonne each.
The richer countries do help the poorer ones with aid, the total flow of international aid from all sources being estimated for 1960 at about 2.9 thousand million dollars. In 1952, the United Nations report, Measures for the economic development of underdeveloped countries, estimated the need for aid to be about 20 thousand million dollars a year. The largest single contribution to economic aid comes from the United States. The survey (1964) of the U.S. economy, by the Organization for Economic Cooperation and Development, quotes 725 million dollars for government grants and capital in the form of dollar payments abroad for 1964.
The energy figures should suggest at least two questions. How is energy consumption connected with the degree of industrialization, or advancement of a society? What prospects can we see ahead as more and more people want, for example, to have cars which use up petrol, and are made of steel which is costly in fuel to extract and manufacture? Secondly, how big a dent was made in 1964 in the world's stock of coal, oil, gas, and other energy sources as yet untapped?
We shall now consider the second question in detail. The equivalent of a million tonnes of coal represents a large amount of energy. It comes to 2.8 × 10¹⁶ joules. As was mentioned earlier, in 1964 the world as a whole consumed energy from fuels equivalent to nearly 5000 million tonnes of coal. This is 0.14 × 10²¹ joules or 0.14 Q, where Q ≈ 1021 joules and is a unit that has been used in calculations of world energy resources.
So in 1964, mankind used 0.14 Q. Table 1 gives some figures for the total reserves of fossil fuels left in the earth at the mid-twentieth century.
                       Reserves known to       Additional
                       exist, which            resources whose
                       can be extracted        extraction may
                       using present           or may not
                       methods under           be technically
                       current economic        and economically
                       conditions              feasible
coal and peat            24.7 Q                 53.6 Q
oils                      2.0 Q                 27.7 Q
natural gas               0.7 Q                  7.6 Q
oil shale and tar sands   0                     13.1 Q

Total                    27.4 Q                102.0 Q
(Q = 1021 J)
Table 1: Reserves of fossil fuels
Data from Statistical Office (1965) Statistical yearbook. United Nations
Q1 If the world were to go on using energy at 0.14 Q per year, how long would the reserves that we know can be extracted last (assuming that only fossil fuels are used)?
As the reserves that we know can be extracted run out, no doubt men will find ways of tapping some of the 102 units of additional resources. But will the world go on consuming energy at the 1964 rate?
Figures 10
From Putnam, P. C. (1954) Energy in the future, Van Nostrand Reinhold Co.
Figures 11
From Putnam, P. C. (1954) Energy in the future, Van Nostrand Reinhold Co.
Figure 10 shows what has happened in the past, with some guesses about the future, based on the growth of population and the rise in the energy demands of each individual. Back in 1850, the world was spending about 0.01 Q per year; by 1950, this was about 0.1 Q (as we have just seen). Figure 11 shows the cumulative use of energy. In the 2000 years up to 1850, man is thought to have burned between 6 and 9 Q. By 1950, the world had burned nearly twice as much, about 13 Q, so that the century from 1850 to 1950 was nearly as expensive as the previous twenty centuries. Both graphs show what will happen if energy consumption per person increases at 3 per cent and also at 5 per cent per year. These are limits, based on the likely increase of population and industrialization, within which it is anticipated the increase will occur. Over the period 1931 to 1950 the rate of increase was 3 per cent, an increase over the previous period. The rate of increase was, however, far greater for industrialized nations.
Slides
Slides 9.1 and 9.2 give information about world energy reserves, production and consumption.
Slides 9.3 and 9.4 show world energy consumption graphically as in figures 10 and 11.
Slides 9.5 to 9.7 give further information about the growth of energy consumption which might be helpful.
(For details, see the slide list.)
Q2 At a 5 per cent rate of growth of demand, when will the first line of reserves run out? (How old will you be?)
Q3 At a 3 per cent rate of growth of demand, when will the first line of reserves run out? (What will be the age of children now being born?)
Q4 What is the shape of a graph of quantity against time, where there is a fixed percentage increase per annum in that quantity?
The first line of reserves will not last very long. Even the second line of reserves (and it is not known if we can tap them) does not improve the picture very much. A further few hundred years or so and these reserves too would be gone. It is possible that the people of the twenty-first century will regard us as terrible spendthrifts.
Why worry - energy is conserved?
Why should we worry about running out of fuels? Energy cannot be lost; it has merely been transferred from natural gas, coal, or oil, and oxygen, to warm the atmosphere. Why can we not use this energy, assuming we could trap it? There is a link here with Part One: burning was definitely one of the one-way processes. When fuel is burned, something irreversible has been done. Having done it, one can never go back.
Energy resources other than fossil fuels
The Sun delivers about 3000 Q every year to the surface of the Earth, but the energy is very much spread out, being roughly a few hundred watts to each square metre.
This flow of energy can be tapped without using up the store of fuel. The main way of using it is by hydro-electric power generation, but at present this source only provides about 1 per cent of world consumption. It is hard to imagine hydroelectric power being expanded enough to take over from other sources.
The available stock of nuclear fuels in the Earth offers more hope, for a while at least, of our not running out in the near future. If fuel can be bred in reactors from low grade materials, then the reserves of uranium and thorium may last for a long time. The disposal of the radioactive wastes will be a severe problem, however. If it becomes possible to make hydrogen fuse into helium in a controlled way - the reaction that fuels the Sun - then the energy future looks brighter. (The reaction that fuels the Sun is complex, but the above is its net effect. Proposed earthbound reactions involve the use of isotopes of hydrogen.)
Reading
Angrist and Hepler, Order and chaos, Chapter 4.
Ubbelohde, Man and energy, Chapters 4, 5, 7.
Cars and power stations
The motor car is one symbol of industrial society, and it is a great user of energy. The questions that follow invite you to make guesses about the energy used by cars and the energy supplied by power stations. (A professional physicist often has to make rough guesses. It is part of his scientific skill to make those guesses as well as he can, and also to have some idea of how good or bad the guesses may be.)
Q5 Guess how many cars there are in Great Britain. Assume that the population is about 50 million (in fact, the 1971 census calculated it at about 55½ million). What might be the average number of cars per family?
Q6 Guess how much total power there is installed in these cars. (One horsepower is three-quarters of a kilowatt.)
Q7 Guess how much power is installed in power stations in Great Britain. Will it be more or less than the car-power?
Q8 Guess how much petrol the cars would use in a year. How much energy is involved?
(One gallon of petrol is about 4 kg. One tonne of petrol is equivalent to 1.7 tonnes of coal. One tonne of coal is equivalent to 2.8 × 10¹⁰ joules.)
How well was this energy used? The energy accounts for cars suggest that they are rather wasteful. Typical figures are given in table 2 below.
Process using energy                       Percentage used

wind resistance                             10
                                                    20
road friction                               10

transmission, generator, fan, pumps, etc.    5       5
radiator and engine heat losses             35
                                                    75
exhaust, oil, and other losses              40
Table 2
Use of energy by a car driven at a steady speed, say 80 kilometres per hour.
From Burke et al. (1957) Trans. SAE, 65, page 715.
Only about 20 per cent of the power of a car's engine is used to move the car along. Three-quarters of the fuel energy goes directly to heat up the atmosphere. The study of heat and molecules will show, remarkably enough, that this regrettable state of affairs is not due to incompetence on the part of designers of engines. We shall see that it is inevitable that some heat is thrown away. See Inefficient engines.
Power stations also throw heat away; indeed most people recognize power stations by their vast cooling towers. (Figure 12.)
Q9 Figure 13 shows a power station with no cooling towers. How does this power station get rid of its exhaust heat?
Fortunately, power stations are more efficient than cars, and the best of them onvert nearly 40 per cent of the fuel energy to electrical energy. In 1925, the figure for an average power station was nearer 20 per cent. Possible further improvement in the efficiency of power generation is one important reason why people are interested in thermodynamics.
Q10 A question to think about. What might be some of the effects on the environment, and on the world as a whole, of the exhaust heat of the power stations needed to cope with the energy demand?
Slides
Slide 9.9 shows the growth in the number of cars in Britain.
Slide 9.10 presents the data on the energy account for a car.
Slides 9.11 and 9.12 show the power stations also shown in figures 12 and 13.
Supplementary material
This concludes the work we suggest for this Part. The extra suggestions that follow are intended for those who can find extra time and who wish to follow up an interest.
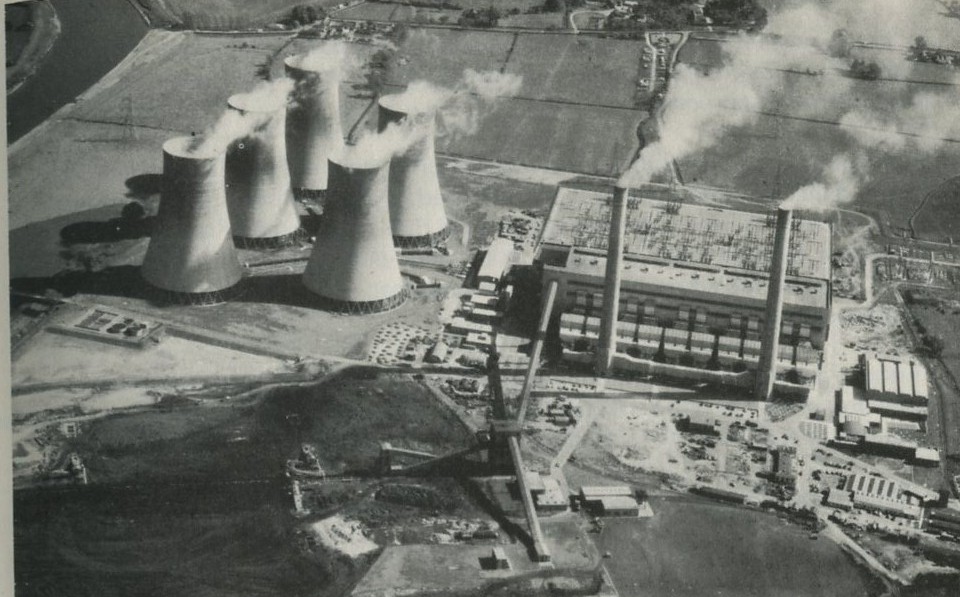
Figures 12: A power station, with cooling towers (High Marnham). Photograph, Central Electricity Generating Board.
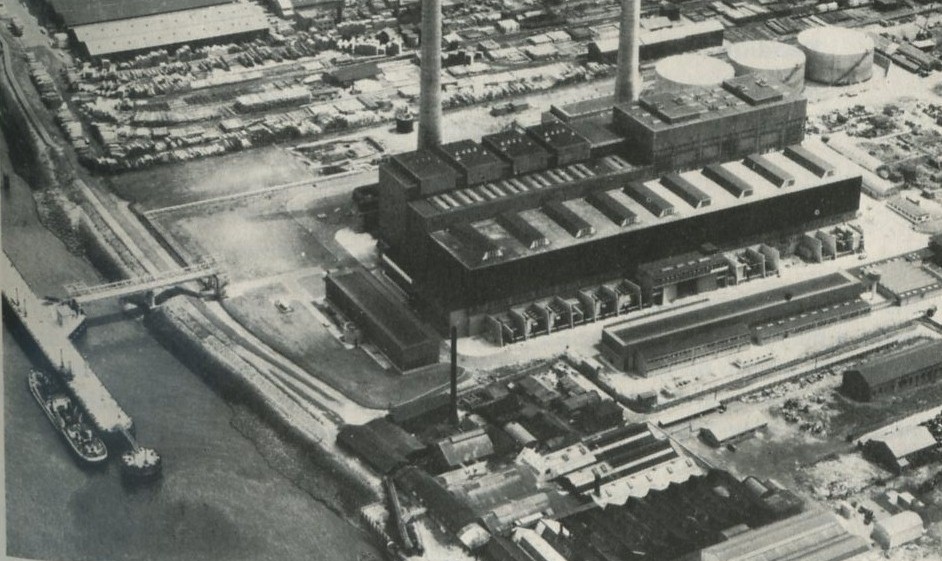
Figures 13: A power station, without cooling towers (Belvedere). Photograph, Central Electricity Generating Board.
How men create energy
In primitive societies, most men can just grow enough food to feed themselves, and gather enough fuel to warm themselves. There is little left over from their basic needs for other purposes.
The beginning of coal mining made an important change in this situation. The energy available from burning the coal mined by one man was some 500 times larger than the food-energy needed to keep that miner healthy and working. The coal could then be used in engines to do more work; each man-day of a miner's effort created the equivalent of several more man-days of work which could not otherwise have been obtained.
This may sound desirable, but it has some social consequences that are being felt more and more. All that unskilled labour can offer is energy, and alternative sources of cheap energy leave the unskilled with little to offer in competition.
Q11 Guess how much work-energy a man can produce in a working day.
Q12 How much would an Electricity Board charge for supplying as much energy as the work-energy produced by a man in a day?
Q13 What would be some of the social consequences of always using the cheapest source of energy?
Reading
Angrist and Hepler, Order and chaos, pages 79-83.
Ubbelohde, Man and energy, pages 88-93.
Feeding the world
The conservation of energy makes no exception for men. Just to stay alive and warm, a person needs perhaps 5 × 10⁶ J of food-fuel every day. More is needed if he is to be able to do any work, or even just to be able to move around; say 107 J every day. This food-fuel has to be grown, and its energy comes ultimately from the Sun, which delivers about 6 × 10²² J, or 60 Q, to the top of the atmosphere every day. Not all the energy reaching the top of the atmosphere reaches the Earth's surface: the amount that does so is about 30 Q every day. Less than half of this energy, say 10 Q, is available for photosynthesis. The present plant populations on land and at sea use about 1/5000 of this energy in photosynthesis, because they cannot possibly catch and use it all. So the Earth can produce roughly 2 × 10¹⁸ J (2 × 10⁻³ Q) edible joules per day.
Figures 14
Data from Thomson, W. S., 5th revised edition (1965) Population problems, McGraw-Hill.
If human beings ate all this food, using 107 J per day, the maximum population would be 2 × 10¹⁸/107, or 2 × 10¹¹ people, about 100 times the present population. Certainly, one could argue that there is scope to use more of the energy available for photosynthesis, and so, that a large population could be supported. But one must also remember that the above is the very crudest sort of calculation, which does appalling violence to such a complex system as the interlocking life forms on the Earth's surface. It allows nothing for other animals or for plant life which does not contribute to food. Quite apart from the moral questions raised by the destruction of other species in order that a large population of men can exist, such other species are essential to our survival.
The oxygen in the atmosphere is continually regenerated by plants, most of it by primitive sea plants. The nitrogen, needed for growing food, is regenerated by chains of types of bacteria. All these must be fed, too. Men lack the ability to produce an enzyme capable of digesting cellulose, and we rely on grass-eating animals to do it for us, eating them in turn.
Nor could a large population use as much energy as it might wish for heat, light, and industry (and the above calculation leaves no solar energy to spare for this). Only 1010 people, using energy at the rate now current in the U.S.A., would deliver enough energy to warm up the earth and sea at a rate equal to about 0.1 per cent of the rate at which energy arrives from the Sun (unless the energy came direct from the Sun, via solar cells converting it to electricity, when this energy would have been delivered to the Earth anyway). This extra energy would ultimately warm up the Earth, and would, before too long, raise the Earth's temperature to the point at which the polar ice caps would melt, Moscow would then become a seaport and London and New York would be under water.
Whatever one's view of the population question, there is no escaping the fact that there does exist a maximum human population that the Earth can support. Those who think we are close to it already will put population control at the top of the list of priorities facing mankind.
Reading
Angrist and Hepler, Order and chaos, Chapter 6.