

Contents
-
6. Uses of thermodynamic ideas
- Example 1: Volume change of a gas and the Kelvin temperature
- Example 2: The vapour pressure of water
- Example 3: Rate of reaction
- Example 4: Conduction in a semiconductor
- Example 5: The entropy of a substance
- Example 6: Using entropy values
- Example 7: Inefficient engines
- Engines which cannot help being inefficient
- Entropy and engines
- Example 8: Cells as energy converting devices
- Entropy effects on a cell voltage
- Concentration and cell voltage
6. Uses of thermodynamic ideas
The law that entropy always increases - the Second Law of Thermodynamics - holds, I think, the supreme position among the laws of Nature. If someone points out to you that your pet theory of the Universe is in disagreement with Maxwell's equations - then so much the worse for Maxwell's equations. If it is found to be contradicted by observation - well, these experimentalists do bungle things sometimes. But if your theory is found to be against the Second Law of Thermodynamics I can give you no hope; there is nothing for it but to collapse in deepest humiliation. This exaltation of the Second Law is not unreasonable. There are other laws which we have strong reason to believe in, and we feel that a hypothesis which violates them is highly improbable; but the improbability is vague and does not confront us as a paralysing array of figures, whereas the chance against a breach of the Second Law (i.e. against a decrease of the random element) can be stated in figures which are overwhelming.
Sir Arthur Eddington (1928), Gifford lectures, 1927: The nature of the physical world. Cambridge University Press.
Examples of uses and applications of thermodynamic ideas
This Part contains a number of short, independent sections, each giving an example of a use of ideas developed in the rest of the Unit. The aim is to illustrate that these ideas have a very wide range of applications, in physics, in chemistry, and in engineering. Time is too short to allow each example to be developed in any great depth, or with any care for detail. In any case, to develop it in that way might defeat the main purpose at this stage, which is simply to allow students to see the broad sweep of problems encompassed, rather than to teach them exactly how any one problem is solved.
We suggest, therefore, that two of the following examples should be selected, according to the tastes and ability of the class. It may be that teachers will feel able to base a short talk on the other examples, enough to show the range of ideas involved. Such a summary should, in any case, introduce the Second Law at least in terms of the principle that W does not diminish in any spontaneous change, whether or not the quantity entropy (S = k ln W) is mentioned.
If Part Five is omitted, there may be up to a week available for this Part, but the choice of examples will be restricted, as explained below. If Part Five is tackled, all the examples become accessible, but except with the cleverest students, time will be very short.
Choice of examples
Examples 2, 3, and 4 can all be used without requiring previous work from Part Five of the Unit. It might be possible in the same circumstances to make something of examples 1 and 5, but these are mainly intended, with examples 6, 7, and 8, to follow work on Part Five.
Example 1 uses the value 2N, for the factor by which the number of ways of arranging particles in a box is increased when the volume is doubled, to provide another means of estimating the value of the Boltzmann constant in a laboratory experiment.
Example 2 uses the Boltzmann factor to indicate in a general way why the vapour pressure of water increases with temperature, and to relate the rate of increase with the energy needed to evaporate water molecules.
Example 3 uses the Boltzmann factor to discuss the influence of temperature on the rate of a chemical reaction. It offers some striking experiments and, as a valuable link with chemistry, deserves rather a high priority in the selection of examples.
Example 4 uses the Boltzmann factor to explain the rapid increase in electrical conduction of a semiconductor material, when the temperature rises. It offers an experiment every student can do.
Example 5 introduces entropy. The values of entropy for various substances are discussed, in an attempt to make this quantity seem like any other physical quantity to which one is already accustomed, such as energy or momentum. It could be of particular interest to chemists.
Example 6 follows up the introduction of entropy in example 5, by using it to show how, in general, one might predict or understand the direction of a chemical reaction. This example links closely with work done in Nuffield Advanced Chemistry, Topic 17.
Example 7 deals with the inefficiency of heat engines, arguing from the non-diminishing property of the total entropy to the necessary inefficiency of an engine, rather than, as is customary, in the other direction. Given earlier work, this should prove a rather easy example. It has value as a very practical and socially significant consequence of ideas in this Unit.
Example 8 discusses electric cells as energy converters and shows how the voltage of a cell will depend on temperature and on concentration. This example should be found to tie in quite closely with work on cell and half-cell reactions that is likely to have formed part of an Advanced chemistry course.
Example 1: Volume change of a gas and the Kelvin temperature
The air inside a bicycle pump will never, all by itself, be found in one half of the pump. Nothing prevents the molecules from happening to place themselves all in one half, but that they should all independently do so would be too great a coincidence.
Figure 74
Of all the ways of placing N molecules within the pump only one way in 2N ways has all of them in one particular half.
If the volume of a gas, which consists of molecules which move independently of one another and themselves occupy a negligible volume, is halved, the number of ways is divided by the enormous factor 2N, and we conclude that such a reduction will never occur.
But the volume of the air in a bicycle pump can easily be halved: one just has to push the piston in.
A weight placed on top of the piston will also do the job (figure 75) and the lowering of such a weight involves no change in numbers of ways. But if the process happens. it cannot be that, overall, the number of ways diminishes by a large factor like 2N.
When the experiment is tried (as if, absurdly, to check that it can be done) another feature is noticed. The gas or the cylinder becomes warmer, or both do. The energy transformed by pushing in the piston becomes spread out over the molecules of the gas and the cylinder. In addition to the decrease in number of ways by a factor 2N, we must reckon in the increase in the number of ways arising because this energy is now spread out over many molecules.
Figure 75: Halving the volume of a gas, using a falling weight. Diagram b shows a way of doing this which keeps the piston nearly in equilibrium at all times.
If the piston is at each stage pushed just hard enough, but no harder, than is needed to compress the air in it a little more, the minutest reduction in the force on the piston would allow the gas to expand back a little. The process can be made two-way. If it can, there can be no overall change in the number of ways, for if there were the process would happen pretty well inexorably in one direction.
We shall consider one (not the only) means of achieving a two-way (the technical term is reversible) compression, which can be done in the laboratory.
The air is kept in an aluminium pump cylinder, and this cylinder has a much greater heat capacity than the air in it, so that this air is kept at an almost steady temperature, most of the energy transformed in compressing it going to the cylinder. A trial with an aluminium bicycle pump shows that the temperature change of the cylinder is indeed very small.
The energy transformed can be found in more than one way. It is possible to measure how much electrical energy is needed to warm the pump cylinder by the same amount as is observed when the air is compressed. It is also possible to calculate the energy transformed from the changes of pressure and volume, as in figure 76.
Figure 76: Calculation of energy transformed from a p-V graph.
In one such experiment, in which the volume was halved, the energy transformed was close to 3 J. Neglecting the small amount of extra energy in the air in the pump, the change ΔU in the energy of the cylinder was thus about 3 J. The increase in the number of ways of sharing quanta of energy amongst the atoms is given by
Δ ln W = ΔU/kT.
But we know something about Δ ln W, because it must exceed or be equal to ln 2N, if the number of ways overall is not to diminish. Supposing that Δ ln W = ln 2N = N ln 2, we have, at room temperature 300 K,
N ln 2 = 3/300 k.
N is the number of molecules in the cylinder, which can be calculated from the Avogadro constant, knowing the volume of the cylinder. In the experiment being reported, N was 11 × 1020.
Using this value gives, for k
k= 1.3 × 10⁻²³ J K-1.
The experiment is crude, but it illustrates how the Boltzmann constant can be found, using nothing more elaborate than a bicycle pump, employing a gas as a means of counting ways.
Demonstration 9.10: Boltzmann's constant and the behaviour of a gas
 1070  gas energy transfer apparatus
   77  aluminium block
   75  immersion heater
   59  l.t. variable voltage supply
 1064  low voltage smoothing unit
   70  demonstration meter 2
 71/2  dial for demonstration meter, d.c. dial 5 A
71/10  dial for demonstration meter, d.c. dial 15 V
 1001  galvanometer (internal light beam)
   2B  copper wire, 32 s.w.g., bare
 1054  constantan wire, 32 s.w.g., covered
 44/1  G-clamp, large
 1053  slab of expanded polystyrene
 1053  Sellotape
 1055  measuring cylinder, 100 cm3
   42  lever arm balance
 1000  leads
Figure 77: Boltzmann's constant and the volume change of a gas.
A metal bicycle pump is used. An aluminium pump, whose heat capacity does not exceed 50 J K-1, is suitable. The mass of the pump casing and the volume of its interior are both required. The latter can be found by filling the casing with water (drying it and oiling it afterwards).
Conceptually, it is easiest to compress the gas. In practice, it is simpler to expand it, so that the whole of the casing is involved in the temperature change. To do this, one must reverse the washer on the piston, and seal off the end of the pump with a screw or with adhesive tape. If it is preferred to compress the gas, a guess will have to be made as to how much of the casing has been warmed. The end of the pump will then need to be sealed with a screw.
The temperature change of the casing is indicated by a copper-constantan thermocouple arranged as shown in figure 77. The × 1 range of the galvanometer is needed. A double junction couple, one junction being kept in a large heat sink (the aluminium block), is necessary. The piston is then pushed in (or pulled out) once, so as to halve (or double) the volume of the air. (If the volume ratio is not 2, but is f, the expression 2N just becomes fN.) The galvanometer should deflect by about two to four small divisions. It takes about 15 seconds for the full deflection to be attained.
A finger placed for a moment on the thermocouple produces a large deflection, indicating that the temperature change is very small, and also shows from the direction of the deflection whether the casing was warmed or cooled in the experiment. This test also makes it clear that the pump must not be handled anywhere but by the piston handle, when making the volume change.
To measure the energy transformed electrically, it is convenient simply to put an electrical heater in the large aluminium block. It the heater is switched oft when the deflection reaches 50 divisions, the final deflection reached will be some 100 divisions.
The energy required to warm the aluminium pump cylinder by the observed small amount can then be calculated by proportion, reducing the energy supplied to the aluminium block in the ratio of the two deflections and in the ratio of the masses of the pump cylinder and the block.
Note to teachers
In this experiment, the air in the pump undergoes a more or less isothermal, more or less reversible, change of volume. In an isothermal change, the internal energy of the gas is unaltered, all the energy transformed as work appearing as energy used to warm the surroundings very slightly. For the change to approximate to a reversible isothermal one, the piston must in principle be pushed with a force only infinitesimally larger than is needed to keep the volume constant.
In practice, the pump can be pushed in or out sharply. The surroundings of the gas must have so large a heat capacity that the temperature rise of the whole system is also infinitesimal.
PSSC, College physics, uses the equilibrium between an expanding gas and a heat sink as the major means of arriving at Δ ln W = Q/kT (where Q is the heat exchanged between gas and sink). The argument is given there very fully, though the entropy is given the non-standard meaning ln W rather than k ln W. See Chapter 22.
Example 2: The vapour pressure of water
How does one dry damp washing? It can be hung out on a windy day, or it can be warmed. Why does warming help? Because the water evaporates more easily, one might say. The Boltzmann factor e-E/kT turns out to be the main basis of this piece of common experience.
A molecule must acquire energy it it is to escape from liquid water. Part of this energy is needed to pull it away from other molecules, and part is needed to push back molecules in the air or vapour above the liquid. The energy needed can be measured by finding how much electrical energy is needed to evaporate a measured amount of water. The value per mole is ΔH ≈ 40 kJ mol-1. The energy per molecule is ΔH divided by the Avogadro constant, which is L = 6 × 10²³ mol-1, so the energy per molecule ΔH/L ≈ 7 × 10-20 J.
At washing-line temperatures, say 300 K, the energy kT is about 4 × 10-21 joule, so the ratio (ΔH/L)/kT is about 17. (Actually, ΔH changes with temperature somewhat, but we shall ignore this correction.)
The Boltzmann factor e-E/kT gives the ratios of numbers of particles in two energy levels different by energy E. The extra energy per molecule ΔH/L is not a quantity exactly like E, but if the proportion of molecules with exceptionally high energy (here 17 times the energy kT) is small the factor e- (ΔH/L)/kT is quite a good guide to the proportion of molecules which will acquire a large energy. This works because the proportion is small, so that even when the proportion changes as the temperature changes, the numbers in lower levels are scarcely affected.
The importance of the factor lies in its great sensitivity to changes in temperature. At T = 300 K, the factor is about e-17. It takes only a small rise in temperature (to about 340 K) to turn the 17 into 15. But the factor e-15 is e2 ≈ 7 times larger than e-17, which means that this modest rise in temperature produces about 7 times as many molecules able to evaporate.
A fair guide to the number of molecules able to evaporate in a given time is the pressure p of vapour in equilibrium with the water. The ideas sketched here suggest, then, that p might vary with T in the form
p ∝ e- (ΔH/L)/kT.
In fact, the arguments we have used are very loose, and the variation has the general form
p = f(T) e -l!.H!L p = t(T) e- (ΔH/L)/kT,
but the function f(T) usually varies more slowly with temperature than the exponential term, so that over restricted ranges of temperature the exponential term is the one that matters. See Bent's, The Second Law, Chapter 33, for a treatment based on changes of entropy.
A simple way to measure the variation of vapour pressure with temperature is to use the fact that water will just boil at a temperature where the vapour pressure reaches the outside pressure on the water. If p varies in the way suggested, then,
ln p = - (ΔH/L)/kT + constant
Values of ln p plotted against 1/T would then give a straight line, as in figure 78. The slope should be -ΔH/kL, so the slope can be compared with ΔH/kL calculated from a measurement of ΔH. The experiment can be used to give an estimate of k.
Figure 78
Experiment: 9.11 The vapour pressure of water
9.11a Energy needed to evaporate water
  1004/2    voltmeter (10 V)
  or
     179    d.c. voltmeter (0-15 V)
  1003/5    ammeter (1 0 A)
     176    12 volt battery
      75    immersion heater (totally enclosed type)
    1055    test-tube, hard glass, 150 × 25 mm
     507    stop watch or stop clock
     543    chinagraph pencil
    1055    burette
    1053    slab of expanded polystyrene with hole to take test-tube
    1053    Sellotape
    1000    leads
            supply of boiling water
Figure 79: Electrical heater used to evaporate water.
9.11b Variation of vapour pressure with temperature
    67 Bourdon gauge
  1054 rubber pressure tubing
   548 round-bottomed flask (250 cm3)
   542 thermometer ( -10 to 110°C)
  1055 T-piece
  1055 bung with 2 holes (for thermometer and T-piece)
   522 Hoffmann clip
   508 Bunsen burner
   511 tripod
   510 gauze
  1054 piece of porous pot
 503-6 retort stand base, rod, boss, and clamp
9.11b Energy needed to evaporate water
Any of the well-known means of measuring the energy needed to evaporate water will do. A simple, though rough, method is illustrated in figure 79. A test-tube, with an insulating jacket which may be a slab of expanded polystyrene with a cylindrical hole cut in it, has a 12 V immersion heater put in it. Hot water is poured in up to about 25 mm from the top of the tube, and is brought to the boil. After any water that was going to boil over has done so, the water level is marked with a wax pencil, with the heater switched off.
The heater is then switched on for about 300 s; current, p.d., and time being recorded. After this period, the volume of water which has boiled away is found by adding water to the test-tube from a measuring cylinder, until the water level in the tube is restored.
Heat losses during the experiment can be minimized by replacing the insulating jacket by a beaker full of boiling hot water. Using the jacket, an estimate of the heat loss in 300 s can be made by switching off the heater for 300 s, and then measuring the time needed to bring the water back to the boil.
A better method is to boil away water in a thermos flask which stands on a balance, again using an immersion heater. See Jarvis, W. H., School science review, March 1972, 53, No. 184, page 596.
9.11b Variation of vapour pressure with temperature
The principle of the method illustrated in figure 80 is to observe the pressure at which water just boils at various temperatures below the normal boiling point, using a pressure gauge connected to a flask in a sealed system with as little air in it as possible.
Figure 80
The flask, supported by a retort stand and clamp, has a little water in the bottom and a piece of broken pot to reduce bumping. The thermometer bulb should just touch the water surface. One arm of the glass T-piece is joined by a short length of pressure tubing to the Bourdon gauge. It is convenient to rest the gauge on a box or support near the flask.
With the screw clip open, boil the water for several minutes to drive out as much air as possible. With the flame removed and when boiling stops, the clip is closed tightly.
As the water cools, the pressure falls. Having removed the tripod and gauze, warm the flask gently with a small flame until the water just boils again. Remove the flame, and read the temperature and pressure. This process is repeated at lower pressures and temperatures, by allowing the flask to cool for longer before warming it again. A pressure of about 1/4 atmosphere can be reached.
The water should boil as little as possible in the closed system, or a good deal could distill into the gauge. The gauge should be tapped before taking a reading.
Example 3: Rate of reaction
Why is it quicker to cook peas in a pressure cooker than in an open pan of boiling water? The reason has nothing directly to do with the pressure: it is that the water in a pressure cooker boils at a higher temperature (see example 2 if you want to know why} and peas cook more quickly at a higher temperature. A look at a pressure cooker recipe book will show you that the rate of cooking peas increases a great deal, taking perhaps a minute or two under pressure instead of the usual time of up to ten minutes. The rise in temperature that achieves this is not very big: at double atmospheric pressure (which is usual in pressure cookers), water boils at about 394 K instead of 373 K.
Another example of a change in the rate of reaction with temperature is the reaction between glucose and oxygen, catalysed by methylene blue. A sealed flask half full of colourless liquid is shaken, and then the liquid turns blue. The blue colour lasts for perhaps half a minute, and then the liquid becomes colourless again. The experiment can be repeated many times, with the same result.
If the flask is warmed by a few degrees, by being held in hot water, and is then shaken again, the blue colour lasts for a shorter time. The de-blueing reaction has happened more quickly.
Oxygen from the air in the flask rapidly converts colourless methylene blue into a blue oxidized form, when the flask is shaken. Then the blue methylene blue oxidizes glucose in a slow reaction, itself going back to the colourless form. The blue colour lasts until all the oxygen in transit is used up.
At first sight, one would expect a reaction not to be much affected by a modest rise in temperature. The number of molecular collisions per second will not increase as much as all that, as the temperature rises. If molecular energies vary in proportion to T, molecular velocities and so numbers of collisions per second might vary in proportion to √T, and therefore, doubling the absolute temperature would not even double the rate of reaction. In fact, the reaction rate will often double for a rise of only a few degrees in temperature.
The key lies in the Boltzmann factor e-E/kT Suppose that the reaction only occurs when a pair of molecules collide with unusually large energy. The Boltzmann factor gives the relative numbers of particles in energy levels different by energy E. If the number of molecules with unusually large energy is very small, the number in low levels will be nearly constant, even if the number of energetic molecules rises. In these circumstances, the proportion of molecules with large extra energy E is given adequately by the Boltzmann factor, so that we may expect the rate of reaction to vary as
rate of reaction ∝ e-E/kT
because the rate of the reaction is likely to be proportional to the number of molecules suitably equipped to react. The energy E is called the activation energy of the reaction. A large activation energy means a slow reaction, because few molecules are, at any moment, able to react.
The blueing-deblueing reaction can be studied quantitatively, but the time the blue colour lasts depends on how much oxygen is taken from the air in the shaking stage, and giving a flask a standard shake is not easy. Other reactions are available, and details follow.
One possible experiment involves the reaction of bisulphite ions and formaldehyde. The system is arranged so that the two substances, both colourless solutions, are mixed. The mixture remains colourless until all the bisulphite ions are used up, when a separate alarm clock reaction suddenly turns the mixture pink. The pair of solutions can be warmed before mixing them, so that the time t from mixing to the appearance of the pink signal can be recorded at various temperatures.
The rate of reaction is proportional to 1/t, so that we expect
ln(1/t) = -E/kT + constant.
A graph of ln(1/t) against 1/T, as in figure 81, should be a negative sloping straight line, and its slope yields an estimate of the activation energy per molecule.
Figure 81: Plot of ln (rate of reaction) against 1/absolute temperature.
Demonstration or experiment: 9.12 Rate of reaction
9.12a Blue bottle
  1056    sodium hydroxide, 10 g
  1056    dextrose (glucose), 10 g
  1056    methylene blue 1 drop of 1% in ethanol
  1056    ethanol (ethyl alcohol)
  1055    flat-bottomed flask. 1 dm3 (1 litre)
   533    plastic bucket or basin
          supply of hot water
9.12b Formaldehyde clock
  1056   sodium metabisulphite, 5 g
  1056   sodium sulphite (anhydrous), 1 g
  1056   formaldehyde, 10 cm3
  1056   phenolphthalein, 20 cm3
  1055   measuring cylinder, 100 cm3   2
 512/1   beaker, 250 cm3   2 or more
   517   volumetric flask 1 dm3 (1 litre)   2
   542   thermometer ( -10 to 110°C)
   507   stop watch or stop clock
   533   plastic bucket or basin
         supply of hot water
9.12c Iodine clock
As for b, replacing the chemicals by:
  1056   0.1 M potassium iodine solution
  1056   0.5 M sulphuric acid
  1056   0.1 M hydrogen peroxide solution
  1056   0.1 M sodium thiosulphate solution
  1056  0.2 % starch solution
9.12a Blue bottle
Half fill a 1 dm3 flat-bottomed flask with tap water, and dissolve 10 g of solid sodium hydroxide in it, adding and dissolving 10 g of dextrose afterwards. Add one drop of a one per cent solution of methylene blue in ethanol, and allow to stand until colourless. Seal the flask with a rubber bung.
Give the flask one or two vigorous shakes and the contents will turn blue. They will become colourless again after about half a minute or so, depending on how hard and for how long the flask was shaken.
Warm the contents of the flask by dipping it in hot water in a basin for a few minutes. A temperature rise of 5 to 10 K is plenty. When the flask is now given a standard shake, the blue colour lasts for a considerably shorter time.
The experiment is described at length in Campbell, Why do chemical reactions occur?.
9.12b Formaldehyde clock
Two solutions. A and B, are made up just before they are required (the shelf-life does not seem to exceed one day). Solution A is 5 g of sodium metabisulphite, and 1 g of anhydrous sodium sulphite, dissolved in water and made up to 1 dm3 in a volumetric flask. Solution B is 10 cm3 of formaldehyde and 20 cm3 of phenolphthalein, made up to 1 dm3 with water in a volumetric flask.
100 cm3 of each solution is measured out into pairs of beakers, and the contents of one of a pair of beakers are poured into the other at the moment when a stop clock is started. Before mixing some of the pairs, the beakers are stood in hot water for a short while, until their temperatures cover values over the range 20°C to 50°C. The temperature of the mixture is taken and recorded, together with the time taken for the mixture suddenly to develop a pink colour.
The main reaction is between bisulphite ions and formaldehyde:
HCHO(aq) + HSO3 -(aq) = CH2OHSO3 -(aq).
The alarm clock reactions used are twofold. Sulphite ions react with formaldehyde and water in the very slow reaction:
H2O(aq) + HCHO(aq) + SO3 --(aq) = CH2OHSO3 - (aq) + OH-(aq).
The OH- ions would turn the phenolphthalein pink, were they not mopped up by bisulphite ions in the fast reaction:
OH-(aq) + HSO3 -(aq) = SO3 - -(aq) + H2O(aq).
The amount of sulphite ions present is small, and the reaction is slow, so the quantity of bisulphite ions used up in these reactions is relatively unimportant. But when the main reaction has exhausted the bisulphite ions, the OH- ions are no longer removed, and the phenolphthalein indicator turns pink, signalling the end of the bisulphite-formaldehyde reaction indirectly.
The quantities need to be measured out with some care. Reducing the proportion of solution A in the mixture increases the time by about 1 s per 1 cm3 less than 100 cm3 mixed with 100 cm3 of B, at 20°C. The pink colour takes an appreciable time to develop, perhaps 2 s in a reaction time of 60 s. The reaction time varies from about 100 s at 15°C to 5 s at about 50°C, the rate doubling about every 10°C.
See Science masters' book (1964) Series IV, Part 2, Chemistry, page 230, John Murray.
9.12c Iodine clock
This is an alternative to the formaldehyde clock, the experiment being done in the same way. The reaction is between hydrogen peroxide and iodide ions, the end of the reaction being signalled by starch; this detects the presence of iodine which has used up all of a small amount of sodium thiosulphate added to the solution. Full details are given in Nuffield Advanced Chemistry Teachers' guide II, experiment 14.2. The details concern an investigation of the effect of concentration, but the experiment is suitable for an investigation of the effect of temperature in the range 15°C to 40°C, at one concentration.
Non-equilibrium arguments
It is surprising that it is possible to say anything about reaction rates, when the Boltzmann factor applies only to equilibrium situations. In effect, the excited, activated state is treated as if it were in equilibrium, which it is not. Therefore, the predictions made often fail to come true.
Example 4: Conduction in a semiconductor
When hot water is poured onto a thermistor which is connected to a battery and an ammeter, the current rises dramatically. Making the thermistor a little warmer makes it conduct a great deal better.
The key to understanding why this happens is the Boltzmann factor, e-E/kT. Very nearly all the atoms in a pure semiconductor have their electrons tightly bound to them, and the material would be like any other insulator except that the energy needed to excite an atom so that an electron is freed is not so great. Rarely, an occasional atom can acquire enough energy at the expense of the rest to become ionized, so the material conducts electricity a little.
The Boltzmann factor gives the ratio of the number of particles in energy levels different by energy E. As long as the number of atoms with energy large enough to become ionized is small, so that changes in this number make little difference to the numbers in lower energy states, the Boltzmann factor is quite a good guide to the proportion of atoms which will acquire, by chance, a large extra energy E.
If this explanation is along the right lines, because the current conducted will tend to be proportional to the number of free carriers, one might expect the current I to vary as
I ∝ e-E/kT
or
ln I = -E/kT + constant.
Note to teachers
A glance at any book about semiconduction will reveal that the above story is much oversimplified, though the basic feature, that the conduction depends on thermal activation of a few electrons, is correct. This is the feature we wish to emphasize.
Among the simplifications are the following. The energy levels belong to the crystal structure as a whole, falling into bands. In a pure semiconductor, the band of levels for electrons associated with conduction is of the order of one electron volt above the top of the band of valence electron levels. If the gap between the bands is E, a fraction eE/kT of electrons in valence levels will be promoted to the conduction band resulting in one conduction electron and a postive hole in the valence band. In effect, the energy per carrier is E/2, and this is the quantity for which the experiment will yield an estimate.
A doped semiconductor, as in transistor materials, is another matter. This contains impurity atoms which are much more easily ionized, and at low temperatures most of the conduction is due to carriers from impurity atoms. As the temperature rises, the conduction by carriers from impurity atoms, nearly all of which are already ionized, diminishes rather than increases, because the carriers become less mobile. At higher temperatures, the conduction due to electrons from the semiconductor atoms can overtake impurity conduction, as the number of electrons crossing the valence band-conduction band gap increases.
In the argument that the current would be proportional to the number of carriers, the effect of a rising temperature in reducing the mobility of the carriers was ignored.
The current passed by a thermistor at various temperatures can be measured, and a plot of ln I against 1/T might, on the argument given, be expected to be a straight line. The energy E needed for an atom to give rise to conducting carriers can be estimated from the slope of the graph, as in figure 82.
Figure 82: Variation in current passed by a thermistor, with temperature.
Experiment: 9.13 Change of current with temperature
   132N   thermistor (RS Components Ltd TH3)
   1033   cell holder with one U2 cell
 1003/2   milliammeter (10 mA)
 1003/3   milliammeter (100 mA)
    52K   crocodile clip 2
    542   thermometer ( - 10 to 110°C)
  512/1   beaker. 250 cm3
    511   tripod
    510   gauze
    508   Bunsen burner
  503-6   retort stand base, rod, boss, and clamp
   1000   leads
Alternative: add

   1051   germanium transistor (e.g. QC 71)
   1053   piece of cork, about 30 mm diameter × 10 mm thick
   1053   Vaseline
The thermistor is supported in cold water from the retort stand by means of two leads and crocodile clips, so that it is just immersed, and it is connected in series with the 10 mA meter to the 1.5 V cell. Temperature and the corresponding thermistor current I are measured.
The water is now heated gently. Before another pair of corresponding readings is taken, the source of heat should be removed and the water stirred until the temperature indication is steady. Judicious use of the Bunsen burner with a low flame will enable the temperature to be kept steady long enough for the thermistor to reach equilibrium. The cell may be disconnected whilst the water is being heated. and reconnected just before a reading is taken. A temperature rise of about 10°C between readings is suitable.
A graph of ln I against 1/T is very nearly linear. In a typical experiment, the gradient E/k was found to be 4.1 × 10³ K giving E = 5.6 × 10⁻²⁰ J (0.35 electronvolt).
Alternative experiment with a transistor
The leakage current in a germanium transistor, between collector and emitter, can be used as a substitute for the current in a thermistor.
Figure 83 shows a way of mounting the transistor in a piece of cork, so that the transistor is immersed but its leads are clear of the water.
Figure 83: Measurement of leakage current in a transistor.
A hole should be made in the cork so that the transistor is a tight fit in it. Light leads should be soldered to the collector and emitter leads of the transistor which is then pressed into the hole in the cork. The cork is carefully floated on water in the beaker and the leads are suspended from the retort stand and clamp to prevent their weight from tilting the cork. It is important not to get the leads from the transistor wet, and Vaseline can be put over them to prevent this.
It is essential to connect the collector and emitter with the correct polarity - the collector of a pnp transistor such as the OC 71 being connected to the negative side of the 3 V supply.
The temperature may be raised to about 45°C. When readings are taken, the temperature needs to be raised slowly and held steady until the transistor reaches equilibrium. This can be achieved by careful use of the Bunsen burner with a low flame. Readings should be taken at intervals of about 5°C. A 100 µA meter will be needed for temperatures below about 25°C.
Example 5: Entropy: The entropy of a substance
The entropy of a substance, like its energy, is a quantity that can be measured and tabulated. The zero of entropy is to some extent arbitrary, as is the zero of energy. The entropies given below follow the convention that at absolute zero the entropy (of a pure crystalline substance) is zero. This is reasonable, if
S= k ln W
for if S = 0, ln W = 0 and W = 1. One might well think that at absolute zero, every atom would be in the lowest possible energy state. There would then be only one way for the system to be arranged; only one possible state it could adopt.
Measuring entropy changes
The entropy of one mole of water molecules increases with temperature (table 7).
   T/K   S/J K-1 mol-1 (liquid, one atmosphere)
   298   70.0
   302   71.0
Table 7: Entropy of water at two temperatures.
Adding energy means that W (for the water) increases; more energy can be shared out in more ways. The increase in entropy ΔS = k Δ ln W can be measured, as was indicated in Part Five, by measuring the rise in energy of the material at a measured temperature. At constant volume, for example,
ΔS= ΔU/T.
(If the entropy change over a wide range of temperature is needed, the total change is the sum - or integral - of many such terms, T entering each term with the value it had at each stage.)
For example, 1 kg of water needs about 4180 J to raise its temperature by 1 K. To warm one mole of water (18 g) by the 4 K interval from 298 K to 302 K, just about 300 J are therefore necessary.
The entropy change, since the average temperature is 300 K, is given by
ΔS ≈ 300/300 = 1 J K-1 mol-1
and this is just the difference between the two tabulated entropies.
Entropy change and change of state
The entropy of water increases as it changes from ice, to liquid water, to water vapour (table 8).
   State      S/J K-1 mol-1 (one atmosphere, 273 K)
   solid (ice) 41
   liquid      63
   vapour     185*
(The value for the vapour is extrapolated from measurements under other conditions.)
Table 8: Entropies of ice, water, and water vapour.
Energy needs to be supplied to change ice into water, or water into water vapour, and the entropy goes up as it does when water is warmed. The larger change of entropy goes with the change involving the bigger increase in volume. Work in Part Three, on the increase in ways when the space available to particles increases, may make this seem reasonable.
Entropy change on expansion
When one mole of neon gas expands, its entropy rises (table 9).
   Pressure      S/J K-1 mol-1 (gas, both at 298 K)
   in atmospheres
   1                146
   ½                152
Table 9: Molar entropy of neon.
Between these two states, the volume doubles, so the number of ways increases by the factor 2N (see Part Three). The entropy change is thus
ΔS = k Δ ln W = k ln 2N = Nk ln 2.
Putting in the values k = 1.38 × 10⁻²³ J K-1, N = 6.02 × 10²³ mol-1, ln 2 = 0.693,
ΔS ≈ 6 J K-1 mol-1.
This is the difference between the two tabulated values.
Twice as much stuff: twice as much entropy
The entropy of one mole of lead, in solid form at 298 K, one atmosphere, is 65 J K-1. The entropy of two moles of lead in the same state is 130 J K-1. Entropy, like energy, but unlike temperature, doubles with a doubling of the amount of substance. Here are two reasons why this is so.
- Twice as much lead needs twice as much energy to warm it up from absolute zero, so the terms ΔU/T (constant volume) in the entropy sum are each twice as big.
- If there are W different ways accessible to the atoms in one mole of lead, there are W ways for another mole of lead. Each way for one lump of lead can go with every single one for the other lump: ways multiply. So the number of ways for two moles of lead is W2. If, for one mole
S= k ln W
then, for two moles,
S = k ln W2 = 2 k ln W
which is just twice the entropy for one mole.
Big entropies and small entropies
What kind of material would be likely to have a small entropy? For solid elements like those discussed in Parts Four and Five, it would help if the quanta of energy associated with oscillating atoms were large, so that there would be few of them to share out. The quantum energy ε is given by
ε = hf
where h is the Planck constant, and f is the oscillation frequency. So high oscillation frequency might go with low entropy. The oscillation frequency will be high if the atoms have a relatively small mass and are tightly bound to one another. It will be low if the atoms are massive and are loosely bound. A hard material, made of atoms of low atomic mass, like diamond, should have a lower entropy than a soft material made of massive atoms, like lead. The actual values are given in table 10.
   Element      Sθ/J K-1 mol-1 (298 K, one atmosphere)
   diamond         2.5
   lead           65
Table 10: Molar entropies of a hard and of a soft material. (The symbol θ indicates that the value refers to a standard state.)
The entropy values of substances, and changes of entropy, fit fairly well with the ideas we have developed about how entropy is to be understood.
Example 6: Using entropy values
Entropy doesn't decrease
The basic idea we have used many times is that a system will try out all the ways of internal arrangement open to it, favouring none over another, and so in time working at random through them all. If the circumstances change, as for example when a gas is allowed to expand into a larger volume, so that the number of ways open to the system is larger, the system will be found trying out all the new ways as well as all the old ones. This was why, in Part Four, heat went from hot to cold when the hot and cold objects were put in contact.
Every system spreads out over all the states available, as much as it can. In any change which occurs naturally, W will increase, but W will not, of itself ever decrease. Since the entropy S is given by
S = k ln W
the entropy will increase when W increases. The rule that the entropy will never diminish is the key to explaining the direction of physical and chemical changes.
Why does water freeze ?
The entropies of one mole of water and of ice, at 273 K, one atmosphere, are shown in table 11.
   State      Sθ/J K-1 mol-1
   liquid water    63
   solid ice       41
Table 11: Change of entropy when water freezes.
The freezing of one mole of water involves an entropy drop of 22 J K-1 mol-1. How then does water ever come to freeze, if entropy does not decrease? We have ignored the energy, liberated as the strong bonds in ice are formed, which is now spread out over the matter nearby. This energy comes to just about 6000 J mol-1. It increases the entropy of the surroundings by 6000/T, where T is the temperature of the surroundings.
Suppose the surroundings are at the Siberian winter temperature of 250 K. The Siberian surroundings rise in entropy by
ΔS = 6000/250 = 24 J K-1
which is 2 J K-1 more than the fall in entropy of the freezing water. So the water freezes.
At the more sultry temperature of 300 K, the surroundings would rise in entropy by
ΔS = 6000/300 = 20 J K-1
which is not enough to offset the 22 J K-1 drop in entropy in the water. So the water does not freeze. It can just freeze at a temperature T at which the entropy rise of the surroundings just compensates for the entropy drop of the water, that is, when
6000/T = 22 J K-1 mol-1
and T = 273 K
which is the usual freezing point of water. (Fortunately for this argument, the entropy change of the water on freezing does not depend very much on temperature, so the value at 273 K can be used without appreciable error.)
The example is a trivial one, but it illustrates the way in which one always argues, using entropy, to find out whether a process can happen, or under what conditions it may happen.
Why doesn't hydrogen dissociate?
If one mole of H2 molecules dissociates into two moles of H atoms, the entropy rises from 130 J K-1 to 230 J K-1, an increase of 100 J K-1. Why, if entropy tends to increase, does hydrogen gas remain in the form of hydrogen molecules?
When the H-H bonds are broken, the energy to break them has to come from somewhere. This energy amounts to 430 kJ, for one mole of H2, and if it comes from the surroundings, cooling them somewhat, the entropy of the surroundings will decrease. If they are at 300 K, the drop in entropy will be
ΔS = 430 × 103/300 = 1400 J K-1
which is a great deal more than the entropy advantage of 100 J K-1 to be gained by the dissociation of the hydrogen. So hydrogen molecules do not dissociate appreciably at 300 K.
At higher temperatures, however, the entropy penalty for the surroundings, incurred when they deliver 430 kJ, is smaller. At about 4300 K, the entropy penalty is down to 100 J K-1, equal to the entropy advantage. So above this temperature, hydrogen does spontaneously dissociate.
One of the characteristic sights and sounds of a chemistry laboratory is that of Bunsen burners going, being used to heat things. Why do chemists heat things? One reason is implied in the argument we have just given: the entropy penalty for chemicals in a test-tube to take energy from a hot flame (or from hot solvent) is smaller than the penalty for taking the same energy from cold surroundings. So heating the chemicals may make a reaction possible. There are other reasons for heating chemicals: one of them is that it speeds up many reactions. Example 3 discusses this other reason for heating things.
Mixtures in equilibrium
Very pure water conducts electricity just a little, so a few H2O molecules must be dissociated into OH- and H3O+ ions. This happens even though the conversion of one mole of H2O into the ions involves a fall in entropy of the water and the surroundings, amounting to -268 J K-1 mol-1.
Water dissociates, to a small extent, because (as we saw in Part Three) there are many ways of mixing unlike particles with one another. There is no question of making any difference by interchanging a number of identical water molecules, so the production of a few particles of a different kind makes a big difference to the number of ways of making interchanges between particles. These extra ways can compensate for the drop in other numbers of ways involved in the entropy decrease mentioned above.
The argument can be made quantitative, and runs parallel to arguments used in Part Three, about diffusing and mixing. Figure 84 shows a mixture of two sorts of particles, with as many white particles as 'black ones.
Figure 84: Mixing two sorts of particles.
The mixture can be arranged in many ways. Exchanges of unlike particles, such as interchange 1, make a difference. Exchanges of like particles, however, such as interchange 2, make no difference.
Now suppose one more black particle is added, there being N particles in all, and that there were previously W ways of interchanging particles which made a difference. The extra particle can be interchanged with all N other particles, multiplying W by N, but N/2 of these interchanges are with particles just like the added one, so these ways must be discounted, and N × W must be divided by N/2. The net effect is to double the number of ways, dividing W by the fraction, 1/2, of particles like the extra particle.
Note to teachers
If there are N particles, n1 of one sort and n2 of another, the number of interchanges is W = N!/n1! n2!. Adding one particle of the first sort increases N to N + 1, and n1 to n1 + 1, multiplying W by (N + 1)/(n1 + 1). When the numbers are large, this multiplying factor is nearly N/n1, or 1/f, where f is the mole fraction of particles of type 1.
In general, if the added particle is like others which are present as a fraction f, less than one, W is multiplied by 1/f when the extra particle is added.
Thus Wafter/Wbefore = Δ ln W = ln 1/f
for one molecule added. For one mole of molecules added, to very many moles already present, the increase is just L times as much, where L is the number of particles in a mole, the Avogadro constant. Multiplying Δ ln W also by k, we obtain, per mole of added constituent,
ΔS = kL ln 1/f.
In the case of the water dissociating, there are two added new kinds of particles, the OH- and H3O+ ions, both present in the same fraction f, both contributing to the entropy in equal amounts, giving
ΔS = 2 kL ln 1/f.
If this increase in entropy is as large as the decrease, - 268 J K-1 mol-1, incurred by the dissociation of one mole of water, the dissociation can occur. Putting them equal to one another, we can find f:
2 kL ln 1/f = 268
ln 1/f = 16
1/f = e16 = 107
f = 10-7
f is better known in this context as the hydrogen ion concentration in pure water, and its negative power of ten as the pH, equal to 7, of pure water.
Notice that in a dilute mixture, where f is a small fraction and 1/f is large, the entropy gain from adding another few particles is very large. It is for this reason that chemical reactions rarely go to completion. However large the entropy penalty for running the reaction backwards, the formation of just a few molecules of a kind different from the majority gives such a large increase in mixture entropy, that a few such particles are always formed.
Note to teachers: equilibrium constant expressions
The general equation for chemical equilibrium can now be written down. It is
ΔSconcentrations + ΔSchemicals + ΔSsurroundings = 0
In the simple reaction of the type A = B, the conversion of one mole of A to B alters the first entropy term by
ΔS = kL{ln 1/[B]-ln 1/[A]} = -kL ln [B]/[A]
where [A] and [B] are the mole fractions, or molar concentrations, of A and B. The quantity [B]/[A] is the equilibrium constant K. For more complex reactions a similar argument again leads to
ΔS = -kL ln K.
Putting these things together, using the subscript σ to denote the chemical system, and writing R = kL, we have
-R ln K + ΔSσ-ΔHσ/T = 0
or ln K = ΔSσ/R-ΔHσ/RT
and ln K = -ΔGσ/RT
writing ΔG = ΔH -TΔS.
Thus we arrive at the usual chemical expression for the equilibrium constant in terms of the Gibbs free energy ΔG.
Example 7: Inefficient engines
The car engine discussed in Part Two was pretty inefficient; about 70 per cent of the fuel energy merely went directly to warm the atmosphere. If such waste could be eliminated, a car could go three times further on a tankful of petrol than it can now.
Power stations are more efficient than cars, but even the best of them pass 60 per cent of the energy obtained from the fuel they use, out through cooling towers, or into rivers. This energy can be used for warming nearby blocks of flats, as is done at Battersea in London, but it is usually wasted and it never goes into the electrical energy supplied by the station.
The efficiencies of power stations vary a good deal. Figure 85 shows the efficiencies of power stations in the south east of England, plotted against the temperature of the steam delivered to their turbines.
Figure 85: Power stations in CEGB South Eastern Region. Efficiency plotted against steam temperature. Data from CEGB (1968) Statistical yearbook.
Figure 85 suggests that the efficiency of a power station is related to the steam temperature, because the points lie clustered along an upward-sloping line, from low temperature, low efficiency stations like Islington, to high temperature, high efficiency stations like West Thurrock. It is also clear that factors other than temperature are important. An old power station like Hackney A has a much lower efficiency than a new one like Dungeness, although the temperatures involved are very similar. Clearly, good design, unrelated to steam temperature, counts for a good deal. Nevertheless, the temperature is of the greatest importance, and we shall see why in a moment.
The earliest steam engines, such as the one shown in figure 86, were notably inefficient. One of the main uses of these early engines was in pumping water from mines, though they soon found many other industrial uses, and powered the cotton mills which gave an early impetus to the Industrial Revolution. At first, people had no idea of whether such engines were close to, or far from, the best efficiency that could be hoped for. A young French engineer, Sadi Carnot, was the first to realize that all such engines must be inefficient to some extent. Out of Carnot's ideas there grew the concept of entropy, and the principle that, in any natural process, the entropy will not diminish. Nowadays we can approach the matter the other way round, seeing how an understanding of entropy leads to the fact that an engine extracting energy from a hot body like the boiler of a steam engine, must necessarily be inefficient to some extent.
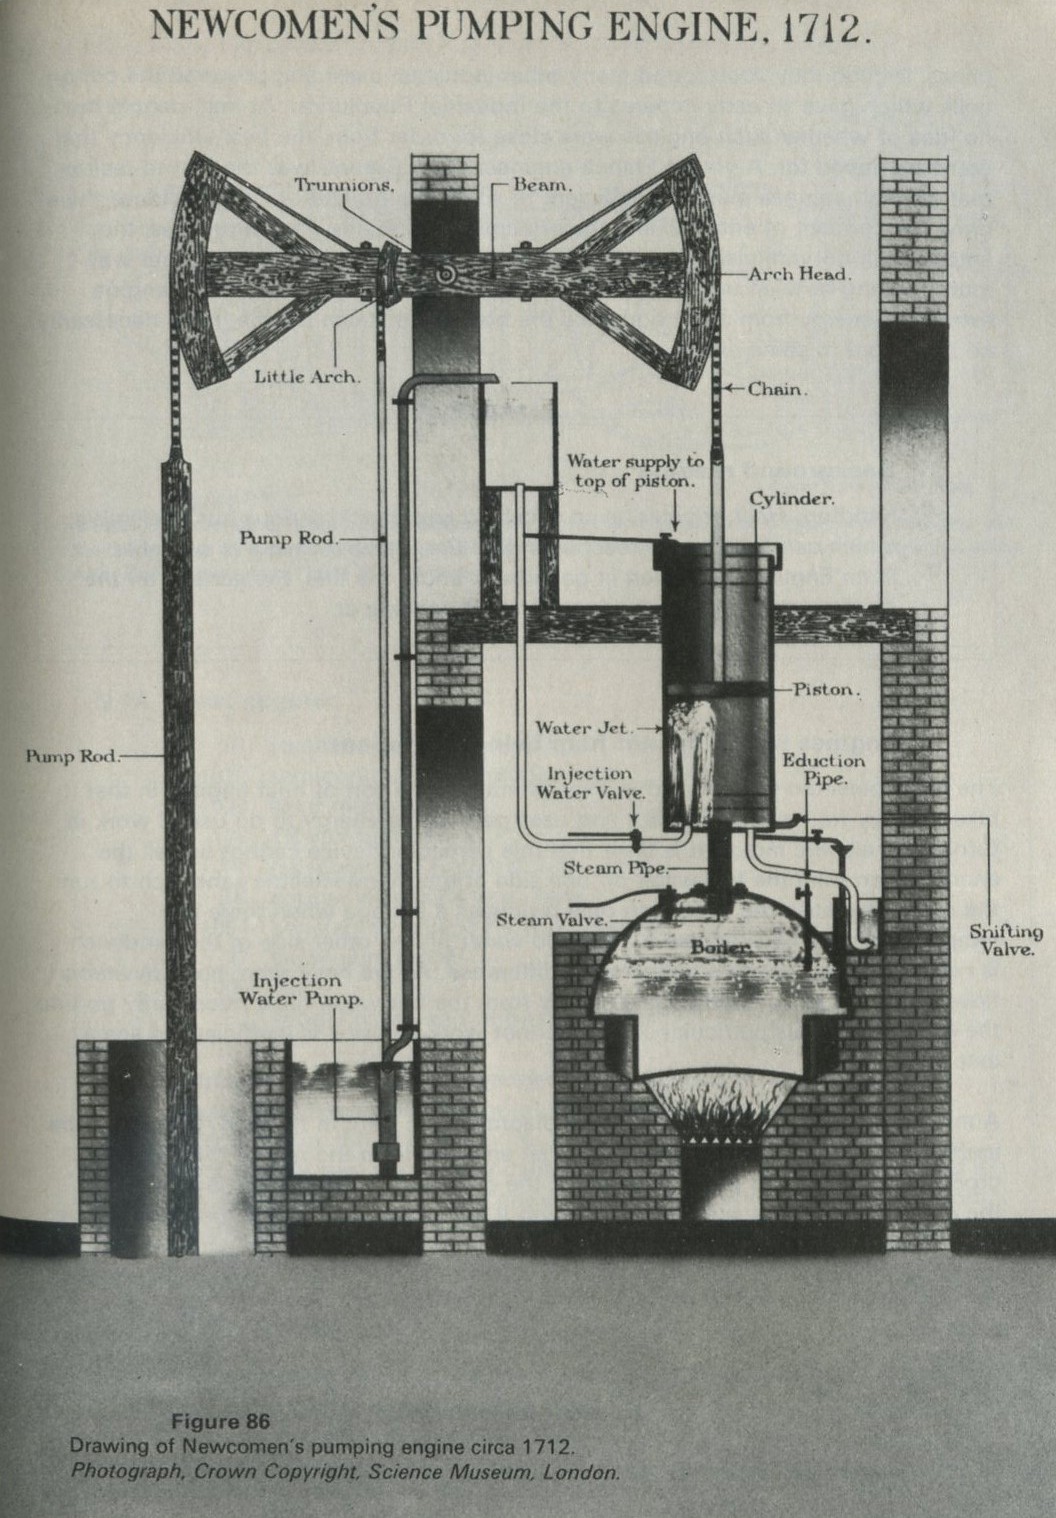
Figure 86: Drawing of Newcomen's pumping engine circa 1712. Photograph Crown Copyright Science Museum London.
Background reading
Sandfort, Heat engines, is an excellent paperback, serious but intelligible, which can be strongly recommended. Carnot's own work is available in an English translation in paperback under the title, Reflections on the motive power of fire, and is well worth looking at.
Engines which cannot help being inefficient
The thermoelectric device used in experiment 9.6 is a sort of heat engine, in that it takes energy from something hot and uses part of this energy to do useful work in turning an electric motor. It is clear that this particular device cannot use all the energy taken from the hot water on one side of the thermoelectric sandwich to run the motor, because the sandwich only produces a voltage when there is a temperature difference across it. The cold water on the other side of the sandwich is needed to maintain this temperature difference. As we have seen, heat inevitably flows from hot to cold, and some energy from the hot water must necessarily go into the cold water. This particular engine cannot work unless it is inefficient to some extent.
A modern aircraft jet engine, shown in diagrammatic form in figure 87, must also be inefficient if it is to work at all. The gas jet emerges from the rear of the engine, producing a thrust. To produce a thrust, the gas must emerge faster than it enters the engine, and this is achieved by making it hot. Just because the gas is hot, there must be an energy transfer as the gas in the jet stream cools to the temperature of the surroundings, and this energy transfer does not contribute to the kinetic energy of the aircraft.
Figure 87: A turbojet aero engine. Recent engines have more than one stage of compression, and also use the compressor to contribute cool, high velocity air to the jet; this air bypasses the combustion stage.
9.14 Heat Engines
    91   steam engine unit
  1072   semiconductor thermopile unit 1023 solar motor
   176   12 volt battery
  1001   galvanometer (internal light beam)
    28   copper wire, 32 s.w.g., bare
  1054   constantan wire, 32 s.w.g., covered
    77   aluminium block
  1000   leads
         supply of ice and of boiling water
It may be worth showing the thermoelectric engine, already used in experiment 9.6, again. The point to establish is that the device needs a temperature difference in order to work, so that some of the energy from the hot part necessarily cannot appear at the motor, but must go to the cold sink. It is helpful to show that the engine will take energy from cold water if the heat sink is even colder, by putting dry ice and alcohol in the latter; also to show that the engine can be put in reverse, being supplied with energy electrically, and raising energy from the cold side to the hot side.
The model steam engine used in the Nuffield O-level Physics course may be worth seeing again, the main point being to illustrate by more than one example the general notion of a heat engine: a device with a hot source and cold sink, using the flow of energy under this temperature difference to employ part of this energy to turn wheels and raise weights. Other resources are worth considering. One or two firms now market hot air engines working on the Stirling cycle, which are of interest. The construction of such an engine is within the capacity of most school metalwork departments. Feynman (The Feynman lectures on physics, Volume 1, chapter 44) has an amusing rubber heat engine that could fairly easily be put together.
Entropy and engines
Figure 88 shows a rather schematic picture of a power station. We shall look upon it as a large-scale device with a hot part, from which energy is taken, a cool part, at which energy is given up to the surroundings, and an intermediate part - the turbines and dynamos - in which part of the energy flowing through the system is diverted and sent off along cables to do work for consumers.
Figure 88: Energy flow in a power station.
Suppose the station puts out 100 MW of power, and has an efficiency of 33 per cent. 300 MW must be being conveyed from the furnaces to the turbines, 200 MW of which finds its way into the atmosphere via the cooling towers. If the temperature of the hot part is Thot the removal of 300 MJ of energy in one second involves an entropy drop of
ΔShot = -300 × 106/Thot.
But entropy cannot diminish, in any actual process. The compensating entropy increase is to be found at the cooling towers, where the delivery of 200 MJ in one second to the surroundings at the temperature Tcool involves an entropy rise of
ΔScool = + 200 X 106/Tcool
The overall entropy change is given by
ΔSoverall = - 300 × 106/Thot + 200 × 106/Tcool.
If Thot is sufficiently greater than Tcool, the second, positive term can outweigh the first, negative term, even though the first term involves a greater energy transfer than the second.
The power station can operate without a net decrease in entropy provided that
Thot/Tcool > energy taken from hot part/energy given to cool part.
If the two temperatures are 1000 K and 300 K, for every 300 MJ taken from the furnace and boilers, 90 MJ must be passed out at the cooling towers. Only 210 MJ can in principle be transformed in other ways, as is desired. The efficiency (in this instance) cannot exceed 70 per cent, whatever the skill and cunning of the designers of furnaces, turbines, and so on.
The efficiency of modern power stations approaches one half of their maximum possible efficiency, whereas when Carnot made his first calculations, the best attained by steam engines was put by him at about 1/20 of the possible efficiency. There is still plenty of scope, within the restriction imposed by the need for entropy to increase, for skilful design.
It should also be clear that, to obtain high efficiency, the general rule is the hotter the better. That is why in engines of most sorts, and especially in steam engines and turbines, the operating temperatures have been climbing over the years. The earliest steam engines operated with steam at atmospheric pressure, and so at 373 K. If the exhaust were at 300 K, a fraction 300/373, or 80 per cent of the energy taken from the boiler would have had to be wasted, with a maximum attainable efficiency of 20 per cent. In a modern power station, as may be seen from figure 85, the steam enters the turbines at over 800 K. In a modern jet engine, the working temperature is higher still, with the turbine having to run with its blades glowing hot. The use of these high temperatures produces many problems, notably of corrosion and of reduced strength of moving parts, but high temperatures are so desirable on grounds of efficiency that it is well worth while devising new methods and materials so as to permit their use.
Example 8: Cells as energy converting devices
Energy from electron transfer reactions
When zinc dust is put into copper sulphate solution, the mixture becomes warm. Zinc atoms become charged zinc ions Zn2+(aq) in solution, and charged copper ions Cu2+(aq) come out of solution, becoming uncharged copper atoms. The net effect is the transfer of electrons from zinc atoms to copper ions, as the equations which follow indicate:
Zn(s) → Zn2+(aq) + 2e-
2e- + Cu2+(aq) → Cu(s)
The reaction delivers energy (some 217 kJ, when one mole of zinc atoms becomes zinc ions in this reaction). It would be a good thing if the electrons could be made to go from the zinc to the copper along a wire through a motor, rather than for the reaction to take place all in one test-tube, because then the motor might be able to lift a load, which would be a more useful outcome than the mere warming of the contents of the test-tube.
The trick can be achieved by dipping zinc into zinc sulphate, copper into copper sulphate, joining the metals with a wire, and keeping the two solutions apart with a porous barrier. This particular cell is called the Daniell cell, but many others are known. Dry cells, lead-acid accumulators, and the mercury cells used in transistorized deaf aids all use the same basic idea: an electron transfer reaction is made to happen by taking the electrons from one place to another through a wire, and on the journey, energy is transformed.
Entropy effects on a cell voltage
A cell, not unlike the Daniell cell, but in which electrons are transferred from copper atoms to silver ions, is more suitable than the Daniell cell for making observations of the effect of entropy changes on the maximum voltage delivered by the cell, because the entropy change of its constituents is larger than that in the Daniell cell.
The cell is shown in figure 89. A copper wire dips into copper sulphate solution. On the other side of a porous barrier, a silver wire dips into silver nitrate solution, and the two wires form the cell's electrodes. When one mole of copper atoms become copper ions, in the reaction
Cu(s) → Cu2+(aq) + 2e-
two moles of electrons can flow through the wire from copper to silver. Two moles of silver ions can then become silver atoms, being deposited on the silver wire.
2Ag+(aq) + 2e- → 2Ag(s)
Figure 89: The copper-silver cell.
The maximum cell voltage is rather less than half a volt. When one mole of copper atoms and two moles of silver ions take part in the electron transfer reaction, the energy liberated is 146.8 kJ. The entropy of the constituents decreases by 193 J K-1 when one mole of copper atoms becomes copper ions in this reaction. Entropy cannot decrease, so to compensate, entropy must increase by at least 193 J K-1 elsewhere. This can be achieved by using part of the energy of the reaction to warm the surroundings. At 298 K, the amount needed is TΔS = 193 × 298 = 57.6 kJ out of the 146.8 kJ available. Thus 146.8- 57.6 = 89.2 kJ are available to be delivered as work by the flow of electrons. Two moles of electrons carry charge 2 × 96 500 C. The maximum cell voltage is thus given by the energy available divided by the charge flowing.
V = 89.2 × 10³/96 500 × 2 = 0.46 V.
What will happen if the cell is made warmer? The entropy increase ΔS= 193 J K-1 must still take place in the surroundings. If the surroundings become hotter, the energy needed to produce this entropy increase (given by TΔS) is correspondingly bigger. Less of the reaction energy is available to be transformed electrically. The maximum cell voltage must fall.
This prediction can be tested in a simple way by connecting two identical copper-silver cells in opposition through a galvanometer, so that no current flows when they both produce the same voltage. If one cell is warmed by holding a beaker of hot water around it, a current begins to flow, in a direction which indicates that the warmer cell has now the lower voltage.
Notes to teachers
Practical details for all the experiments in this example are given together at the end of the example.
The following section, on concentration effects, might interest those who have looked at the part of example 6 which deals with chemical equilibrium, where entropy effects of concentration are discussed in outline.
The full data for the copper-silver cell are given below, for those who wish to have them.
The reaction is
2Ag+(aq) + Cu(s) = 2Ag(s) + Cu2+(aq)
At 298 K, for two moles of silver ions and one mole of copper atoms reacting, the thermochemical data are as in table 12.
                 ΔHθ/kJ  ΔSθ/J K-1  TΔSθ/kJ  ΔGθ=ΔHθ-TΔSθ/kJ  Eθ/V (=ΔGθ/2F)
A              -211.2   -191       -57.0      -154.2          +0.80
B               +64.4   -2         -0.6       +65.0           -0.34
net reaction   -146.8   -193       -57.6      -89.2           +0.46

A is 2Ag+ → 2Ag(s)
B is Cu(s) → Cu2+(aq)
Table 12
(Symbols: H, enthalpy U+PV; S, entropy of the chemical part of the system; T, absolute temperature; G, Gibbs free energy H-TS; E, cell e.m.f.; F, Faraday, 96 500 C; θ, standard state.)
Because ΔH is not very temperature-dependent, the value of dE/dT is approximately equal to d(TΔS/2F)/dT, or to ΔS/2F. Using the value above for ΔS gives dE/dT ≈ 1 mV K-1.
The entropy change quoted (193 J K-1) can be obtained from the variation of cell e.m.f., in which case the previous argument is circular. But the entropy change can also be obtained indirectly, by measurements of the heat exchanged when ions go into, or out of, aqueous solution. Note also that the values in table 12 refer to molar solutions, while the experiment suggested uses a lower concentration of silver ions. As shown below, this alters the cell voltage. The effect is not large.
Concentration and cell voltage
It happens that nearly all the entropy drop within the copper-silver cell happens in the reaction at the silver, in which silver ions are removed from solution, to become silver atoms on the solid wire.
Suppose the ions are in a 0.1 M solution, so that a fraction, f = 1/10, of the silver ions and water molecules are in fact silver ions. In example 6, we saw that adding one mole of particles to such a mixture increased the mixing entropy by
ΔS = kL ln 1/f.
In the copper-silver cell, the ions are removed, giving a corresponding drop in entropy
ΔS = -kL ln 1/f.
If 1/f= 10, as in a 0.1 M solution, the entropy change is substantial. If the solution of silver ions is made more dilute, so that 1/f is 100 or 1000, the entropy penalty for removing ions becomes even greater. The net entropy drop for the cell will become even larger than before, and yet more of the available energy will have to go to the surroundings to produce a compensating entropy increase. Less energy will be available to be transformed electrically, and the cell voltage will drop.
This prediction can be tested with the pair of cells connected in opposition which were used previously. If almost all the silver nitrate is poured away, and replaced by distilled water, a dilution of at least 100 times can easily be achieved. The cell voltage at once falls.
Demonstration or experiment: 9.15 Energy from cells
9.15a Energy from an electron transfer reaction
   1056  1 M copper sulphate solution, 5 cm3
   1056  zinc dust, 0.5 g
   1055  test-tube, hard glass, 150 × 25 mm
    542  thermometer (-10 to 110°C)
Add 0.5 g of zinc dust to 5 cm3 of 1 M copper sulphate solution in a test-tube. If students do it, they can feel the warmth produced. As a demonstration, the experiment is more effective with an electrical thermometer giving an indication on a demonstration meter, than with a mercury thermometer. The zinc must be in dust form: the granulated variety reacts too slowly.
9.15b Entropy effects in a copper-silver cell
   1055  specimen tube 2
   1055  teat pipette
   1056  1 M copper sulphate solution
   1056  0.1 M silver nitrate solution
   1056  saturated potassium nitrate solution
   1056  silver wire, 50 mm 2
   1054  copper wire, 14 s.w.g., bare
   1054  glass tube, 10 mm bore, 50 mm long
   1053  Polyfilla (see below)
     52  K crocodile clip 2
  512/1  beaker, 250 cm3
   1001  galvanometer (internal light beam)
   1000  leads
         supply of ice, hot water, distilled water

Extra items needed if only one cell is used

   1006   electrometer
 1003/1   milliammeter (1 mA) or other display meter for electrometer
   1041   potentiometer holder
          with
   1051   preset potentiometer, 5 kΩ
   1033   cell holder with U2 cell
The most effective demonstration uses a pair of identical cells, though it is possible to use only one (see below). The cells are prepared as follows. Well before they are needed, porous plugs are made in the ends of the 10 mm diameter glass tubes, by pressing these ends into a firm paste of Polyfilla and water, until a plug 10 mm long is formed in the tube. When the plugs are set, the tubes are left standing in saturated potassium nitrate solution until they are needed, so that the plugs are soaked in this electrolyte.
The cells are then made up as in figures 89 and 90, by filling the glass tubes with 0.1 M silver nitrate solution using a teat pipette, and resting them in specimen tubes containing 1 M copper sulphate solution, into which dip the ends of a copper wire. Short silver wires are then dipped into the silver nitrate in the glass tubes.
Figure 90: A pair of copper-silver cells in opposition.
When two such cells are made at the same time, using the same materials and solutions, their e.m.f.s are almost exactly equal, and if the cells are connected in opposition through a galvanometer, the galvanometer gives a negligible deflection. It is convenient, and makes a tidy demonstration, if the two cells are held at their necks by Terry clips fixed to a vertical board. The board can then carry the silver wires soldered to 4 mm sockets ready for connection to the galvanometer. One length of copper wire serves to make the electrodes for both cells, and the connection between them, as in figure 90.
Show first, with the galvanometer connected momentarily across only the lefthand cell (say) with its range at the least sensitive possible, the direction of the deflection from this cell. Then connect the cells in opposition, and increase the sensitivity of the galvanometer, showing that a negligible current flows. It should be possible to use the most sensitive range.
To show the effect of temperature, bring up a beaker of hot water around, say, the lefthand cell. After about half a minute, when the cell is warm, the voltage of this cell becomes smaller, and the galvanometer deflects in the appropriate direction. A beaker of ice placed around this cell will increase the voltage again, until the voltage of the cold cell exceeds that of the other, and the galvanometer deflects in the opposite direction.
The effect of concentration can be shown by pouring away the silver nitrate solution in one glass tube, retaining only those few drops that wet the walls of the tube. The tube is then filled up with distilled water, achieving a dilution of perhaps 100 times. The cell voltage is now reduced, and the galvanometer deflects appropriately when the two cells are connected in opposition.
It is possible to use an electrometer to measure the e.m.f. of one such copper-silver cell, and this may be thought worth doing as a check on the calculation given in the text. The changes of e.m.f. are too small to be shown easily on the electrometer, however, and if only one cell is made up, a potentiometer arrangement must be used to replace the second cell, the indications being given, as above, on a galvanometer. The 5 kΩ preset potentiometer suggested is not easy to use for this purpose, and can with advantage be replaced by a potentiometer with a larger distance of travel between maximum and minimum positions.