
The provision of a multi-access system for a user community is only the first step in satisfying their need. The system must be seen to be reliable (it doesn't keep breaking), and it must be usable. Some multi-access systems have allowed their users so much freedom that either the response time becomes too great to achieve any useful work in a reasonable time, or else the users find it virtually impossible to obtain entry to a perpetually full system. If the system writers are not to be caught out by this state of affairs, some measurement and analysis of the system is required to provide indications of when this is likely to occur, how many users the system can comfortably hold, and where in the system the computer spends most of its time. The two main approaches to this problem are via simulation and mathematical modelling. We have chosen the latter approach.
This paper describes the work undertaken on an extension of a model first used by Scherr at MIT.
The Chilton Laboratory has an Atlas I computer, with 144K of one-level store. Since 1964 it has provided a service for all the universities, most of whom have used the postal system to submit their jobs. In 1967 it was felt that some form of multiaccess system should be attempted, but it was evident that any such system could not be allowed to interrupt or slow down the existing service. The Atlas Supervisor (Kilburn, Howarth, Payne and Sumner 1961) is geared to batch operation only, and is sufficiently complicated to prevent any trouble-free additions or alterations. Thus a project was initiated to see if it was possible to provide these extra facilities within the given constraints. Some form of satellite computer was needed to perform as much of the work as possible, and an XDS Sigma 2 (XDS Reference 1969) was chosen.
At the same time, a large Data Products Disc file was bought for Atlas, and the Supervisor, input and output wells, originally on tape, were put on to this disc. The rest of the space was divided into scratch areas and private areas. The Atlas block (512 words, 48 bits) was used as the unit of transfer to and from the disc. As the disc file had a second controller, the Sigma 2 was connected to the disc as well, and, by convention, it uses 3 million words (out of a total of 16 million) for its own file system. The two computers are also connected via a peripheral channel link so that each looks like a paper tape reader/punch station to the other. To initiate a job on Atlas, a job description (Howarth, Payne and Sumner 1961) is required, input either through a card reader or a paper tape reader. The provision of this link enables the running of jobs on Atlas from Sigma 2 without any changes to the Supervisor.
The Sigma 2 is a 32K, 16 bit word machine, with a sophisticated interrupt system, completely controllable by program if required, and a built-in multiplexor, capable of handling a variety of terminals, which ensures that no input characters are lost, even if the associated interrupt cannot be serviced fast enough. The Data Products Disc file was interfaced to a direct-to-memory channel but this channel only gives access to half the store, and, as the transfer unit was still the same size as before, it was necessary to provide a 1½K, 16 bit buffer for any transfer. Thus the store had to be organised in a way which did not involve the retention of such buffers for each user.
The following method was adopted. Any user in the system has an input buffer, capable of holding a line of information directly from the terminal. If he is creating a file, for example, on completion of the first line of input, one of another set of buffers, known as small buffers, (which can hold 196 characters) is requested. If one cannot be obtained initially, he is halted until one is available, and steps are taken by the system to provide one. Otherwise the contents of the input buffer are copied into the small buffer and more input is requested. This in turn is copied into the small buffer until it is filled, when another small buffer is required. This will be chained to the previous one and filled with input in turn, the whole process being repeated until the user ceases to input, or a request for a small buffer cannot be satisfied. In the latter case, the contents of the small buffer chain is written to the file on disc, the chain is released, and the user proceeds to the next command or builds up a new chain.
To empty the small buffer chain, the current file block must first be read down and then updated with the information from the chain. This requires the following sequence of operations. A request is made for one of the disc buffers, of which there are only four, and any unsatisfiable request is queued. When a buffer has been obtained, a read transfer is requested, and, again, any unsatisfiable request is queued (only one transfer may occur at a time). All queues are first come, first served, with the exception that anyone who has waited on the disc buffer request queue goes straight to the head of the transfer queue. When the transfer has been completed, the contents of the chain are copied into the disc buffer, a write transfer requested, and, on completion, the disc buffer is released. Thus the large disc buffers are held for as short a time as possible.
The above detailed description of the store and disc management has been included so that the simplifications of the mathematical model may be more readily appreciated. As for the rest, Sigma 2 manages the file system, provides editing facilities, and allows users to initiate jobs on Atlas, using files. Any output from such jobs may return to the file system if required, or be sent to any of the normal Atlas peripherals.
However, the restriction preventing any alteration to the Supervisor means that no interaction is possible with a user program running in Atlas. Thus the model is attempting to describe the behaviour of a multi-access editing computer, having remote-job-entry facilities with a larger machine, and sharing its disc. Further details can be obtained from Baldwin and Thomas, (1971).
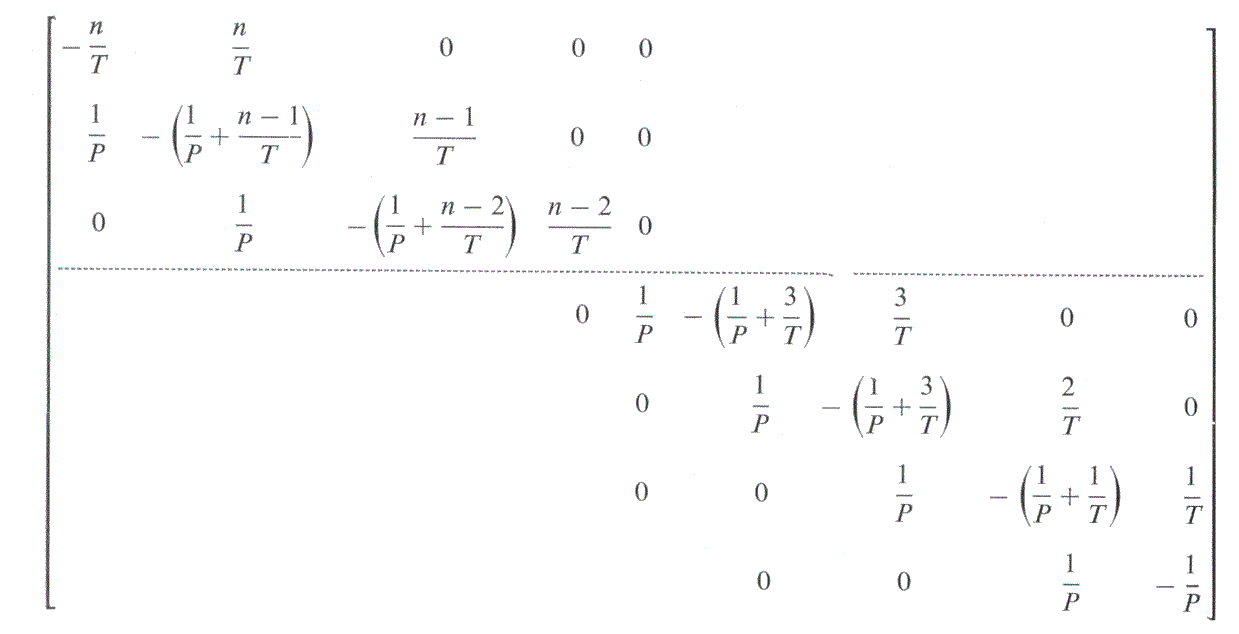
The Markov model technique is concerned with the number of possible states that a system may occupy, and the manner of its change from one state to another under varying loads. By measuring the probabilities of changing from state to state, it is possible to predict the steady state probabilities of occupancy of any state, and the mean queue lengths for entry into various parts of the system. This technique has been used extensively, with many additional complications, in Economics. Scherr, 1965, applied a Markov model to the CTSS time sharing system at MIT, and was successful in predicting the behaviour of the system. Briefly (since a full description appears in the above mentioned work) the time unit considered was that of a user thinking, typing input, waiting for a response and reading output. During this unit of time, called an interaction, there are two possibilities: either the computer is doing some work for the user (processor time P) or it is waiting for the user to provide another command (thinking time T). It was assumed that P and T would have exponential distributions. If there are n users in the system, there will be n + 1 states, where state j indicates that j users are active at the moment (i.e. waiting for processor time). In this state, there must be n-j users thinking, and so the rate of exit to state j + 1 is (n-j)/T. If it is assumed that each user in state j is receiving an equal portion of processor time, the rate of exit of anyone to state j-l is 1/P. No other states can be reached from state j directly, so the rate of transition of state matrix, A, is tridiagonal. This is not the stochastic matrix required by the Markov model, (the matrix of probabilities of changing from any state to any other state). However, if the diagonal elements are defined such that the sum of each row is zero, then the resulting differential matrix can be shown to behave in a manner similar to the stochastic matrix, and the desired results can be obtained from this instead (Howard, 1960).
The rate of transition of state matrix A is given by:
If π = (π0, π1, . . . πn,) is the vector of steady state probabilities of occupancy of a given state, then , and πA = 0 (the definition of steady state).
If
then Scherr proved that
In the CTSS system, only processor time and thinking time were required, since the disc and drum transfers were not overlapped with processing. This is not true of the Sigma 2 system, so a suitable modification of the model was required. It was decided to treat the processor and the disc as separate black boxes in series, and attempt to fit a model to each. Thus, an interaction now consists of three parts: thinking time T, processor time PI and disc time P2. Hence, if W1 and W2 are the mean response times of the processor and disc respectively, and π01 and π02 are the probabilities of there being zero users waiting for the processor and disc respectively, then
and hence, for the whole system,
and we may use a relaxation technique to determine W1 and W2, viz.,
and repeat from start.
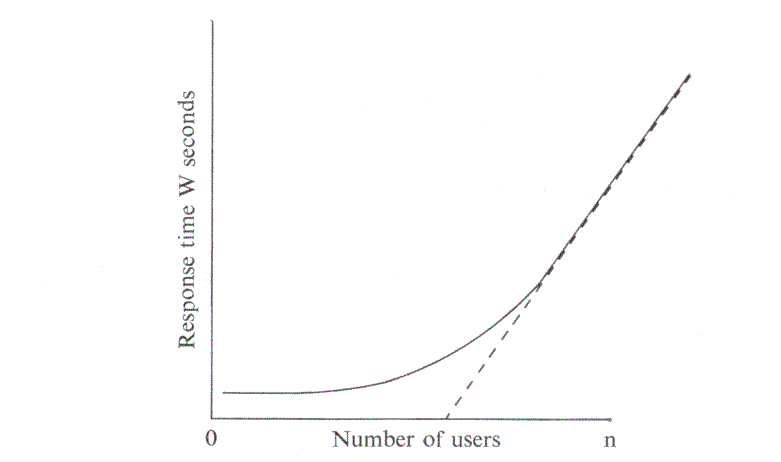
These equations indicate that the graph of W against n will look like
Like CTSS, it is assumed that T, P1 and P2 all have exponential distributions. Whether this is true or not will be demonstrated by the data collected. Certainly the results of the two models are very different, since this system has a higher rate of data flow relative to processor usage than CTSS. For simplicity, no attempt has been made to include Atlas in the model, but this may have to be altered in the light of experience. It was also found more convenient to rearrange the period of the interaction so that the order of events becomes: user waits for response (involving both disc and processor), reads the output, thinks, and types in a new command. This should not materially affect the results, since each interaction is being broken into its constituent parts before any data is submitted to the model.
In order to construct and verify the model, it is necessary to collect data and to process it. To perform the first it is necessary to decide what is going to be collected, where it is going to be stored, and by how much the collecting mechanism will alter the system under observation. In order to collect data for T, P1 and P2, units of measure must be chosen that are independent of the system load (i.e. independent of any queues) since the purpose of the model is to determine the queuing relations between them. However, since there are two queues (the disc buffer request queue and the disc transfer request queue) which interact, this condition has been relaxed somewhat, to retain simplicity. (Simplicity in everything is a key requirement, and is only surrendered as a last resort.) The allocation of disc buffer space has therefore been ignored as a separate item, and the satisfying of a request for a buffer has been left as system idle time. This leaves three activities:
Terminal: T is a measure of the time taken from the initiation of some form of terminal activity (be it input, output or a combination of the two) till its completion. Thus thinking time will include the time taken to print a message as well as the time taken to type in. This means that the thinking time no longer has a true exponential distribution, since large amounts of output are typed in equal sized units, producing a pronounced peak at 19.6 secs. (due to small buffers being 196 characters long and Teletypes producing output at 10 characters per second). However, the model depends only on the means calculated from the data, not on the variances, and such models are normally robust (i.e. not affected by such isolated peaks).
Processor: P1 measures the time from the allocation of the processor to a user till he makes a request that the system cannot immediately satisfy. This may be a request for Disc or Terminal activity, or it may be for some item, such as a disc buffer, which will be counted for that interaction as dead time.
Disc: P2 measures the time taken from the initiation of a disc transfer till its completion (i.e. till the system recognises that the transfer has been completed). To some extent, the effect of Atlas on the system is included here, since Atlas uses the same disc and will affect the transfer times.
A statistic collecting package was included in the system to allow this measurement to take place. A record, consisting of up to 10 characters, is output at the start and finish of each activity. There is, of course, the problem of where to put all this information. At first the only device available was a 110 characters per second paper tape punch, so it was necessary to restrict the amount collected. Hence, for the first attempt, the activities of only one user were logged, although the rate of data collection was not sufficiently high to provide the amount of information needed for a significant sample. The first analysis of a series of such tapes gave 4,600 interactions, and although this produced some interesting indications, it would take too long to collect a reasonable amount for a detailed study (note that Scherr based his calculations on 200,000 interactions).
The study of this small sample gave the results in Table 1.
| Mean Think time | Mean Disc time | Mean CPU time |
|---|---|---|
| 16.62 secs | 0.279 secs | 0.219 secs |
| Pilot Study | ||
| Number of Users | Predicted Response | Measured Response |
| 1 | 0.498 | 0.780 |
| 2 | 0.505 | 0.755 |
| 3 | 0.513 | 0.761 |
| 4 | 0.521 | 0.530 |
| 5 | 0.529 | 0.962 |
Apart from the peak in measuring T (explained earlier), both P1 and P2 seem to be exponential. However, the differences between predicted and actual response times are considerable, due, no doubt, to the small size of the sample. It is worth noting, however, that the availability of the system for use may seriously affect the results. It is only operational in the mornings till 2.00 p.m. and so the users, most of whom are members of the Laboratory, tend to use it for short runs and quick jobs, or for background work, while using the normal in-house queues for submitting other jobs.
These results were sufficiently encouraging to warrant further progress. Having obtained a 3 million character fixed head disc, known as a RAD, the XDS operating system, RBM, was also implemented on Sigma 2. RBM was fitted into half of the RAD, and the statistics output was directed to the other half. It was then possible to deal with information from every user in the system. Calculation showed that about one minute of processor time was spent on statistics per session (4t hours, using approximately 40 minutes of measurable processor time), a sufficiently small amount to justify the assertion that no significant alteration was being made to the system under measurement.
One session produces around 700,000 characters of information, which can be processed on Sigma 2 immediately after a session in about 20 minutes, the time being spent mainly on floating point software.
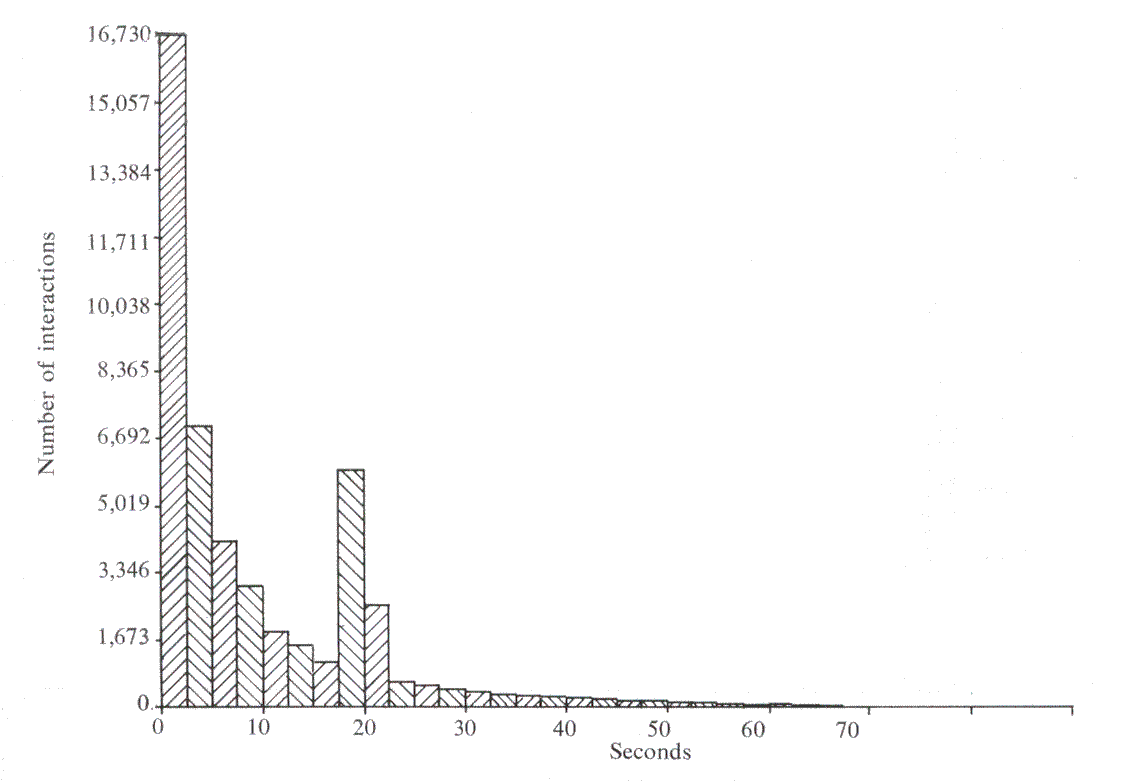
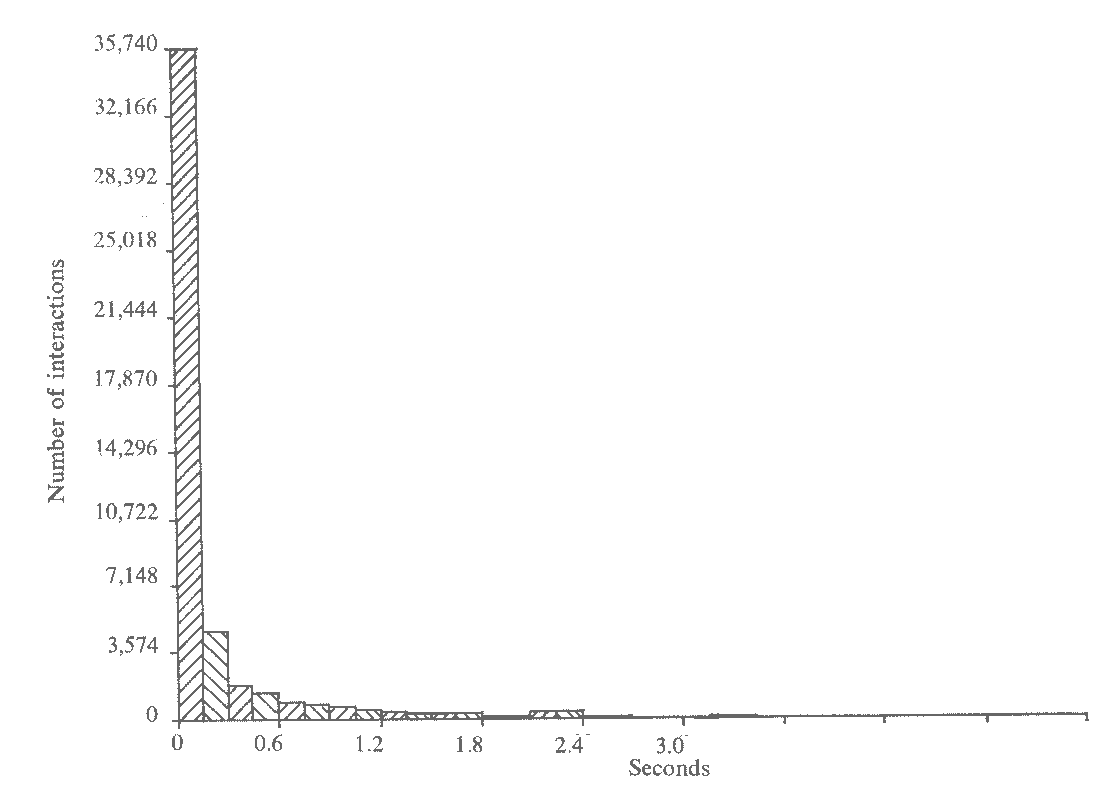
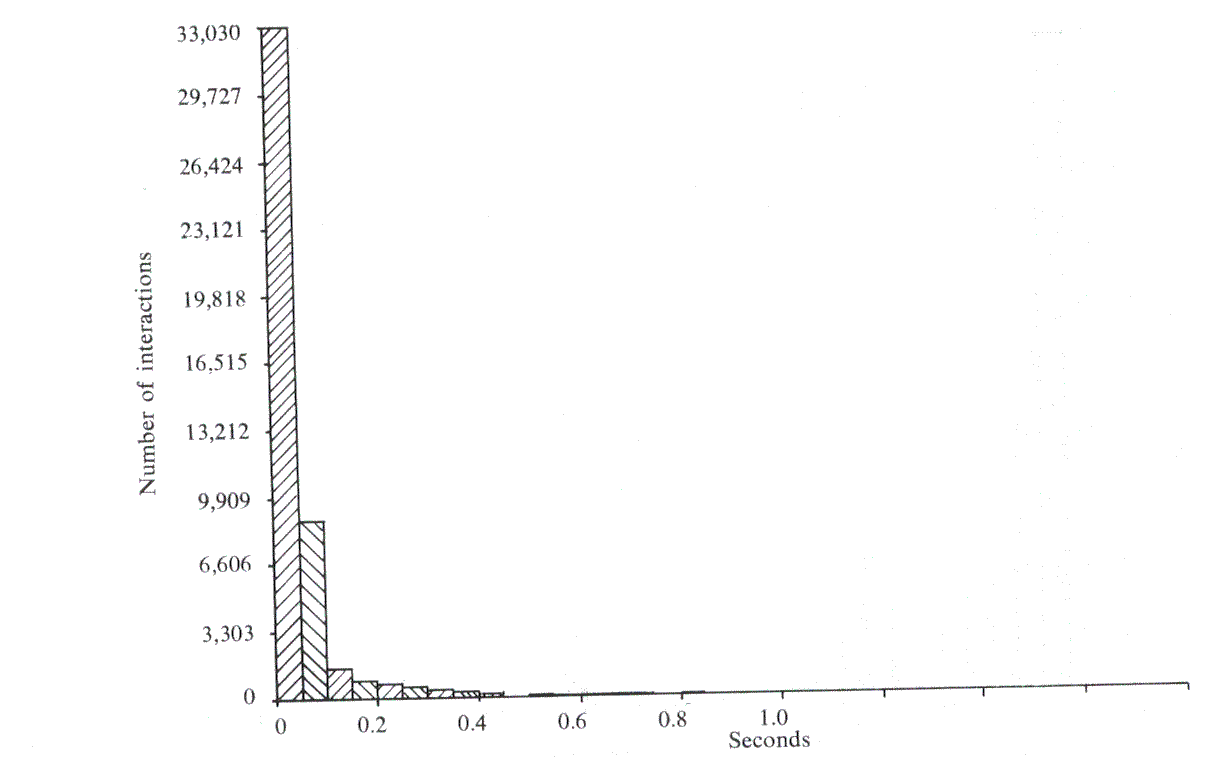
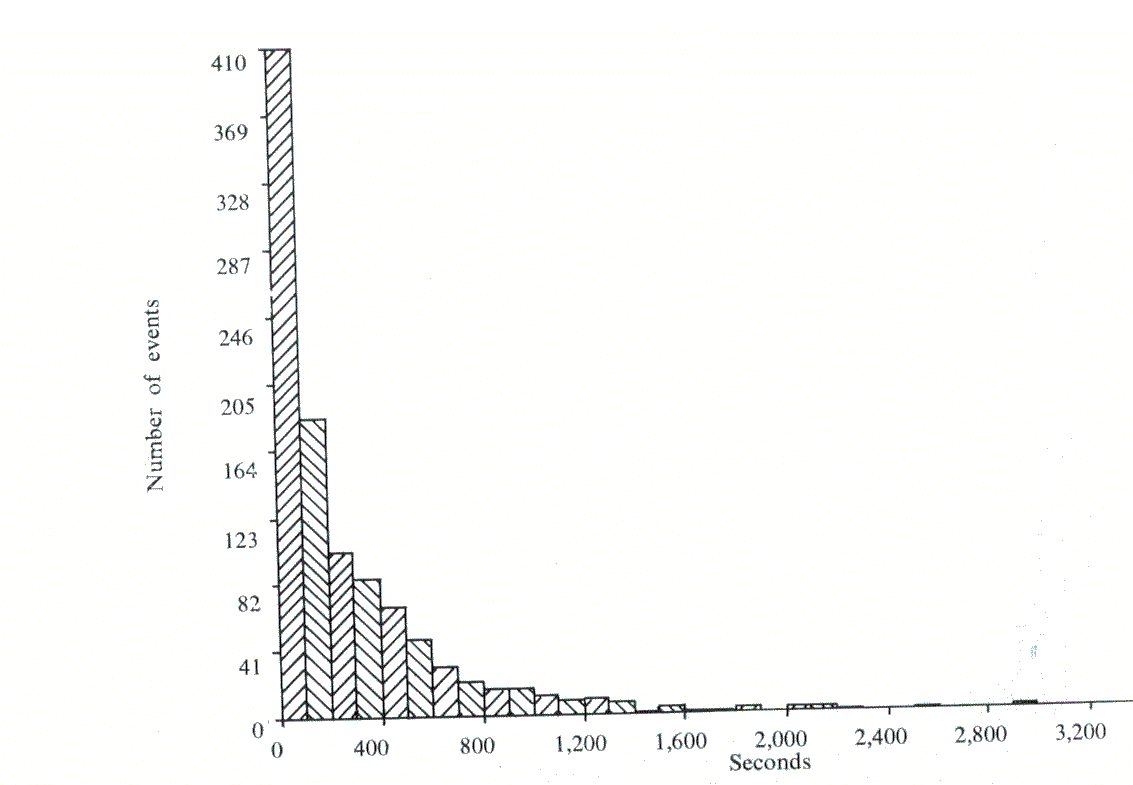
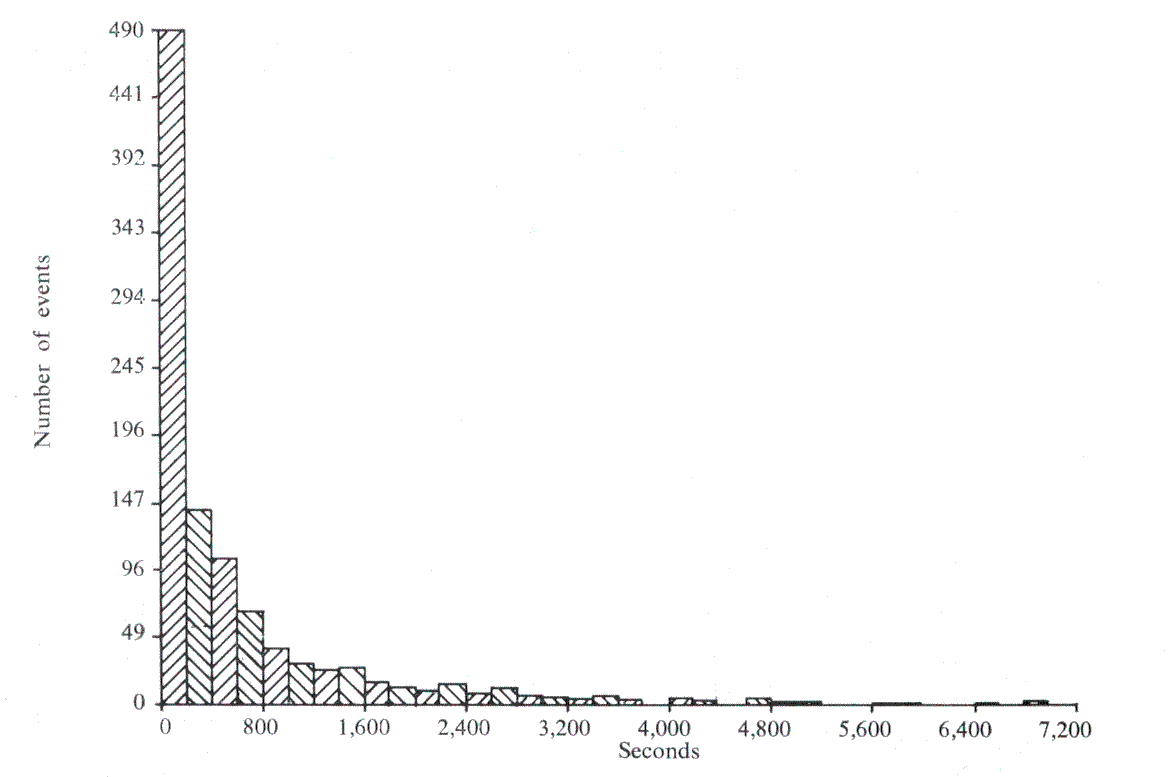
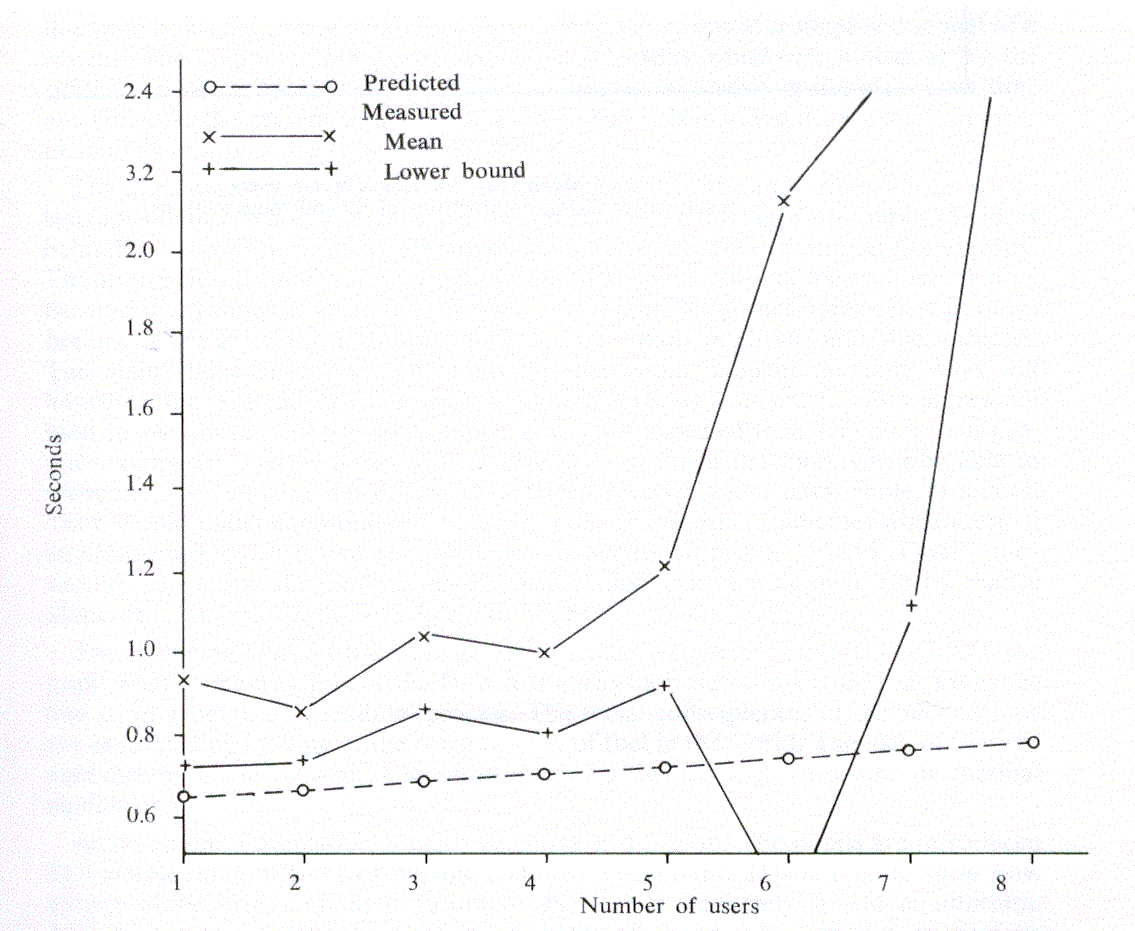
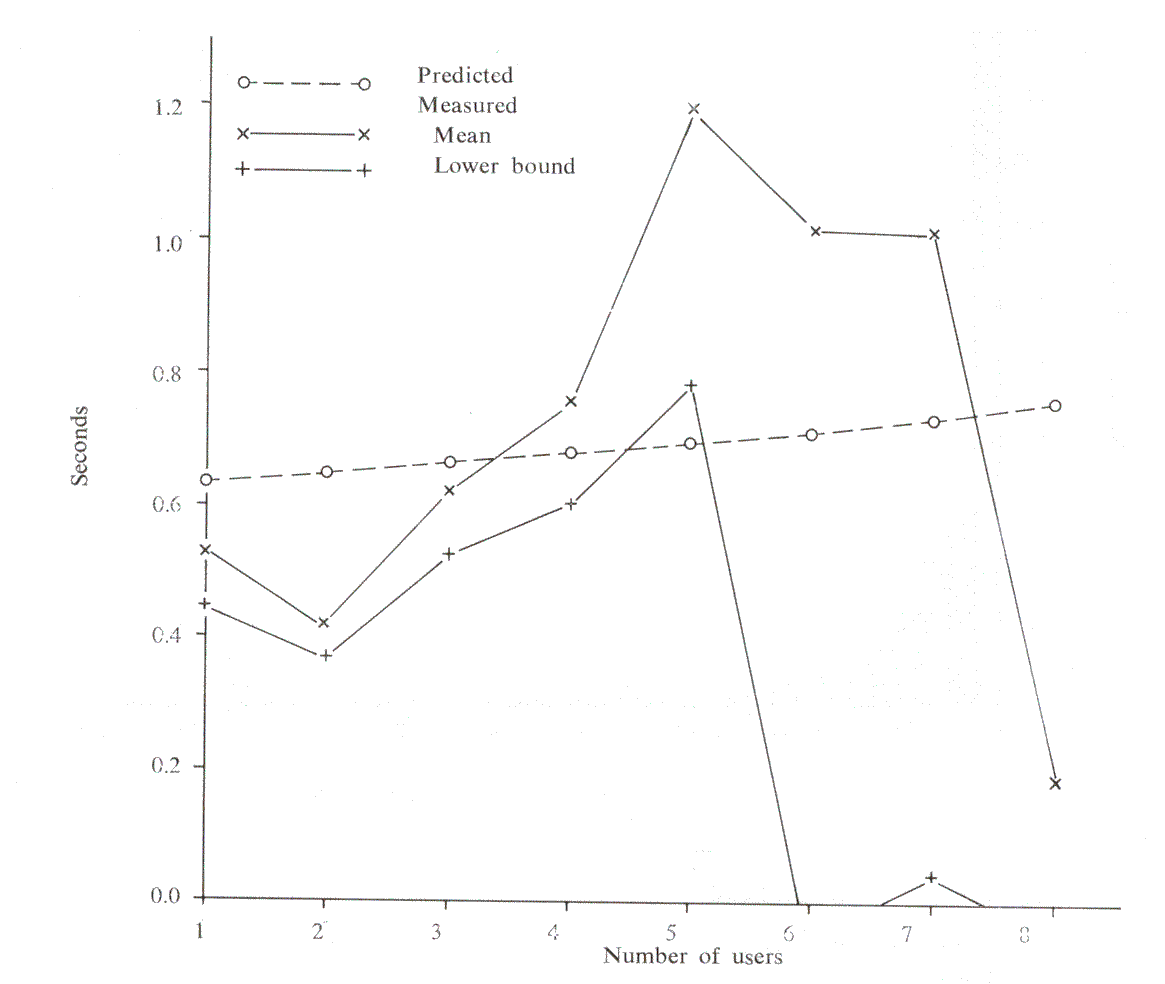
To ensure that there were sufficient results to form a basis of comparison, over 60,000 interactions were logged. This brought the standard error of each measured response time to approximately 0.25 seconds. However, although checks showed that all our known users were in fact using the system, reliable data was obtained only for the cases where up to 5 users were in concurrently. The appropriate histograms can be seen in Figures 1-5, and, apart from the peak in Think time, all the other histograms indicate exponential distributions. It should be noted that, even with the erratic use by the customers, the inter-arrival time and log-in time histograms also exhibit this distribution. However, the predicted responses (Figure 6 and Table 2), in the main, fall significantly below the measured ones, thus indicating t hat either we have ignored an important system overhead, or there is an error in the collection and processing of the data.
| Mean Think time | Mean Disc time | Mean CPU time |
|---|---|---|
| 12.4 secs | 0.332 secs | 0.380 secs |
| First Modification | ||
| Number of Users | Predicted Response | Measured Response |
| 1 | 0.712 | 0.948 |
| 2 | 0.734 | 0.964 |
| 3 | 0.752 | 1.097 |
| 4 | 0.773 | 1.222 |
| 5 | 0.796 | 1.154 |
In our case, both these conditions were found. Firstly, the error: as with most on-line systems, some form of time-out has been provided to catch the sleeping user. If such a time-out has occurred, the previous interaction was not completed correctly, and, effectively, two interactions were merged into one. This did not affect the input data to the model, since, as was stated earlier, the data from each interaction is broken down before processing. However, it did indicate a response time very much in excess of the norm, and this was having a significant effect on the measured times.
Secondly, the system overhead: as was stated earlier, the effect of Atlas had not been included, although its effect on the disc transfer times is included in the disc time measured, and, when jobs are sent to Atlas, the amount of work required is included in the measurements of the RUN command. However, nothing had been done about the translation and reception of output from Atlas destined for the file system. The other possible overheads were queuing of small buffers and disc buffers, also ignored.
Further measurements on these specific areas showed that, whereas the queuing of buffers did not play a significant part, the translation of output files did - in fact, this could take up to 20 per cent of the total disc time used, and 30 per cent of the non-idle CPU time. The omission of this had therefore given falsely low mean disc and CPU times, with the attendant low predicted response times from the model. This must therefore be included somehow in the model.
The translation of output can be considered as being done by a pseudo user since it is achieved by code which uses the disc and CPU in the same manner as all other users. This pseudo user has no console, of course. Translating output is effectively done by obeying an APPEND command (i.e. adding information from one file to another). Thus we can consider each file translation as one interaction with zero think time. Response time is meaningless for this user, although something akin to it could be total time taken to perform the whole translation. In fact, it was decided not to include any response time, although, if the results obtained from this second modification show that the predicted response time is now too great, it will be worth considering some form of response time for this user.
The inclusion of the pseudo user has two main effects. Firstly, the mean CPU and disc times will be raised, and so the predicted response times will also increase. Secondly, as the pseudo user is being considered as a true user for the purpose of cataloguing the measured response times, these measured times for a given number of users in the system will be lowered. At present, with n users active, all response times are catalogued for n users, independent of any activity by the pseudo user. This modification will mean that response times measured while the pseudo user is working will be catalogued with the response times measured for n + 1 users. Such response times are necessarily longer than those experienced without the pseudo user.
At the time of writing (December 1970), only 20,000 interactions have been gathered in this way, and the standard error is still large. However, the measured response times (Figure 7 and Table 3) have dropped considerably, and seem to be nearer the predictions of the model. In fact, they tend to be lower than the model, but it is too early yet to decide whether a further modification will be necessary.
| Mean Think time | Mean Disc time | Mean CPU time |
|---|---|---|
| 11.612 secs | 0.298 secs | 0.341 secs |
| Second Modification | ||
| Number of Users | Predicted Response | Measured Response |
| 1 | 0.639 | 0.524 |
| 2 | 0.656 | 0.422 |
| 3 | 0.673 | 0.626 |
| 4 | 0.692 | 0.751 |
| 5 | 0.711 | 1.195 |
Although the work on the model is not yet complete, there is cause to believe that it will serve to describe the system. During its development, it has shown that, whereas the effect of queuing the disc buffers and small buffers is negligible, the effect of Atlas cannot be ignored. Indeed, much more information was being returned to the file system than was at first thought, particularly when it is realised that nearly all the users are in a relatively small Laboratory, and can readily obtain hard copy output via the usual Atlas peripherals.
Once the design of the model has been finalised, it will be possible to use it to see how many users it could theoretically handle. It will also be possible to alter the sizes and numbers of the various buffers, obtain new means, and compare the responses obtained. Thus it should be possible to acquire some idea as to the correct relationship between these parameters, which were chosen, as in most systems, on an ad hoc basis. This model, depending as it does on means only, will be more likely to give good indications of response times, with less data, than a simulation technique that requires more accurate distribution information.
1. Baldwin, J. C, and Thomas, R. E. (1971). Multi-access on the Chilton Atlas, Computer Journal, 14,119-122 .
2. Howard, R. A. (1960). Dynamic Programming and Markov Processes, M.LT. Press, 92.
3. Howarth, D. J., Payne, R. B., and Sumner, F. H. (1961). The Manchester University Atlas operating system: Part II Users' description, Computer Journal, 4, 226-229.
4. Kilburn, T., Howarth, D. J., Payne, R.B., and Sumner, F. H. (1961). The Manchester University Atlas operating system: Part I Internal organisation, Computer Journal, 4, 222-225.
5. Scherr, A. L. (1965). An Analysis of Time-Shared Computer Systems, M.l.T. Press (M.I.T' Research Monograph No. 36).
