
This issue contains information on the X Window System Training Series, the CHEST Deal for PHIGS, the UK Shadow for Visualization Software Modules in the USA, the UNIGRAPH videos and the PHIGS Toolkit. The Graphics Coordinator reports on the recent Workshop on the Support of Computer Graphics. In the section Graphics around the Country attention has been turned (at the request of Bob McGonigle) to the activities in Scientific Visualization at the University of Leeds. We therefore include an article (and some pictures!) on the work being done at Leeds in this area.
Articles and short contributions on all aspects of graphics hardware, software, tools, and applications are always welcome!
I want to report this month on the results of the Workshop which looked at the Support of Computer Graphics. This was a lively event with 20 people contributing their thoughts on how we can manage to support computer graphics with increasing numbers of users, distributed computing, changing technology, increasing numbers of CHEST deals etc with no (or little) change in staffing.
Training is a major issue. Staff need to be trained and funds and time must be allocated to this if support staff are to keep up with changes in technology, software, deals etc. Suggestions included bundling in training with CHEST deals (and possibly annual payments), running regular training for support staff on graphics related topics. There is also a need to ensure that training materials arc available to help support staff train users and to be used in departments. The ITTI initiative is dealing with some of these issues but gaps need to be filled. Training staff to manage the problems (mostly people and management related) associated with distributed computing is also an area which needs addressing widely in the community.
We discussed whether we needed centres of equipment and centres of expertise (people rather than kit). Expertise in particular subjects needs to be tapped by the community if possible. It was felt that in general part time funding of experts to contribute on a particular topic, e.g. via mailbase support, was the best way forward, except possibly for new major areas where more help is needed, e.g. the Visualization Support Officer. We had a particularly lively debate on centres of expertise with people at current national centres feeling that they were a better idea than those who were not.
Use of bureau services is one possibility for new types of equipment that may not have a long life. Kit which is too expensive, and will continue to be so, is a candidate for a national centre. It must have enough life (3-5 years) to justify being purchased. There is also a need to associate expertise with nationally used equipment.
Introducing new technology is one of the roles of AGOCG. The model of the way visualization is being handled is a good one with a workshop, leading to reports, evaluation and funded support. What areas should we be looking at now?
The final area for discussion was standards and we agreed that the major languages we should be looking to support in services are Fortran and C and there is little interest in other language bindings. GKS and PHIGS (and PHIGS PLUS) are the main application interfaces. Graphical file formats are crucial to many services and these should be tracked and introduced where appropriate. The emerging standards for compressions (JPEG, MPEG) are likely to be of interest.
The full report is available as an AGOCG Technical Report and is listed with the other reports in this newsletter. Views on any of the above discussions are welcome, let me know what you think on the topics listed above.
CHEST have recently concluded a deal on behalf of the academic community with Liant Software Ltd for their PHIGS implementation FIGARO. The deal is intended to reduce the cost of the software at each site, by means of a site licence, with incremental costs for additional ranges of hardware at each site.
PHIGS is the ISO/IEC standard application programming interface (IS 9592: 1989) for the modelling, display and manipulation of 2D and 3D computer graphics. Whereas IS 9592 defines the functionality, the interfaces from Fortran and C application programs are also standardised via the Fortran binding of PHIGS (IS 9593 Part 1: 1990) and the C binding of PHIGS (IS 9593 Part 4: 1992).
The CHEST deal for FIGARO includes FIGARO+, PHIGS Command Interpreter and the Peripheral Support Option.
FIGARO is available on most common workstation models, including an interface to the X Window System, and the Peripheral Support Option provides other drivers, including Computer Graphics Metafile and PostScript, and this enables other computers to be used.
Since the C binding of PHIGS has only recently been standardised by ISO, most PHIGS implementations at present use an earlier draft of the C binding and FIGARO is no exception. Since the aim for most C application programmers should be to use the standard binding, some care needs to be exercised, in preparation for when Liant provide the ISO standard C binding of PHIGS. Judicious use of C header files can assist with solving these (syntactic) differences and enable an application programmer to use the syntax of the C binding standard straight away; an example of such a solution may be obtained from David Johnston of Informatics Department at Rutherford Appleton Laboratory (E-mail: david@uk.ac.rLinf). This syntactic problem should not exist for the Fortran binding, which was standardised in 1990.
The 1989 PHIGS standard does not include the PHIGS PLUS functions, for which the final text has recently been delivered to the ISO Secretariat, with therefore the final formal approval procedure expected to be activated soon. The final text of PHIGS PLUS contains changes compared with previous drafts. FIGARO like other implementations contains a selection of the PHIGS PLUS extensions of a previous draft.
The precise terms of the deal are being announced by CREST to all their site contacts. To find out about (or to influence the take-up of!) the deal at your particular site, the key person is your local CREST site contact. His or her identity can be found by contacting your computer centre or by consulting the list of CREST site contacts on the NISS bulletin board (CALL NISS.BB from a PAD and consult section D3E).
A technical evaluation report of PHIGS implementations including FIGARO is being prepared by Rutherford Appleton Laboratory and will be available as an AGOCG report.
We are pleased to announce the availability of the PHIGS Toolkit, a portable toolkit for PHIGS application programmers. The PHIGS Toolkit has been developed at the University of Manchester, and is funded by the Science and Engineering Research Council (SERC) and the Advisory Group on Computer Graphics (AGOCG). The Toolkit is based on the experience of the developers who have been active PHIGS programmers for several years and were also involved in the ISO technical review of PHIGS and PHIGS PLUS.
The main features of the PHIGS Toolkit are:
What is the PHIGS Toolkit? The purpose of the PHIGS Toolkit is to help application programmers to program more effectively and securely using PHIGS. The functionality provided by PHIGS is low-level, and the PHIGS Toolkit provides a number of tools of various levels of complexity in order to make programming with PHIGS quicker, and less painful. To the programmer, it is as if the functions provided by PHIGS have been supplemented with a set of additional functions, and a typical application will use both 'raw' PHIGS functions as well as PHIGS Toolkit functions. A convenient way to view the Toolkit is as a layer of software which sits on top of PHIGS.
Tools in the PHIGS Toolkit are divided into two categories: Programming Tools, and High-Level Tools. Programming tools are generally quite simple single-purpose procedures, and are designed to help applications programmers to construct PHIGS programs more quickly and reliably. The high-level tools are more powerful, and provide programmers with means for visualising and debugging structure networks.
The first phase of the PHIGS Toolkit does not include support for PHIGS PLUS. Work is now under way to expand the Toolkit to include extensive support for PHIGS PLUS functions, and the expanded PHIGS Toolkit will be released in April 1993.
A toolkit providing support for NURBS curves and surfaces is also under development at Manchester, and is designed to be complementary to the PHIGS Toolkit, although it may also be used separately. Beta-testing of the NURBS Toolkit is nearing completion, and it is expected to be released soon.
The International AVS Centre at the North Carolina Supercomputing Center (NCSC) was established to provide support for A VS. One of the functions the centre provides is a repository of A VS modules supplied by users which are available via anonymous FTP. Manchester Computing Centre (MCC) has now started shadowing the centre's repository of modules on a machine situated in MCC which provides anonymous FTP access. One facility however not provided by this site is the ability for users to submit their modules. To submit modules the procedure is outlined by the AVS centre and the modules are then filtered down to the shadow site once cataloguing and checking has been performed at North Carolina.
The anonymous FTP facility is available on a machine in the Manchester Computing Centre and may be accessed via the internet as hpb.mcc.ac.uk (130.88.200.7)
When you are connected to the server you should login in as anonymous and supply your E-mail address as the password.
To access the AVS modules you must move to the subdirectory pub/cgu/avs by typing cd pub/cgu/avs
Typing ls -CF will produce the following:
AVS_CATALOG AVS_SAMP_DATA/ MAPPERS/
AVS_LICENSE DATA/ RENDERERS/
AVS_README FILTERS/SUBMIT_RELEASE
There are four main directories of modules: DATA, FILTERS, MAPPERS and RENDERERS. These directories correspond to the four columns of modules within AVS. More information concerning the shadow and its facilities are contained in the file AVS_README in the pub/cgu/avs directory and should be read beforehand.
The X Windows Training Series is being developed at the Computer Services of the University of Edinburgh. The project is supported by the Information Technology Training Initiative (ITTI).
The project aims to provide material to the UK academic sector to aid with training in the X Windows area. The user course and the information pack are now ready. Also, workshops are being organised to train staff in the use of the materials.
A detailed mailshot has been sent in paper form to all heads of computer centres, contacts in polytechnics and IUTC representatives. The paper form contains relevant order forms for materials and booking forms for workshops.
If you would like a personal copy of the paper mailshot, please send your postal address to me.
The UNIGRAPH Video Teaching package was made in the summer of 1990 for UNIRAS 6.1f. Since then, UNIRAS 6.2 has been distributed and with it a new release of UNIGRAPH. The changes to UNIGRAPH as they affect the points taught on the videos are fortunately not of great significance.
The videos are just as effective as they were for teaching but it has been found necessary to adapt slightly the accompanying student notes. Print masters of the three altered pages have been sent to all sites who bought the videos. There was no name on some of the order forms so, if you have not received your new pages please contact me and I will send replacements.
Is anyone teaching UNIGRAPH or needing to teach it and not using the videos? If you would like more information about the video pack please contact me for details. The cost to higher education and research establishments is £35.00 plus VAT for two videos, teacher's notes and print masters for the student notes.
This article summarises the current plans and activities of the Scientific Visualization Group at the University. It also provides a report of an open seminar for all users arranged in the University on 22 January. This was attended by 150 people, not all of whom could be accommodated!
Scientific Visualization is an aggregation of tools and techniques for the processing and display of numerical data. Its strategic importance arises from the fact that high powered workstations (such as those supplied by Silicon Graphics and installed in the University) process large amounts of data. Effective methods are required for dealing with such volumes.
An Inter-University Workshop on Scientific Visualization was held in the UK in February 1991, under the auspices of the Advisory Group on Computer Graphics (which advises the Software and Information Services Committee of the Information Services Committee (formerly the Computer Board). As a result of this Workshop recommendations were made for investment in the area. A Visualization Coordinator post has been established.
We can therefore expect to see further national developments and initiatives in the coming year. Their objective will be to increase user awareness of the tools and facilities now available to users of workstations, advanced workstations, and supercomputers.
These national developments reflect similar initiatives that took place in the USA from 1985 onwards in order to enable users to exploit the supercomputer facilities being set in place. We can learn much from the lead that the USA has established in this field. Tools and facilities that have been designed in the USA over this past 6 year period can be obtained by us today by access across international computer networks.
An inter-departmental Group in the University of Leeds has existed since October 1990, and has had regular bimonthly meetings devoted to progressing a work plan in this area, and for disseminating information on current developments in the field, particularly in Universities, Supercomputer Centres, and Research Organisations in the USA. Its aim is to enable users to more effectively exploit the power and capabilities of the advanced workstations and supercomputer recently installed in the University as part of the general upgrade to computing facilities funded by the Computer Board.
The Scientific Visualization Group at the University of Leeds was formed on 2 October 1990 with the following objectives
There have been nine meetings of the Scientific Visualization Group to date, and a number of sub-groups have been set up which in turn have had their own meetings.
Although most members of the Group are from science and engineering departments and central service departments, we are keen to establish links with other departments in other faculties. We envisage that visualization tools will have creative applications in addition to scientific ones. We hope that, in turn, such creative and artistic talents will be of benefit to the scientific visualization community in the presentation of their images. Such cross-disciplinary ideas should be to the benefit of all.
The Group has accomplished the following objectives to date -
An introductory document on Scientific Visualization has been compiled to explain and illustrate the usefulness of the tools now becoming available.
A survey of current work in the area in the University of Leeds has been compiled.
An E-mail circulation list has been set up to enable information to be disseminated. Items of general information can be sent to this list, and all users on it receive the information by electronic mail. Any member of the University can have their username added to the list and receive information and participate in discussion.
Full information on visualization software available from vendors and also in the public domain has been obtained. Khoros and apE have been obtained and tried out at Leeds in a variety of applications areas, as has Wavefront's Data Visualizer.
A number of seminars have been arranged, with the objective of appraising the University of current developments in the field which would be of benefit to the University of Leeds. These were as follows
A budget for software for visualization for 1991/92 has been obtained. A small sub-group of the Scientific Visualization Group was set up on 24 September 1991 to handle all matters to do with the evaluation of current vendor software with a view to bringing forward a recommendation for purchase. This Subgroup consisted of Dr Tim David (Mechanical Engineering), Dr Rosemary Creasey (ECU), Dr Ken Brodlie (Computer Studies), Dr Ben Whitaker (Chemistry), Dr Basem EI-Haddadeh (UCS), Mr Gurm Bacchus, and Dr Rae Earnshaw. It has had six meetings to date and has met suppliers.
Many users of scientific visualization facilities generate realtime simulation sequences. The best way of capturing this information is to output it to video. We expect this will be a rapidly increasing requirement in the University for research investigations, presentations at Conferences, publication (some journals are now in video form rather than paper), and storage of results. A subgroup for bringing forward a strategy for handling video was set up on 10 December 1991, and has had two meetings to date. This subgroup consists of Mr David Brook (Audio Visual Service) Mr Alan Haigh (Audio Visual Service), Dr Tim David (Mechanical Engineering), Dr Rosemary Creasey (ECU), Dr Ken Brodlie (Computer Studies), Dr Ben Whitaker (Chemistry), Dr Basem El Haddadeh (UCS), Mr Gurm Bacchus, Dr Rae Earnshaw (UCS), Dr Mike Wilson (Applied Mathematics) and William Cooper (Institute for Communication Studies).
A sub-committee of the Information Technology Committee (chaired by Roger Hartley) is looking at the use of IT facilities for teaching and the use of computer based information and teaching materials. A number of members of the Scientific Visualization Group have interests in the area of utilising visual materials in a teaching context and some are members of the Multi-Media subcommittee. We believe this close association is to the benefit of both groups, particularly in the context of teaching and teaching initiatives.
We believe visualization tools are strategic and enabling facilities. They enable users to utilise advanced computational facilities with a minimum of programming effort. They can be tailored to particular applications and application areas. State of the art functions and capabilities are already built in to the software; users and researchers do not have to spend valuable time becoming experts in designing computational or graphical tools for research. The tools are already available and can be exploited readily in a variety of application areas.
As an example, Khoros is a scientific visualization system available free from the University of New Mexico. It contains 350,000 lines of C code and represents substantial investment of time and effort by its designers. It contains extensive facilities for visualization, signal processing, and image processing. A large community of users in a variety of application areas has been built up worldwide. Discussion and help is available by subscribing (free of charge) to an electronic mail list.
Output on to video is becoming increasingly important - to capture real-time information on simulations etc. Staff and researchers need this output for demonstrations at conferences or to secure research funding.
Over 150 staff and students turned up to attend this joint seminar arranged by the Scientific Visualization Group and the User Group at the University of Leeds on 22 January. A combination of video and computer presentations illustrated the latest products and facilities in this area, and already in use by key researchers in the University.
Dr Earnshaw, Head of Graphics, began the session by outlining the significance of data visualization facilities and what they could do. The current major upgrade in computing facilities in the University has brought computation and graphics capabilities to every workstation. Powerful software tools are now available to enable users to process large, multidimensional data sets, often without programming. The Scientific Visualization Group is currently procuring software to add to the current provision in this area, and has brought forward plans to enable users to output real-time images on to video. This is expected to be a growth area in the future, with demands for presentations at Conferences and to secure research grants from funding agencies.
Dr Tim David (Mechanical Engineering) outlined applications in computational fluid dynamics (CFD) and showed on video how data visualization facilities enabled the researcher to study fluid flow in detail, and thus obtain an understanding of the forces at work in real-life situations.
For many visualization situations the user will wish to view and interrogate their data quickly and efficiently. For these cases a 'turn-key' visualization system is the most appropriate. There are several of these turn-key software products on the market, however Dr. David used the Wavefront Data Visualizer product to demonstrate the set of tools normally available for this type of system. Primarily turn-key systems are easy to learn and time spent investigating the software is short. Not all scientists and engineers can afford time to investigate new visualization tools (even if they wanted to!), but simply wish to interact on large data sets with ease. The Data Visualizer has an easily applied input format, especially for structured and regular grids. By virtue of their complexity unstructured data sets need a little thought but can be input with only a small amount of time invested in translating the data. Data can be read in for scalar and vector fields along with specified geometry which more often than not provides important boundary conditions. The software provides a range of predefined tools which may be grouped together, made transparent or inert (available for use). These tools include isosurface and isovolumes, cutting planes, particle traces, sheets and ribbons, probes, axes, labels, rulers, lights etc. Volume rendering is also available. The real beauty of the system is the close interaction with data, though this does depend on the graphics power of the hardware on which it is mounted. All of these tools may be modified by the user, new colour maps defined, ranges altered.
An animation module provides a very good tool for seaming together disjoint sets of data along with providing the time dependent visuals which can sometimes bring to light information that would otherwise be missed. Any sequence of frames may be edited and a range of frames may be chosen for play back, including a single frame. The latest version of Data Visualizer has a calculator that allows the derivation of scalar and vector data fields on a mesh by combining existing scalar and/or vector fields for that mesh on a node by node basis.
Scientific visualization is essentially about interaction with data. The packages used to do this may be complex and require sophisticated hardware as in the case of, for example, those used in CFD, but the principles of good visualization software can be found in quite simple packages that even run on PC's.
This point was demonstrated using GENPLOT, which is an interactive graphing tool running under MS-DOS or Windows3.0. Some of the features of the software were shown. Firstly the ability to draw and fit curves from experimental data. Secondly the ability to transform the data using the function parser built into the system, including convolution through FFT. Finally some of the output capabilities, including support of 3D graphing and output to Postscript and WordPerfect file formats, were shown.
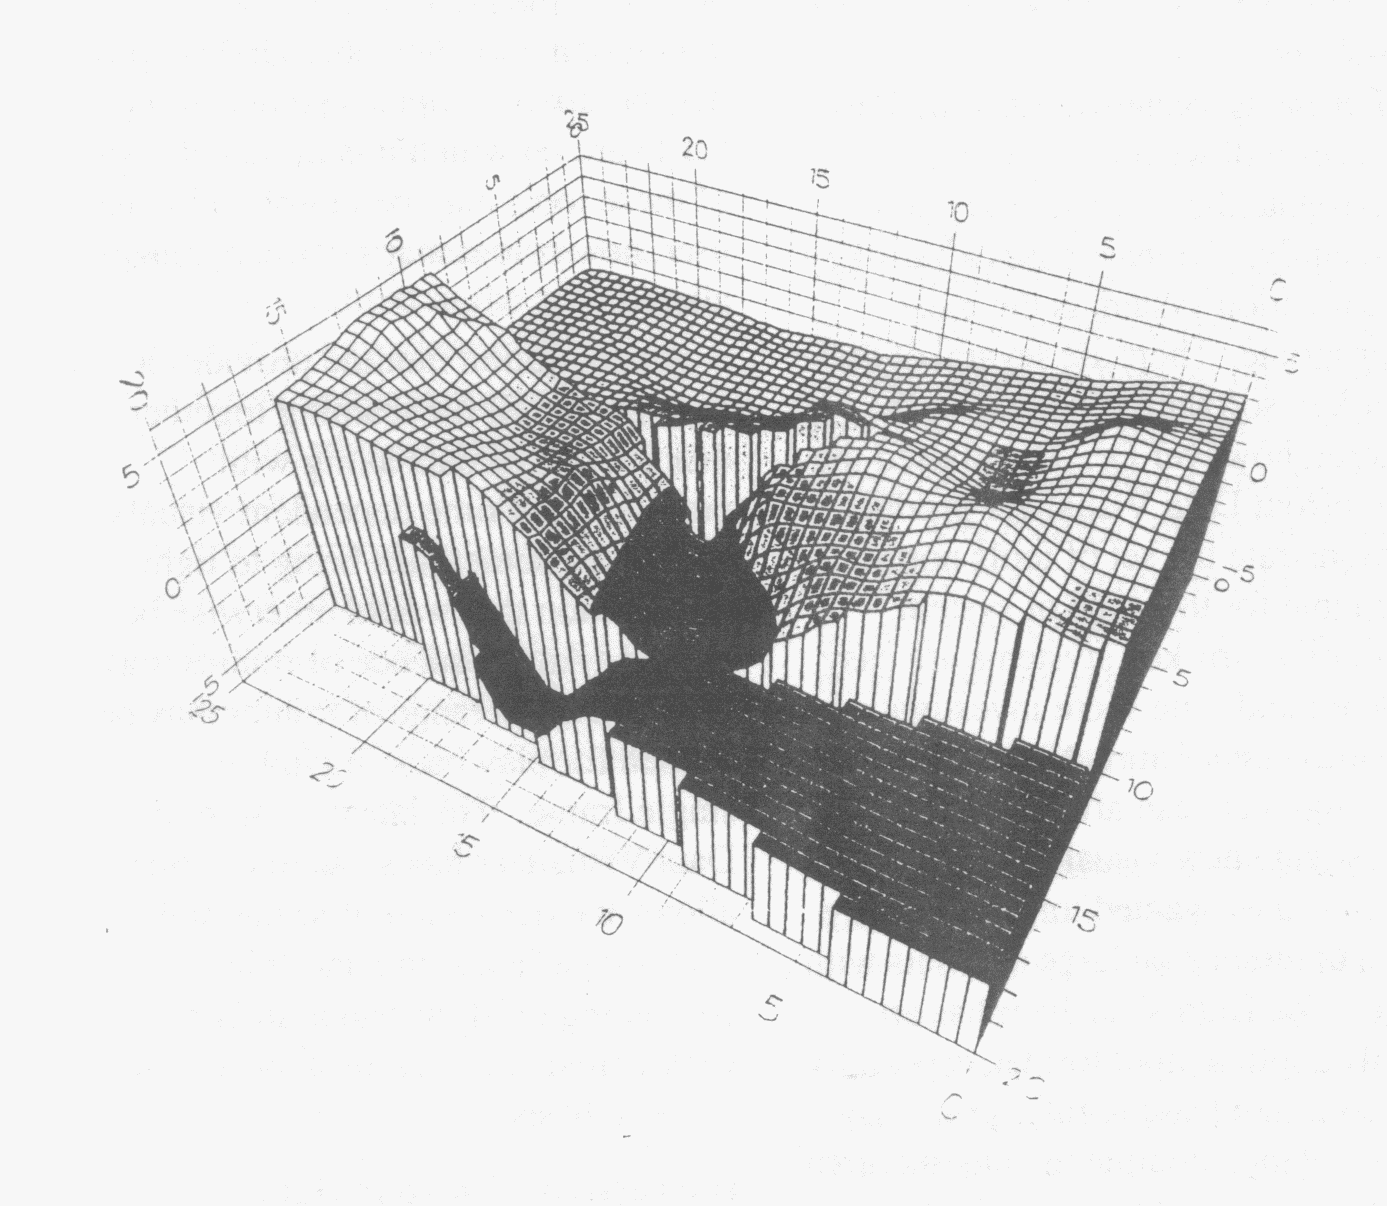
Dr Basem El-Haddadeh (Computing Service) used existing facilities provided by the Computing Service to illustrate how computer graphics can be utilised in geophysical applications. The UNIRAS software enabled surface and contour plots to be produced and also had facilities to produce cross sections to allow users to look inside surfaces and volumes.
He began by outlining the basic theory of Well logging and showed an area where 17 wells were drilled and a density log (gamma gamma log)was carried out where measurements were taken at fixed intervals down each well. The readings from the 17 wells were used to produce a 3D volume model of the density variation using UNIMAP. Then he used a UNIMAP tool to look inside the 3D model by removing a number of regions from the model. He used another UNIMAP tool to generate cross sections (slices) in the 3D model to show how density varies with depth (e.g. Figure 1).
He moved on to explain the basic theory of seismology and showed many seismic visualization tools that enable users (research and commercial) to study the tectonics of the earth and to find oil and gas fields. Again the examples he showed were produced using the UNIRAS software. Another geophysical application that makes use of state of the art visualization tools is the Magnetic method which measures the earth magnetic field at a given location plus the local magnetism caused by the local rocks. Exploration for oil and minerals (such as Gold) make use of this technique where are bodies and sedimentary basins are the target for the explorer. Using UNIMAP facilities (which does not require any programming knowledge) users can display their data in 2D or 3D and can determine the depth and shape of the Ore body.
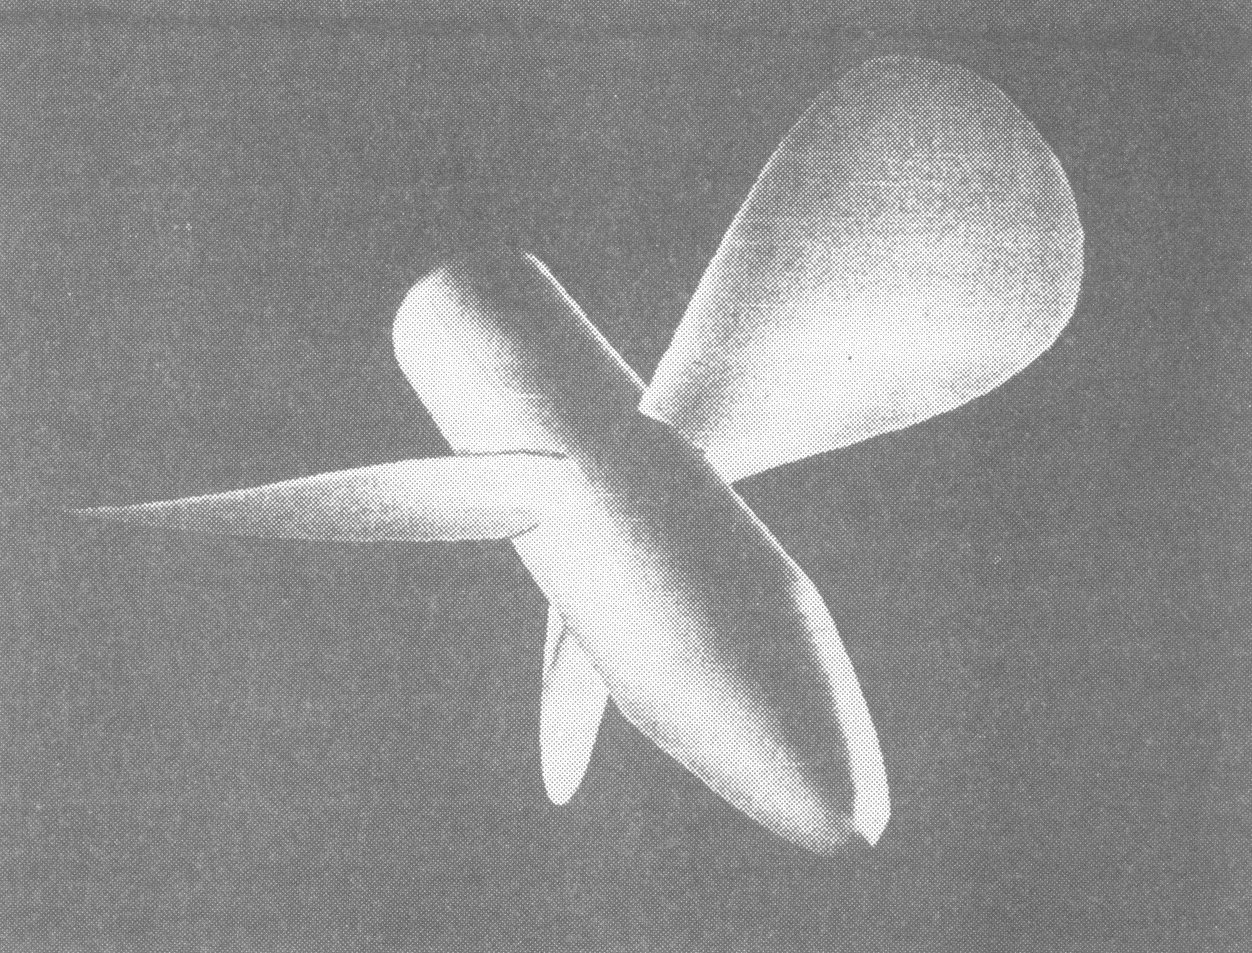
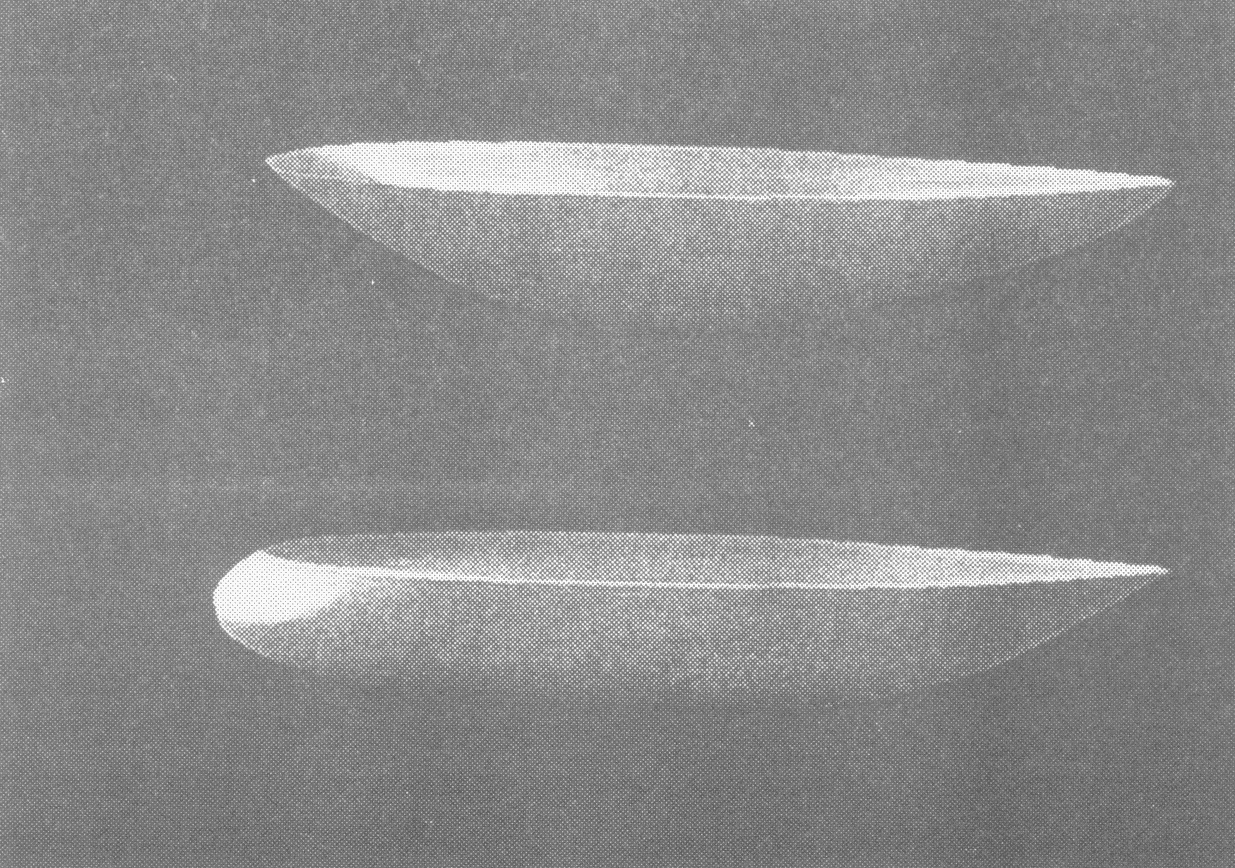
Dr Mike Wilson (Applied Mathematics) showed how high powered graphics workstations (e.g. Silicon Graphics VGX) have been utilised in the design of ship hulls and propellers. A particular mathematical model of the surface was first generated, which was then displayed for the user to interact with. A video sequence taken from the workstation was used to illustrate the design process.
The PDE (partial differential equation) method is a new approach to the design of shape for function and also as a basis for 3D free-form surface design and the solid representation needed for analysis of physical properties and generation of manufacturing data. The method designs the shape of an object by specifying its boundaries, and reduces the constructional data inherent in the patch based methods which currently dominate boundary representation. The PDE method is thus a basis for the functional design of shape, since by using it the number of parameters (both shape and functional) that describe the physical properties of an object is small - an essential feature for any shape optimisation.
At the heart of the technique is a mapping from a two dimensional region of (u,v) parameter space to a surface in real space. This mapping is obtained from the solution of an elliptic partial differential equation (PDE).
The technique can be used for blending and free-form surface design where the aim has been to generate functionally useful surfaces (e.g. propellers, ship-hulls) from patches of PDE surface. Illustrations are shown in Figures 2 and 3. An important feature of the method is that complex free- form surfaces can be specified by a relatively small set of shape parameters.
The method forms a basis for functional design, since with it the numerical optimisation of complex curved surfaces is feasible. This paper described work in which the physical properties of objects defined in terms of PDE surfaces have been calculated and optimised against their functional requirements, subject to pre-specified constraints. This has been made possible by the fact that such objects can be described by relatively small datasets. Thus the task of optimising the geometry of an object with respect to its function becomes computationally feasible.
Finally, recent work concerning the extension of the approach to solid modelling was described. This involves deriving boundary conditions for a 3-dimensional PDE from the surfaces of an object - which is especially convenient if these surfaces are themselves PDE surfaces as they will already be parameterised. Then, by solving the PDE, one obtains a parameterisation of the object's volume which can then be used as the basis for an analysis of its physical properties.
Bloor M I G & Wilson M J, Using Partial Differential Equations to generate Free-form Surfaces, CAD, 22 (1990), pp. 202-212.
Bloor M I G & Wilson M J , Geometric Design of Hull forms using Partial Differential Equations, In CFD and CAD in Ship design, ed. G. van Oortmeressen, Elsevier, Amsterdam, (1990).
Lowe T W ,Bloor M I G & Wilson M J, Functionality in Surface Design, Advances in Design Automation, Vol 1 Computer Aided and Computational Design, ed. B Ravani, ASME, (1990), pp. 43-50.
Lowe T, Bloor M I G & Wilson M J, Functionality in Blend Design, CAD, 22, December (1990), pp. 655-665.
Mr Gurm Bacchus (Computing Service) showed how application builders such as Khoros and Explorer allowed the user to process data files by setting up a visual network on the workstation screen, and then activating the network. High-level, state of the art functions are built in to systems such as these; all the user needs to do is select the items required by clicking on menus.
Khoros is a suite of software modules for 2D image processing and ID signal processing. The modules can be called from the UNIX command line and the output from one module can be pipelined to form the input of another module. The modules can also be linked into a users software. Alternatively, a visual dataflow interface is provided for the subroutines and is accessed via the Cantata software.
Using this interface, the user is presented with a workspace in which modules can be selected and connected. Each module has an iconic representation (called a glyph) The glyphs are connected by simply selecting input/output channels on one glyph and connecting them to the input/output channels of another glyph.
The software runs under X and X-Windows. This allows the software to reside on one machine with any X terminal being used for interaction/display.
An example of feature extraction from a 2D image was shown. First the colour map was altered to grey-scale to provide higher contrast in the image. The image then had a 5×5 LaPlacian convolution filter applied to it and was then passed to an edge extraction routine.
Recent studies have shown that data visualization techniques can be separated into three processes: filtering (to refine raw data); mapping (to select an appropriate geometric representation of the data, say as a contour map); and rendering (to display the geometric representation on a graphics device).
Less well understood however is the best way to link computation and visualization. Two approaches are common: post-processing, where the data is first generated by the computation, and subsequently displayed using a visualization system; and tracking, where the data generated by the computation is fed directly to the visualization. Neither model allows the user to control the computation, with the help of the visualization. This mode is termed steering, and a key element is some data management system that will allow intermediate computation data to be stored for later re-use. This style of working is being explored in the GRASPARC project, a collaborative venture involving NAG Ltd, Leeds University and Quintek Ltd, with funding from the DTI and SERC.
Another interesting topic is remote visualization, in which the computation may be carried out on a supercomputer at a national centre and the visualization on the scientist's desk. The issue is at what level to transmit the data between the two: before filtering, before mapping, before rendering, or even after rendering.
Brodlie K W, Berzins M , Dew P M, Poon A, Wright H, Visualization and its use in scientific computation, in Proceedings of the IFIP Working Conference on Programming Environments for High Level Problem Solving, pp196-211 Bergen, IBM 1991.
Dr Rosemary Creasey (Engineering Computer Unit) addressed the question What real users want' by looking at the variety of applications and the functional requirements in each area. In general, users required software (turnkey systems, application builders etc), hardware, network support, mass storage, and output facilities. These should be conveniently located, quick and easy to use, cost effective, reliable, and always produce the desired result. A tall order - but this is the goal.
Asking the question What do real users want in order to provide a means of data visualization?, elicited two distant types of reaction from computer users and non- computer users alike across the campus at Leeds. One group responded with comments like What is visualization? or How would visualization help me?. The others had a quite definite answer - but more of this later.
To answer the first group of questions it is useful to examine new areas where computer-based visualization is being exploited: these areas include financial analysts, artists (400 people entered the 1991 competition sponsored by the hardware company, TRUVISION), entertainers (Walt Disney Studies have recently signed a contract with PIXAR to produce the first full-length computer animated feature film) and teachers. These may be compared to the traditional areas of science and engineering. Data visualization may be as simple or as complex as the user wishes: 2D, 3D, solid models and animation or walk through with virtual reality now a possibility. From the users' view point, only they can define their requirements in terms of what they are trying to show, to whom, for how long and to what sort of audience. Having decided to explore what is available, a new user may wish to seek help from colleagues, workers in other disciplines and technical experts such as local computing centres, audiovisual services and national groups such as AGOCG. Visualization is one area where advice from disciplines other than one's own may be valuable.
Software available includes application builders or, for others, a turnkey system may be appropriate. Hardware may range from a PC costing a few thousand pounds to a large multiprocessor machine such as IBM's 2 million dollar Power Visualization System. Images will require large amounts of computer storage and a high band width to transport these over the network.
To return to those users who could specify their requirements in definite terms, what is required is a reliable system which is conveniently located close to the users' place of work, a system that is quick and easy to use which gives the desired result in a cost effective way.
Finally Dr David Morris (Computer Studies and Silicon Graphics Ltd) demonstrated the Silicon Graphics Indigo workstation and showed its capabilities for visualizing data.
The seminar incorporated on-line computer demonstrations via a link and video projector, and was also recorded on video for subsequent editing.
