A FORTRAN routine HIST3D which draws a three dimensional histogram has been added to the Graphics Algorithms Library. Data is supplied to the routine as a two dimensional array of values. The three dimensional histogram, is drawn as a set of rectangular columns (pillars) whose bases form a rectangular grid and whose heights are proportional to the values of the corresponding array elements. It is drawn using a perspective projection with hidden line removal. Scaling factors for the histogram may be specified as well as horizontal and vertical viewing angles and the viewing distance. The routine is a modified version of SCAT3D written by J Barlow (Bubble Charter Group, Rutherford Laboratory). It can be used with either SMQG or SPROGS.
Unless stated otherwise the normal FORTRAN naming conventions for REAL and INTEGER variables apply.
HIST3D(HDATA, ID, MX, MY, ZS, YRAT, ZRAT, THETAH, THETAV, PERS)
The histogram is drawn using a perspective projection. For this it is necessary to have a viewing plane coordinate system (internal to the routine) in which the histogram is drawn. Hence, the routine itself has to set the aspect ratio and limits of the drawing region. In order that this region will be independent of the data and viewing angles (an essential if the routine is to be used for making a film with changing data or viewing angles), a method of calculating the maximum size of. the histogram must be employed.
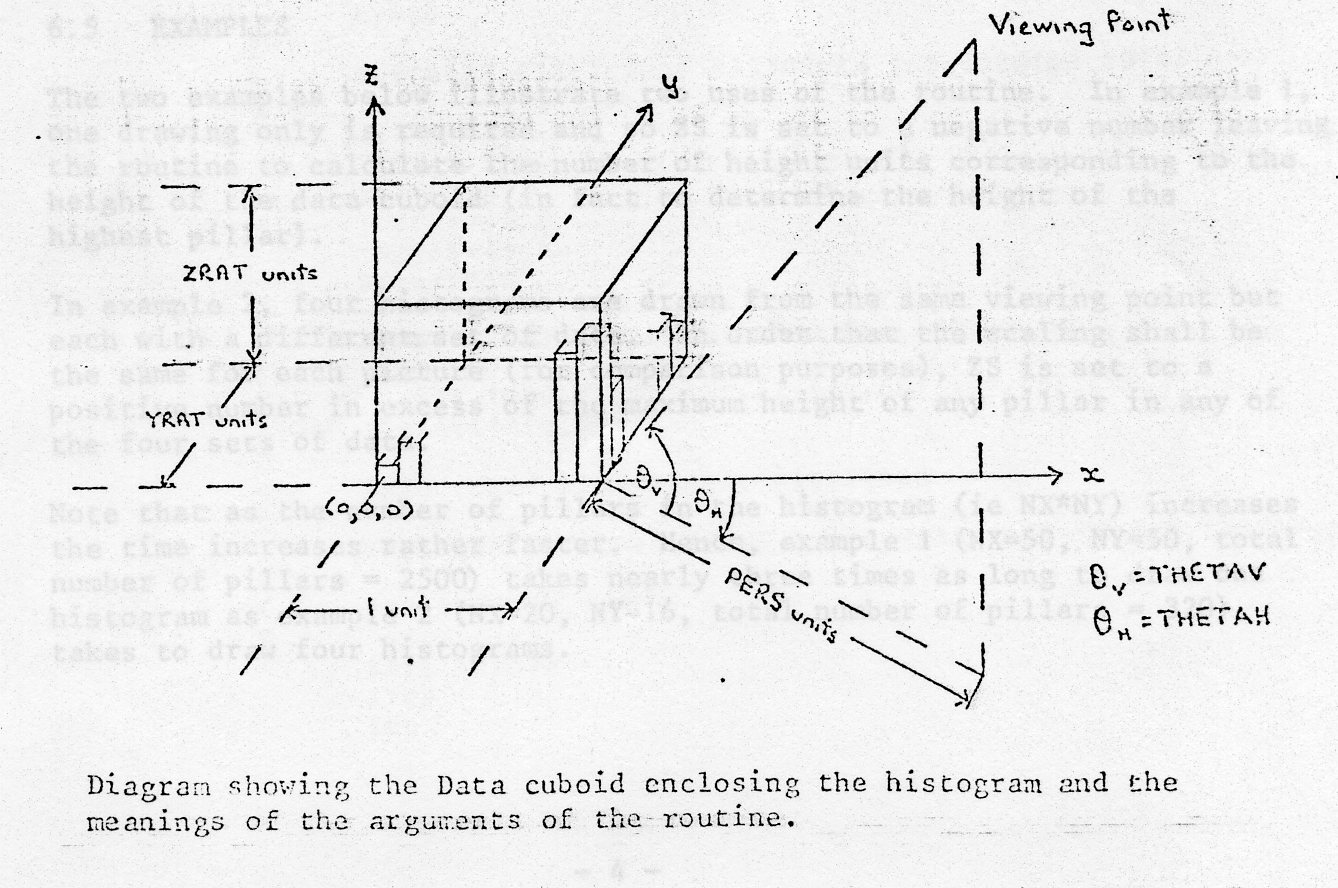
The method used is as follows. A data cuboid is set up to contain the histogram. The dimensions of the data cuboid are one unit in the x-direction (corresponding to the first dimension of the data array HDATA), YRAT units in the y-direction (corresponding to the second dimension of the data array HDATA), and ZRAT units in the z-direction (corresponding to the heights of the pillars). The x-lengths and y-lengths-of the pillars are calculated so that the base of the histogram fits the base of the data cuboid. The z-length (height) of the data cuboid corresponds to ZS height units (if ZS is positive) or the height of the highest (positive) pillar (if ZS is negative). Note that to obtain a data independent region ZS should be positive. Any values in HDATA outside the range 0.0 to ZS (or the height of the highest pillar if ZS is negative) are set to the nearer limit of the range. The maximum width and height that this data cuboid can occupy in the viewing plane (for any viewing angles but for a constant viewing distance) are calculated. A drawing region is then set up (by a call to the SMOG/SPROGS routine LTMITR - this routine is described in SMOG, a note accompanying the new manual) with the origin (corresponding to the centre of the data cuboid) at the centre of the region and limits so that the maximum width and height can be included. The aspect ratio is set so that one unit in the x-direction is the same length as one unit in the y-direction. On returning from the routine there will thus be a new visible area (see chapter 3 in the SMOG manual) with these limits.
Having set up this drawing region the perspective projection of the histogram is drawn, with hidden, line removal.
The arguments of the routine are defined as follows:
HDATA is a. two-dimensional REAL array of size (ID,MY). which contains the heights of: the pillars. These are arranged, so that the first dimension increases as x increases and the second dimension increases as y increases.
ID is the size of the first dimension of HDATA. This is necessary in case MX and MY are read in (as arrays must be declared explicitly in FORTRAN, this is needed for the routine to use the correct elements of HDATA if only part of the array is used. Usually ID and MX will be the same).
MX, MY are the number of pillars in the x and y directions, respectively.
ZS is the number of height units (ie those used for the heights in HDATA) corresponding to the height (z-length) of the data cuboid (ZS>0) or indicates that the height of the tallest (positive) pillar should be used for this (ZS<0).
YRAT, ZRAT are the ratios of the y-length and z-length, respectively, of the data cuboid to its x-length (eg if YRAT and ZRAT are both equal to 1.0 then the data cuboid is a cube).
THETAH. is the horizontal (ie in the x-y plane) viewing angle (in degrees) measured clockwise from the x-axis about the corner of the data cuboid on the x-axis further from the origin. The value of THETAH must be between 0.0 and 90.0 (inclusive).
THETAV is the vertical viewing angle (in degrees) measured anticlockwise from the x-y plane about the same point as THETAH. The value of THETAV must be between 0.0 and 90.0 (but must not equal 90.0).
PERS is a measure of the viewing distance. It is defined as the ratio of the horizontal distance between the corner of the data cuboid on the x-axis further from the origin and the projection of the viewing point in the x-y plane, to the x-length of the data cuboid. This should have a value greater than the maximum of 1.0, YRAT and ZRAT.
However, in certain circumstances this condition is not sufficiently stringent for the drawing to be entirely within the drawing region and the recommended value is at least ten times the maximum of 1.0, YRAT and ZRAT.
Those arguments which can have invalid values have their values checked. If any are found to have invalid values then either a default value is assigned or control is returned from the subroutine before the histogram has been drawn. In either case a message is output.
The meanings of several of the arguments are outlined in the diagram below.
Routine names:
 H3BOX, H3COOR, H3IPER, H3SCAN, H3SRCH, H3TDRW, H3TRAN
Common block names
 CLIBOP, H3CBOX, H3CSCN, H3CTRN
Barlow, J Franel, B "Graphic Representation of Functions of Two Variables" Rutherford Laboratory Report RHEL/R 259.
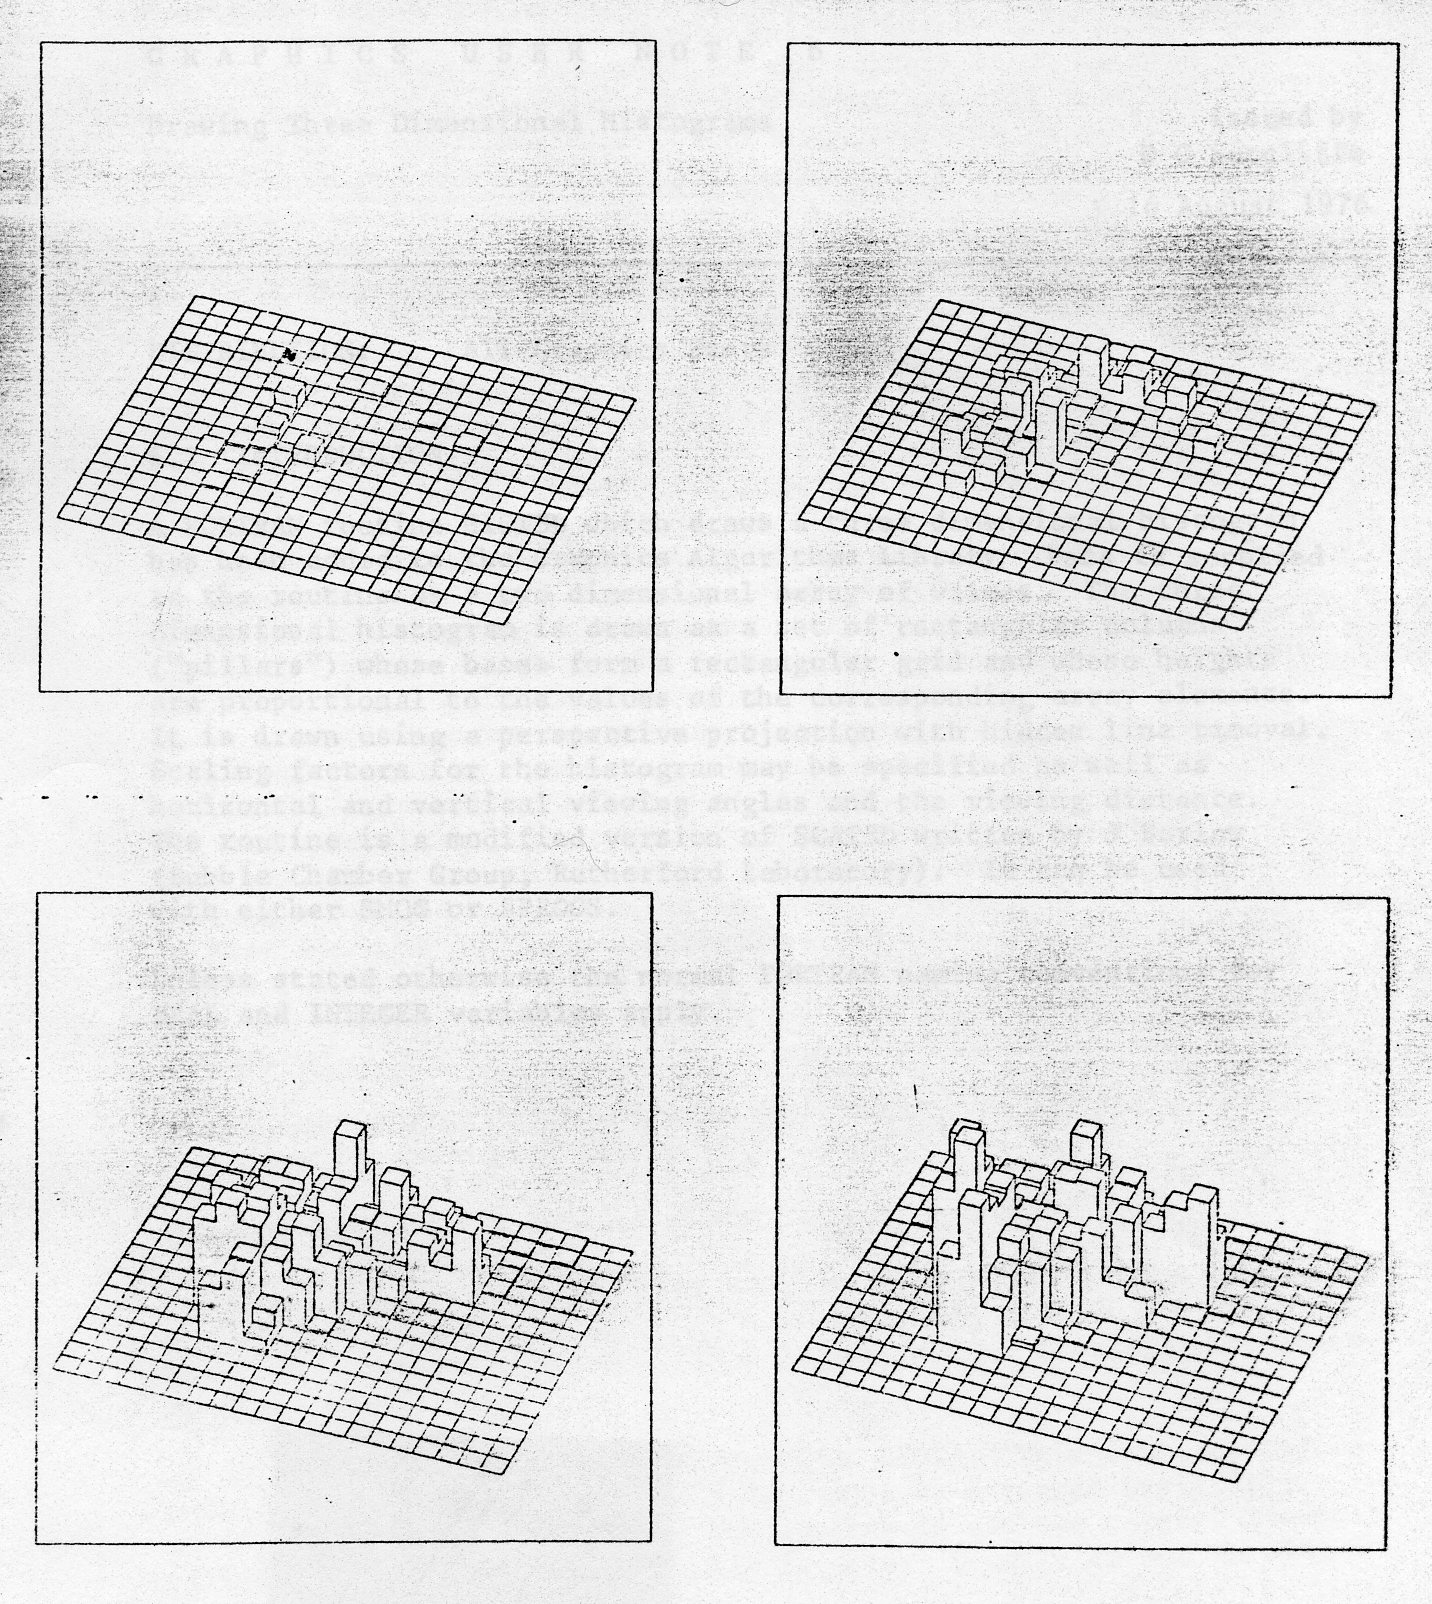
The two examples below illustrate two uses of the routine. In example 1, one drawing only is required and so ZS is set to a negative number leaving the routine to calculate the number of height units corresponding to the height of the data cuboid (in fact to determine the height of the highest pillar).
In example 2, four histograms are drawn from the same viewing point but each with a different set of data. In order that the scaling shall be the same for each picture (for comparison purposes), ZS is set to a positive number in excess of the maximum height of any pillar in any of the four sets of data.
Note that as the number of pillars in the histogram (ie NX*NY) increases the time increases rather faster. Hence, example 1 (NX=50, NY=50, total number of pillars = 2500) takes nearly three times as long to draw one histogram as example 2 (NX==20, NY=16, total number of pillars - 320) takes to draw four histograms.
If the programs of the two examples are in files H3EXMPL1, H3EXMPL2 (resp) and the data in files H3DATA1 , H3DATA2 (resp) then the following SMOG calls can be used to run them on the 1906:
SMOG *CR H3EXMPL1,LIB :GRAFLIB.GRAFLIB,#CR H3DATA1,TI 50,JT 65
SMOG *CR H3EXMPL2.LIB :GRAFLIB.GRAFLIB,#CR H3DATA2,TI 20,JT 35
The lineprinter and FR80 output from the two examples are shown.
On the 360/195 the ordinary JCL for running a SMOG job should be used to run the examples (note that the LIST and MASTER statements are 1906A specific and irrelevant to the 360/195).
      LIST
C
      MASTER EXMPL1
C
C     EXAMPLE OF USE OF HIST3D
C
      DIMENSION HDATA(50,50)
C
C     INITIALISE FR80
C
      CALL FRHCM
      CALL CINE
C
C     DEFINE EXTENT OF HISTOGRAM
C
      ID=50
      HX=50
      HY=50
C
C     DESCRIBE SCALING OF HISTOGRAM AND VIEWING POINT
C
      ZS=-1.0
      YRAT=1.0
      ZRAT=0.5
      THETAN=45.0
      THETAV=45.0
      PERS=20.0
C
C     READ IN HEIGHTS OF PILLARS FOR HISTOGRAM
C
      READ (1,1000) ((HDATA(I,J),I=1,50),J=1,50)
 1000 FORMAT(10F8.0)
C
C     DRAW THREE DIMENSIONAL HISTOGRAM
C
      CALL HIST3D(HDATA,ID,MX,MY,ZS,YRAT,ZRAT,THETAH,THETAV,PERS)
C
C     END PROGRAM
C
      CALL ENDSPR
      STOP
      END
---------------------------------------------------------
SUBROUTINE HIST3D HAS BEEN ENTERED
==================================
THE VALUES OF THE PARAMETERS ARE:-
ID   MX   MY       ZS             YRAT            ZRAT           THETAH          THETAV          PERS
50   50   50  -0.1000000E 01  0.1000000E 00  0.5000000E 01   0.4500000E 02  0.4500000E 02   0.2000000E 02

      LIST
C
      MASTER EXMPL2
C
C     EXAMPLE OF USE OF HIST3D
C
      DIMENSION HDATA(20,16)
C
C     INITIALISE FR80
C
      CALL FRHCM
      CALL CINE
C
C     DEFINE EXTENT OF HISTOGRAM
C
      ID=20
      HX=20
      HY=16
C
C     DESCRIBE SCALING OF HISTOGRAM AND VIEWING POINT
C
      ZS=75.0
      YRAT=0.8
      ZRAT=0.5
      THETAN=70.0
      THETAV=40.0
      PERS=20.0
C
C     READ EACH SET OF DATA AND DRAW CORRESPONDING THREE DIMENSIONAL
C     HISTOGRAMS
C
      DO 50 L=1,4
      READ (1,1000) ((HDATA(I,J),I=1,20),J=1,16)
 1000 FORMAT(20F4.0)
      CALL HIST3D(HDATA,ID,MX,MY,ZS,YRAT,ZRAT,THETAH,THETAV,PERS)
      CALL ADVFLM
   50 CONTINUE
C
C     END PLOTTING
C
      CALL ENDSPR
      STOP
      END