
This is a time of change for all of us involved in centrally funded deals as the Higher Education Funding Councils commence their work. How this affects AGOCG has to be determined at this time of writing. As David Boyd, Chairman of AGOCG notes in his article, we hope that things will continue without any disruption in the activities. I hope to be able to give some detailed information about the new funding structures in the next edition.
I have been involved in getting some small projects off the ground and these are some of the ones that have been agreed or look likely to be funded at the time of writing.
Travel funds have been allocated to allow evaluators to work on updating the visualization software evaluation carried out over a year ago now. This will look at the new and updated software.
An assessment of the possibilities for new media, such as CD-ROM, being used for AGOCG materials is being investigated at the University of Leeds. The project is investigating current and anticipated technologies to ascertain how they might be used in the context of information such as that contained in this newsletter.
Some training materials to be produced in SGML have been commissioned from the SGML project at Exeter University. These are to look at the topic of HyTime - the multimedia application of the SGML standard.
A project to produce materials for the new deals for ERDAS and VISILOG has been approved. This is a joint project between Leicester University and Liverpool University.
At the time of writing I am looking to set up a library of videos, slides and notes and proceedings from international conferences which will be available on loan to people in the community. More on that next time.
Other funds are going into:
If you have any thoughts or ideas on what AGOCG should be doing, or would like to make a proposal, then please do contact me.
The Advisory Group On Computer Graphics (AGOCG) was formed in August 1989 to provide a single national focus for computer graphics and related activities within the UK Higher Education community.
Its aims are:
The members of AGOCG represent the funding bodies who support AGOCG's activities and are drawn from University Computer Centres, graphics support staff, the Research Councils and users within the academic community. There are also cross-membership links with other bodies involved in the provision of computing facilities within the universities. AGOCG meetings are held quarterly.
One of the most significant decisions made in establishing AGOCG was to appoint a full time Graphics Co-ordinator to maintain close day-to-day contact with the community and to facilitate implementation of decisions made by AGOCG. Dr Anne Mumford from Loughborough University is the AGOCG Graphics Co-ordinator. Active coordination makes the most efficient use of available funds by tapping expertise in the community for the benefit of all and avoiding unnecessary duplication.
AGOCG was set up as a joint initiative by the University Funding Council's Information Systems Committee (ISC) and SERC. It receives a budget from ISC through its Software and Information Services Committee and is also indirectly supported by the Research Councils through their provision of resources for work on computer graphics and related topics. With the recent reorganisation of funding within the higher education sector, AGOCG will now come under the new Joint Information Systems Committee which will in turn report to the Higher Education Funding Councils. We expect that all of AGOCG's activities will continue smoothly through this transition however.
AGOCG's activities are wide ranging and include:
The activities mentioned above have been carried out through cooperation with many different groups in the HE and Research community and in particular with the Inter University Software Committee's Graphics Working Party (IGWP).
Further information on AGOCG's activities can be obtained from the Graphics Co-ordinator. I have recently taken over as AGOCG chairman from Prof. Bob Hopgood. I would be interested to receive your views on AGOCG's present activities or on further needs within the community which AGOCG could address.
A meeting of the IUSC's Graphics Working Party OGWP) was held at Oxford Brookes University on 17 February 1993 to discuss a possible evaluation of so-called technical graphing packages.
It was agreed that the main platform under consideration should be PCs running Windows as stand-alone or networked workstations. Unix workstations were considered to be well-catered for in this area by UNIRAS. The Macintosh platform was also discussed but it was agreed that, although this was an important platform, including it as a mandatory requirement would overly restrict the range of packages that could be considered. It was agreed that Macintosh support would be a desirable feature. UNIX workstation support would be a bonus.
The possibility of including technical graphing libraries in the evaluation was considered. However, it was agreed that there was decreasing demand for graphing libraries on PC based systems (demand for libraries on bigger systems has also been decreasing in recent years). It was decided therefore to restrict the evaluation to packaged software.
An attempt was made at the meeting to give a roughly defined set of features which would serve to broadly describe the area we were attempting to address. The following ad hoc list emerged from the discussion;
The quality of hardcopy output obtainable and the quality of the data presentation features was considered to be very important because of the requirement to include output from such packages in publications.
In order to further define the area to be considered, a list of packages prepared for the meeting by John Owen and Leslaw Zielesnik was considered. The list was divided into four main groups:
There are packages in all the above categories which have very good graphics facilities. However, it was the group's perception that packages for specific areas such as mathematics or statistics, which are widely used in the community, were often not suitable for use by the general user. It was agreed that further research was required to confirm this fully but for the time being only packages in the general plotting category on the prepared list would be included in further evaluation.
The evaluation team hopes to complete the evaluation by Mayor June and make the report available. If anyone has any comments or would like a fuller report on the meeting, including a list of software being considered, then please contact me via email.
A report on an evaluation of colour scanners carried out by the University of Bristol is now available for distribution. The report is likely to be of interest more for the techniques developed to carry out the evaluation, than for the results themselves. This is because the University experienced great difficulty in persuading suppliers and dealers to make equipment available for evaluation, in spite of repeated requests from both the University and AGOCG.
The difficulty appeared to stem from a lack of interest on the part of dealers who saw little or no advantage to their companies arising from a possible nationally negotiated deal. These problems were compounded by the regular arrival on the market of many new products, not all of which met the required specification, but most of which were extensively reviewed in the trade journals. It appears that, in terms of priorities, the academic community ranks well behind the trade journals in obtaining equipment for evaluation!
The report recommends that future evaluations of this type of equipment might best be carried out by devising a set of 'standard' tests and asking suppliers to submit the results of running these tests on their equipment or, alternatively, that we place more reliance on the evaluations carried out by the more reputable computer trade journals.
The report (Technical Report No. 21) is available from: Joanne Barradell
The UK AVS User Group is currently being established and has an interim committee with J R Gallop, Rutherford Appleton Laboratory, as the chairman and W T Hewitt, Computer Graphics Unit, Manchester Computing Centre, as the secretary. Membership is open to all, not only residents of the UK. The main source of members is the territory of the UK offices of AVS Inc., which covers northern Europe.
The purpose of the group is to encourage the free exchange of information concerning visualization and the products and services of AVS Inc, and to provide a focal point for the needs and requirements of its members. The group will also liaise with AVS Inc, the AVS Consortium and the International AVS Center.
The user group is planning to hold an inaugural one day meeting sometime during late March or early April in the UK.
The interim committee will propose two classes of membership:
Membership will entitle members to reduced rates for local meetings and publicity material which will include copies of the International User Group's newsletter AVS Network News.
If you would like more information on joining the group or the first meeting contact me.
On 16 February 1993 Advanced Visual Systems Inc announced a powerful new version of its popular Application Visualization System (AVS 1M) that includes a host of enhanced features to help application developers, scientists, engineers, and other business professionals develop graphics-based applications and perform data visualization and analysis.
The fifth release of AVS (AVS5) expands the spectrum of tools used to develop visual computing applications that process and display complex data and images. AVS5 also incorporates significant new imaging and volume rendering features from the SunVision technology that Advanced Visual Systems acquired from Sun Microsystems.
AVS is the leading visual computing software platform, combining advanced data analysis and visualization capabilities to help scientists, engineers, and analysts gain insight from the large volumes of data generated by medical imaging systems, satellite-based sensors, computational simulations, and many other sources.
AVS is increasingly used as a development environment to build applications in areas such as medical imaging, engineering analysis, financial modelling, environmental studies, and oil and gas exploration and production. Application developers can build and deploy AVS-based vertical applications containing the AVS runtime environment.
The new features found in AVS5 include:
A new release of Developers AVS and the AVS Runtime Creation Kit including: support for ANSI-C and C++ modules, direct user interface control for application developers, a new module source code offering, and floating runtime licences.
AVS has been widely accepted by imaging users needing an easily customized, extensible environment for 2D and 3D imaging. With the inclusion of the SunVision imaging technology, AVS5 now contains over 50 modules specifically developed for image processing. The new Image Viewer also provides support for interactive sketching on images, image annotation, and image mensuration.
The SunVision volume rendering tools have been added to AVS along with direct 8-bit volume rendering for very large data sets such as 3D seismic surveys. AVS is now the industry's leading multi-platform application for volume visualization.
The process of data visualization and analysis does not end with a geometric object or image on the screen. Through a combination of new labelling, annotation, and output modules, AVS5 provides the user with a combination of presentation features for printed reports, videos, and slide presentations.
Improved capabilities have been added through new and enhanced modules. In particular, randomly sampled data such as ground water samples or demographic data can be converted to UCD data. This provides access for the environmental science and financial analysis users of AVS to a broad range of visualization techniques.
NOTE: AVS is available for UK Academic Institutes through a CHEST deal. The deal allows a single-site unlimited AVS licences for ALL the platforms supported by AVS Inc. The deal also includes up-dates to the software and therefore will cover the new release of AVS 5. The CHEST price is £4.8K p.a. for 5 years, or £11K for year 1 and then £2.7K p.a. for 4 years.
PostScript is usually interpreted in a laser printer or typesetter but there is frequently a need to preview PostScript files on a screen. This new AGOCG Technical Report (No 20) is an evaluation of six PostScript preview programs. Five are for Unix systems and the other one is for the Apple Macintosh. The five for Unix systems are PostScript Previewer from DEC (part of DEC Windows), PageView from SUN (part of OpenLook), ScriptWorks from Harlequin, Ghostscript (public domain from Aladdin) and RALpage (public domain from RAL). Freedom of the Press was evaluated on the Mac.
Each interpreter was tested with a suite of more than 60 PostScript programs, a mixture of handwritten programs and machine-generated ones. In general, the interpreters were able to interpret and display most of the PostScript programs tested. The report focuses on the differences between the interpreters. The criteria used to assess the interpreters include: speed, robustness, ease of use, ability to render text, at both small and large sizes, colour, graphics and fonts. This article is a very brief summary of the findings.
Freedom of the Press did not perform terribly well. It is designed to convert PostScript files to the native formats for other printers, eg HPGL. Screen preview seems to be considered a minor part of its functionality. Running on a Mac LC it was very slow, although performance on the more powerful Quadra was acceptable. There were quite a few files that it was unable to display correctly, particularly those generated from applications running on the Mac. Colour was not displayed satisfactorily, only 8 colours and dithering being used.
Of those for Unix systems the three commercial interpreters performed better than the two public domain ones. DEC's PostScript Previewer was the best. This is not surprising since it uses code supplied by Adobe Systems, the authors of PostScript and suppliers of the interpreters running in most PostScript printers. It was well integrated into the windowing system and offered more facilities than the other interpreters. For example, the ability to skip to any page, forwards or backwards. The legibility of text at small point sizes was also good.
SUN's Page View V3 was able to display most of the test programs satisfactorily. In some cases PageView did not pause between pages but instead displayed the contents of all the pages on top of each other. This did not happen with properly commented programs, these displayed correctly, but did occur with uncommented, but perfectly legitimate, programs. The legibility of text at small point sizes was not very good.
ScriptWorks is a software RIP (Raster Image Processor) written by Harlequin of Cambridge. It is mainly used by OEMs to drive the recorders in typesetters. As a previewer it is available for Unix systems with the Motif graphical user interface. Most of the test programs were displayed correctly. It performed well, the only significant problem being that the background colour was sometimes yellow rather than white.
Ghostscript was able to display most of the test programs but was let down by its handling of colour. It appears to use whatever colour table is present in the host operating system rather than displaying the specified colours. The legibility of text at small point sizes was not very good and text at large sizes was mediocre.
RALpage was able to display most of the test programs but was slow. The legibility of text at small point sizes was good, but text at large sizes was poor. RALpage did not have the full repertoire of characters normally available in a PostScript font. It could render the standard ASCII set but could not render most of the extra characters above 128, ie accents, ligatures, extra punctuation or other characters.
The full report contains much more information about the performance of each previewer and is available from: Joanne Barradell
Industries world-wide are being forced to consider various ways to reduce product development time and cost. One of the best ways to reduce manufacturing costs is to design parts and products using Design for Manufacturing or Concurrent Engineering techniques. Concurrent Engineering addresses the issue of developing the lowest cost design strategy of a part by concurrently taking into consideration different product life-cycle concerns during the product development process. It also involves design, materials, manufacturing processes and cost, taking into account later-stage considerations such as testability, serviceability, quality, and reliability. This is very important to the manufacturing industry because after a product has been designed and passed from the design stage to the manufacturing stage, it is then too late to make significant changes to reduce life cycle expenditures. When only functional, structural, and machining life-concerns are considered, Concurrent Engineering or Design for Manufacturability entails simultaneous product and process design. To establish this requires that satisfactory manufacturing information should be brought to bear on design decisions at the beginning of the design stages. Thus, it will be extremely beneficial to have a Knowledge Based System (KBS) that can monitor designs as they are created on a CAD System to assess their manufacturability. The KBS will give a predictable machining cost estimation and continuous feed-back to designers about possible manufacturing issues or requirements as the design proceeds.
This research aims at establishing a comprehensive technique for achieving the following objectives:
Most solid modellers available today represent part geometry in terms of low-level geometric and topological entities such as faces, loops, edges, surfaces, curves and points. These modellers do not provide higher level abstractions of the part that relate directly to certain design functions or manufacturing characteristics. Therefore, these sort of systems can't be used directly to derive applications such as machining cost estimation and process planning, etc. This work describes an approach that will be capable of overcoming these deficiencies.
A solid modeller package, Prof ENGINEER has been developed to cooperatively assist designers in creating new applications. These applications can be directly integrated into the Prof ENGINEER environment extracting the necessary topological and geometrical information from the solid modeller during the design stage. Prof DEVELOP, the programmatic interface of the Pro/ENGINEER database, in addition to bespoke software written for the UNIX environment, have been used in accessing the database of Prof ENGINEER. Interface menus have been created to enable users to interact with the system easily and efficiently. This interface includes facilities to create features such as holes, fillets, and drafts, etc.
The KBS Tool (KEE) was chosen as an appropriate tool for building the KBS on a Sparcstation (SUN4). KEE supports frame-based object-oriented programming and rule based reasoning. Each object in KEE is represented as a single frame, called a unit, and each unit is composed of slots. Each slot can contain data or a procedure which describes the characteristics and behaviours of the particular object.
KEE together with Pro/ENGINEER were seen as an ideal medium for achieving the goals of this research. The integrated system is allowing design for manufacturing and cost analysis to be automated and relieving the designer of any additional tasks that otherwise would be created.
The integration of KEE and Pro/ENGINEER has been illustrated in this research. KEE itself does not provide external communication capabilities, but allows complete access to Lucid's Common Lisp language which in turn supports a foreign language interface to communicate with other languages such as C, Fortran and the UNIX Environment. Meanwhile, the KBS has been developed using Common Lisp language programs to interact with the CAD package directly. The KBS captures information about the model features (such as shape and geometry, etc.) and calculates the cost of the features at each stage of the design. Extensive knowledge about the manufacturing facilities and the model features have been represented in a hierarchy tree inside the KBS. Consequently the designer is able to get information about these facets at any level in the hierarchy tree during the design stage.
The complete system enables engineers to improve the quality and reduce the cost of the product. It has also the facility to examine if the designed part can be manufactured in existing manufacturing facilities and provides feedback to designers related to machining concerns that may arise. Moreover it shows a particular context is incorrect if the dimensions of a part are greater than the largest dimension that can be manufactured in the facility assigned to it.
The Atlas Video Facility, already extensively used by UK supercomputing users and SERC grant holders, is now more readily accessible to all UK higher education users. As a result of efforts by the Advisory Group On Computer Graphics (AGOCG), UK academic users may use this powerful facility for the production of video output from computer data. At the same time, the facility itself is being enhanced with specialized 3D systems and network hardware.
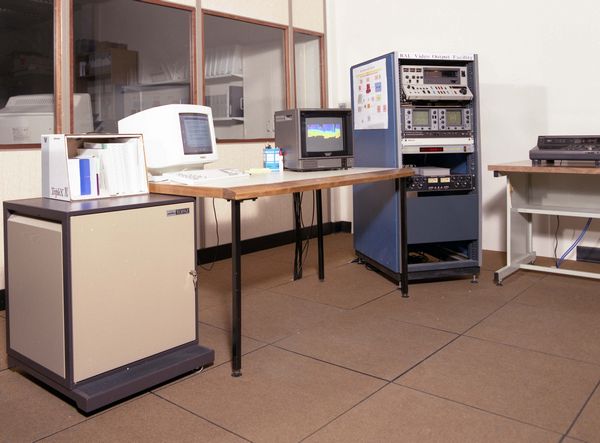
The Atlas Video Facility, located at the Rutherford Appleton Laboratory, is a sophisticated system for the production of video animation sequences. Originally designed in 1987 and enhanced in 1989 its main components are Abekas A60 video disk (holding 750 video frames, or 30 seconds at full speed playback) and a powerful Primagraphics processor. User input files are processed to produce pictures in a framestore which are recorded onto the Abekas disk. When the disk is full, or the job is complete, the sequence is recorded from the Abekas to U-Matic videotape. Typically a couple of VHS copies are made from this master.
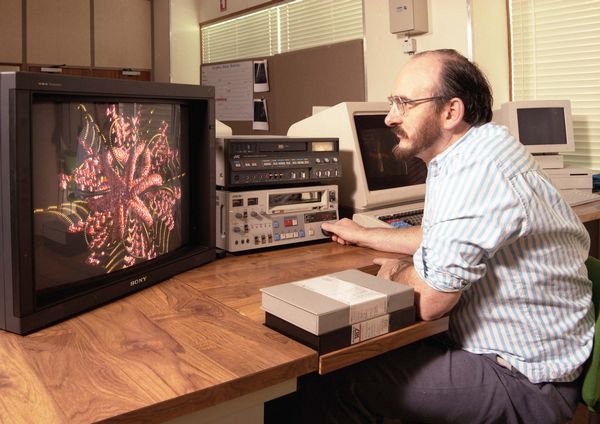
It has produced video sequences for oceanographers, atmospheric physicists, engineers, ecological modellers and laser scientists, amongst many others. The shortest sequences have lasted about 30 seconds and the longest about 53 minutes. Sequences produced by the facility have been shown at many conferences and have been seen on all UK broadcast channels and also on educational channels abroad.
The Universities Funding Council (UFC) have provided funds through AGOCG for a pilot scheme which is for a limited period (around three months) and a limited amount of facility time (around 80 hours). These resources are available to non-SERC, non-supercomputing, UK academic users.
The UFC wishes to encourage UK academic users to try their applications on the Atlas Video Facility. For some users this pilot scheme will allow them to see whether video is a suitable medium for their requirements; others should be able to make a complete video within the time scale of the pilot scheme.
When the pilot scheme ends, users funded by the UFC will continue to have access to the facility at special academic rates.
Use of the facility is accounted in terms of three factors:
Access conditions for supercomputing users and SERC users remains unchanged.
Several different input methods are supported and these are documented in a User Guide that is being prepared. This guide deals both with data formats (CGM, raster, RLE, etc..) and the use of media (network, QIC, Exabyte, etc..). Atlas staff can provide advice on style and content, which can make the difference between a video being watchable or boring. A Style Guide is being prepared, based on the experience of previous users. The completion of the documentation is another aspect of the pilot scheme funded by the UFC.

The hardware of the Atlas Video Facility has just been extended with an extra Primagraphics processor that incorporates Silicon Graphics Elan graphics boards, hardware JPEG compression, F001 network access and extensive memory. The Elan graphics board allows the facility to start from 30 data rather than its present 20 input and to provide high speed rendering of 30 images from scene descriptions. The JPEG and F001 boards enable the possibility of previewing video sequences over computer networks such as JIPS and its SuperJANET successor.
In addition, codecs have been purchased to allow video output from the whole system (Primagraphics, Abekas, Silicon Graphics, videotape and cameras) to be networked over 2 Mbit/ second circuits. These will allow debugging of video sequences from any of these sources over SuperJANET, when the appropriate speed connections are available at each site.
Visualization has been identified as one of the key areas of the SERC Engineering Applications IT Support Programme (EASE) over the next few years. Community Club's are an effective and successful mechanism within EASE for bringing together researchers with a common interest (frequently from different subject disciplines within the engineering community). These Clubs are not limited to either engineers or academics which gives the members access to a broad range of experience. It was therefore a natural step to establish an EASE Community Club in Visualization, which happened during the summer of 1991.
The role of the Visualization Community Club is to help researchers, developers and users interested in visualization by:
The Club's Steering Group forms a regular point of contact between the community and EASE technical staff at Rutherford Appleton Laboratory (RAL). It is an essential link between the two, representing the views of the larger user community, and transmitting the results of the programme back to the community. The Chairman of the Visualization Community Club Steering Group is Dr K W Brodlie (Leeds University) and the Secretary is Mrs R Popovic (RAL).
The Club has organised five events so far and is planning to organise a further four events this year: 3D Visualization in Engineering Research, Visualization in Engineering Teaching, Visualization in Electromechanical Engineering and Parallelism and Visualization. There are also a number of technical activities on-going at RAL in support of visualization for engineering researchers:
More information on the Club's recent activities and its future plans can be found in the Visualization Community Club Annual Report.

SGML (the Standard Generalized Markup Language) is an internationally agreed standard for information representation. SGML can be used for publishing in the broadest sense - everything from conventional publishing on paper, to on-line, multimedia database publishing. SGML can be used to produce files which can be read by people, yet exchanged between machines and applications in a straightforward manner.
The SGML Project has been funded by the Information Systems Committee of the UFC to provide a comprehensive information and advice service on SGML, its uses, software and related standards. We offer a programme of lectures, seminars and workshops that is entirely free to any recognised academic or research institution. We are also happy to talk with individuals and groups to discuss how SGML might be of use to them.
Although SGML was first published as an International Standard in 1986 (ISO 8879), it is still new to many people. The de facto bible for the language is The SGML Handbook, written by the editor of the standard, Dr. Charles F. Goldfarb (Oxford University Press, 1990). However, articles on SGML have appeared in several journals and magazines, and a good place to find out more about what SGML enables you to do is the June 1992 edition of Byte magazine.
SGML is also beginning to. cause a stir in the multimedia/hypermedia world, because it enables the complex information structures that characterise such documents to be exchanged between machines and applications in an unambiguous manner. A particular application of SGML has been developed for this purpose, called HyTime, which has been published by the ISO as an International Standard (ISO 10744).
As developers gradually build HyTime-awareness into their multimedia/hypermedia products, it will become possible to export as a HyTime document any sophisticated document created in one authoring package, and then import it into another authoring/ display system. HyTime is still so new that, apart from the Standard, very little has actually been published about it. An article by Newcomb, Kipp and Newcomb, The HyTime Hypermedia/Timebased Document Structuring Language appeared in Communications of the ACM, November 1991, and although it no longer reflects the contents of the Standard with absolute accuracy, it still gives a flavour of what HyTime is all about.
If the SGML Project receives funding for the financial year 1993/1994, we intend to set up and run an SGML software evaluation Workgroup on behalf of the Inter-University Software Committee (IUSC). The deliverables from this Workgroup will include a major public report, and a set of purchasing proposals to be put before CHEST. To ensure that the evaluations will take into account the needs of as many members of the academic community as possible, we shall be actively soliciting involvement from members drawn from all areas. Appropriate open invitations will be made nearer the time, but if any readers would like to express initial interest, and/or would like to find out more about SGML or HyTime, please feel free to contact me.
It is a while since there was an update on graphics standards in the Newsletter. Here, I will concentrate on the activities in the application programmer interface area in 1992 and say something of the likely developments in 1993. There were two major standards completed in 1992, PHIGS PLUS (ISO/IEC 9592-4: 1992) and the Computer Graphics Reference Model (ISO/IEC 11072: 1992). Developments in data interchange standards will be covered in a future article.
PHIGS PLUS (standing for Plus Lumiere und Surfaces!) provides additional PHIGS primitives to allow surfaces and non-uniform Bspline curves to be defined by a single or small number of primitives. In addition, much more control is provided over the rendering of output primitives. Light sources of various types can be specified and these help to create a more realistic view of a 3D image than is possible in PHIGS itself. To aid in the use of pseudo-colour to represent values of variables, such as pressure, it is possible to associate data with individual points on a primitive. Much better control of colour is provided than in PHIGS by the addition of direct specification of colour values. PHIGS PLUS functionality has been added to a number of the PHIGS implementations as the standard has been developed. In consequence, some of this functionality does not quite conform to the final version. Most vendors are committed to upgrading their implementations to the final standard.
The Computer Graphics Reference Model (CGRM) was started many years ago when it became apparent that the various standards being developed were beginning to drift apart in their use of terms, their underlying model of computer graphics and the area that was sensible to be bound up in a single standard. For my sins, I chaired the initial meeting up a mountain near Seattle in 1985. The aim of the activity was to produce a framework for the next generation of standards that was anticipated after PHIGS was completed. With GKS reaching its expiry date, there would be a need to review its future also.
Progress has been quite slow, for a standard of such a modest size! It works out at about 3 pages per year! The problem has been that getting the CGRM right was crucial to future developments and there was a need to see if the descriptive techniques currently being used would be of value in the future. A particular problem was the tendency to specify graphics mainly by the flow of primitives from application to device tracing the coordinate transformations applied. This was less useful in describing storage systems, meta files and the inter-relationship between input and output. The final CGRM has a balance between descriptions based on data and processing.
The other major concern was its size with the Europeans much more in favour of a short document which spelt out rules that were always true and the USA position that all components that might be used by any standard should be included. The European view prevailed and, in consequence, the CGRM is a short and succinct document. The aim is that all future standards must show how they conform to the CGRM which leads us nicely into the future. The extended CGRM proposed by ANSI was eventually subsumed in the PREMO work to be discussed later.
In April 1991, I gave a description of progress so far in Issue No 16 of the Newsletter. Progress since then has been relatively fast with the new GKS going from Committee Draft to an anticipated Draft International Standard later this year. As reported earlier, the major concerns were to provide upward compatibility with the existing GKS while achieving a better interface to CGM. The last year has been spent ensuring that almost all GKS programs will continue to run. With much cleaner concepts in defining the NDC picture and primitives having namesets as a major control attribute, there has been significant work in defining the segment facilities based on namesets and achieving stringent compatibility in other areas. This has resulted in the need to enhance the already impressive functionality associated with the NDC picture and most people involved in the project are looking forward to the new facilities.
Once compatibility was established, there has been an effort to improve the base functionality in terms of output primitives and composite input devices. Implementations of parts of the system have been produced which show that despite the increased functionality the system can perform efficiently. One of the main UK inputs has been the introduction of a new class of primitives based on the extrusion of a pattern through a shape. By allowing recursive definition of such primitives (the pattern can be defined in terms of existing primitives), many of the requirements of presentation graphics, cartography and other demanding areas are satisfied by the new GKS.
The current interest in the Object-Oriented paradigm has resulted in the need for a graphics standard that can interwork with O-O applications. Such a standard would consist of a set of objects or components from which could be chosen the set necessary for a specific application. This has some similarity with the work proposed for the extended CGRM. In consequence, these two activities have been amalgamated. The PREMO standard hopes to develop a hierarchical set of components that can be used or modified to handle graphics in an 0-0 application. The work is in an early stage of development and it will be a while before any concrete results arise from this activity.
Image processing is an area that is long overdue for standardisation. Imaging and its relationship to computer graphics was defined in the CGRM and an effort is now in progress to produce an image processing standard. What started as a modest activity has now turned into at least three separate but related activities. As there is both an Application Programmer Interface and Data Exchange requirement, the first three parts of the standard being proposed are a Common Architecture for Imaging, The Programmer's Imaging Kernel System (IPI-PIKS), and The Image Interchange Facility (IPI-IIF). The architecture document is about 50 pages in length and gives a framework for the other activities. Unfortunately, image processing is not a very green activity and in consequence the Committee Draft for the IPI-PIKS has already reached 850 pages in length! As the time to process standards seems to vary as the square of the page count and the quality is inversely proportional to the page count, I wonder whether this standard will ever be produced and, if produced, whether it will be used.
The main conclusion is that there is still a lot of work in progress in the standards area. Also, the GKS review has made people aware that, as in other areas, the graphics community now has to start a maintenance activity as well as the development of new products. I have only given a flavour of the activities in process. The various standards have a common registration scheme for linetypes, patterns etc and work is progressing in defining these. There is a global activity in attempting to define a set of base data types common across all areas of IT, the languages area is trying to define some common procedures for defining language bindings, the office automation area and computer graphics are both interested in multimedia, etc. A real standards junky could spend his whole year attending standards meeting and, even then, would only cover part of the field!
AGOCG has for some time been conscious of a need to provide training in graphics and visualization to a broad range of researchers in higher education. Thus for a week in January, an intensive short course was mounted, aimed at new postgraduate students of any discipline, and from any university, who might be able to exploit visualization in their research work. The course, held at the University of Leeds, was a mixture of education and training - the students learned about the techniques of graphics and visualization through a series of lectures; and they gained practical experience in the leading visualization software packages through practical sessions in the School of Computer Studies' Silicon Graphics Laboratory, with 20 Indigo workstations.
Some 31 students attended the course - coming as anticipated from a variety of disciplines (from Anatomy to Chemical Engineering, and from Geography to Genetics). This was the maximum number we could take, and unfortunately a number of further applications had to be turned down. An important factor was the recognition by SERC of the course, meaning that SERC-supported students had their course fees paid. (11 SERC students attended') The lecturers were Ken Brodlie (University of Leeds), Terry Hewitt (University of Manchester) and Phil Willis (University of Bath). A total of eight demonstrators helped during the week (three from SERC (RAL), two from AFRC, two from University of Manchester and one from University of Leeds).
The course fell into three main parts: first, an introduction to visualization where students learned how to turn information into pictures; second, an explanation of some fundamentals of graphics - colour, modelling and rendering - which are important for visualization; third, an introduction to advanced visualization including volume visualization and flow visualization.
There was a very high practical element associated with each part. Students used UNIRAS software for simple visualization and AVS for advanced visualization. For the graphics part, students worked through examples based on Iris Inventor. The particular software chosen for the practical work meant that no programming was required at any time!
The practical visualization work was based around two challenges in which the students were given problems to solve. This was done competitively in groups of four, with the second challenge culminating in the production of a short video of a volume and flow visualization.
On one evening, there was a demonstration of remote visualization when a distributed AVS application was shown, with some modules running at Manchester Computer Centre and some at Leeds.
The students were provided with a large set of course notes, and each will receive a copy of a composite video showing each team's effort on the visualization challenge.
It was a hectic week for all concerned - both students and course leaders. There were no free evenings! At the start of the week the students looked dubious when it was suggested an aim was to produce a SciVis video by the end of the week. That each group not only produced a video, but a good one at that, is a tribute to the attitude which they all showed throughout the week.
Thanks are due to many people for the part they played: to Anne Mumford for handling all the registrations and enquiries; to SERC, AFRC, and the Universities of Leeds, Bath and Manchester for supplying lecturers and demonstrators; to colleagues at Leeds (Tim David and Alan Haigh) for setting a challenge and assisting with the video production; to the University of Manchester for production of course materials; and to the School of Computer Studies at the University of Leeds for hosting the course.
Now that we have all recovered, thoughts are turning to the idea of repeating the course next year!
