
A 30 track magnetic recording unit with a capacity of 2048 30 digit numbers is being built at T.R.E.. The unit is to be used in a parallel system computer so that all tracks are used simultaneously. Longitudinal magnetisation is used with ring type heads spaced away from a continuously running drum which is coated with a Ferric Oxide having suitable magnetic characteristics.
The spacing of the magnetic cells which represent digits is 160 digits per inch along each track; transversely tracks have been successfully spaced at 50 per inch with only 30 DB of crosstalk. The overall density is therefore 8000 digits per square inch.
2.1. The signal to be recorded consists of a sequence of 10 micro-second positive or negative pulses spaced 10 micro-second apart. This signal is polarised and to reproduce it accurately, it would be necessary to retain the D.C. component throughout the recording reproducing chain. Fig.1.
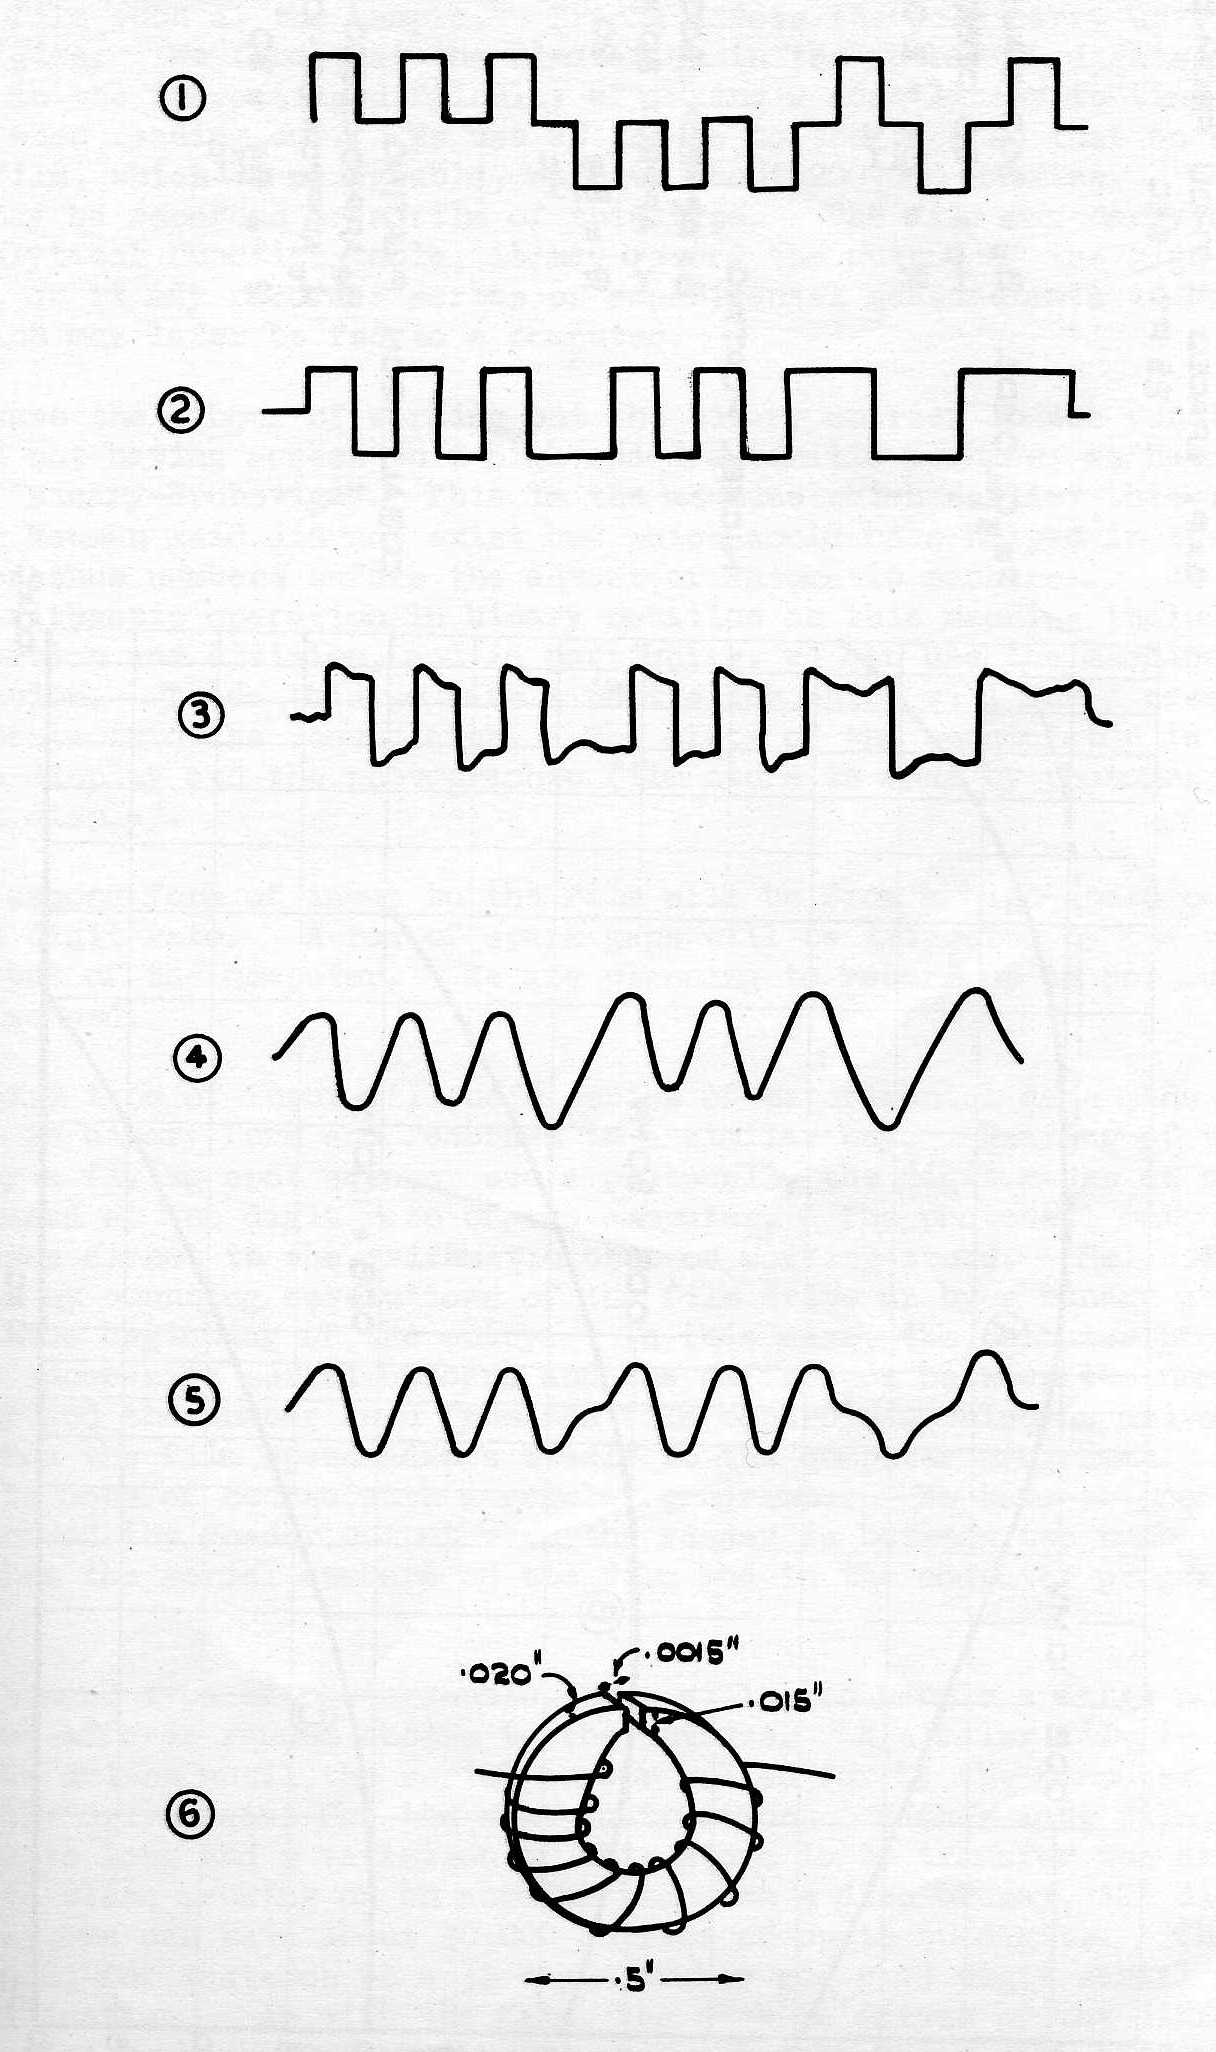
2.2. To simplify the recording problem the waveform is converted to a balanced square wave. (Fig.2). This is done by applying the waveform of Fig.1 to a trigger circuit which only changes its state when the input current changes direction. Thus, if a positive pulse is followed by a negative pulse the trigger circuit does not trip - the current direction being the same at the end of a positive pulse as at the beginning of a negative pulse.
2.3. A series of positive or negative pulses both produce a 50 Kilocycle (10 µ.sec.) square wave, but of opposite polarity. Alternate positive and negative pulses produce a 25 KC (20 µ.sec) square wave.
2.4 The recording heads must be fed from a constant current source. A convenient method is to feed the, balanced square wave to the grid of a pentode with an unbiased cathode resistor to give current feedback. The output of the pentode is transformer coupled to the recording head. The actual current waveform in the head is shown in Fig.3 and Fig.10.
3.1. Each head consists of a ½ inch washer of Mu-metal 13 to 20 thou. thick, wound toroidally with 50 turns of 36 S.W.G. enamelled wire. The recording gap is 1.5 thou. wide and 15 thou. deep.
Fig.6: Impedance of the head is 6 ohms at 50 KC, DC resistance, .6w. The overall thickness of the head including the winding and insulation is 40 thou.
3.2. Each head feeds, or is fed from, a 50:1 transformer which transforms the input or output impedance to 15 K.
4.1. The drum is 4 inches in diameter and is driven at 1500 rpm. directly from a single phase synchronous motor. Eccentricity is of the order of ± .25 thou. in the present model, but it is hoped to improve this later.
4.2 The drum surface is coated with a ½ thou. layer of magnetic iron oxide (Fe3O4). Remanence 300 Gauss, Coercivity 150 Oersteds, (See later notes for details of alternative coatings and platings).
4.3. The recording - reproducing heads have their working gaps spaced approx. 1 thou. from the drum surface so that the drum may run continuously with no wear of heads or recording surface. Due to spreading of the magnetic field in the vicinity of the recording gap the effective gap is wider than the 1.5 thou. physical gap and is probably of the order of 2 to 3 thou.
4.4. Due to the high coercivity of the recording medium weak fields do not record at all, for this reason the effective recording gap is appreciably narrower than the same gap as used for reproducing.
5.1. Section 2.3 of this report shows that the recorded signal consists of a mixture of 25 and 50 KC waveforms. It is therefore necessary to keep the frequency response and phase shift constant within reasonable limits from 20 to 70 KC. Output may conveniently fall outside this range in the interest of improved signal to noise ratio.
5.2. Several factors combined to fix the overall frequency response and it is instructive to examine them separately.
5.3. Given a perfect recording medium and infinitely narrow recording and reproducing slits - a constant current recording would result in a playback response rising 6 DB per octave. This is due to the fact that the voltage induced in the playback head is proportional to rate of change of flux, For constant magnetization at all frequencies doubling the frequency would double the rate of change of flux and so increase the output voltage by 6 DB.
5.4. In any practical recording medium the mutual demagnetisation of short adjacent magnets modifies the 6 DB per octave response, and over a range of about two Octaves the response is sensibly level, beyond this the response falls as the recorded wavelength becomes shorter. Eventually as the wavelength approaches the dimension of the scanning slit the response falls off still more quickly until the first zero is reached where the wavelength is equal to the scanning slit.
5.5. If Fo equals the frequency where λ = slit width i.e. (medium velocity in inches per sec. / Slit width in inches).
The loss in DB due to the slit loss at any other lower frequency F is given by the formula.
DB loss = 20 Log10 { sin(F/Fo) / (F/Fo) }
For the system being described the loss at 50KC with a 2 thou. scanning slit = 2.7DB, and for a 3 thou. scanning slit = 3.5 DB. If the recording slit losses were the same as the playback slit losses these losses would have to be doubled to give the overall recording - reproducing response. In fact due to the effective narrowing of the recording gap width on high coercivity recording mediums (see Sect. 4.4) the actual loss is slightly lower; approx, 4 DB for 2 thou. gap and 6 DB for 3 thou gap.
6.1, Section 5.4 above, mentions the turnover in the frequency response due to demagnetisation. The wavelength at which this occurs depends on R the ratio of the Remanence of the magnetic coating to its Coercivity. As the Coercivity can not by definition be higher than the Remanence, the lower limit for R = 1. Most of the Ferrous, Ferric, or Ferroso Ferric Oxides developed for tape recording have an R of 1.5 to 2.0 with Remanence in the range 200 - 800 Gauss and Coercivity in the range 150 - 400 Oersteds.
6.2. Fig.7A. shows the frequency response of the oxide coated drum and heads described in section (4) of this report. The dotted curve shows the response of the oxide layer as measured with a very narrow (.25 thou) gap in contact with the layer, at one tenth of the linear speed. It will be seen that the losses are due almost entirely to the width of the scanning gap. Changing from one oxide coating to another does not vary the frequency response appreciably - but the playback levels vary in proportion to the Remanence of the coatings.
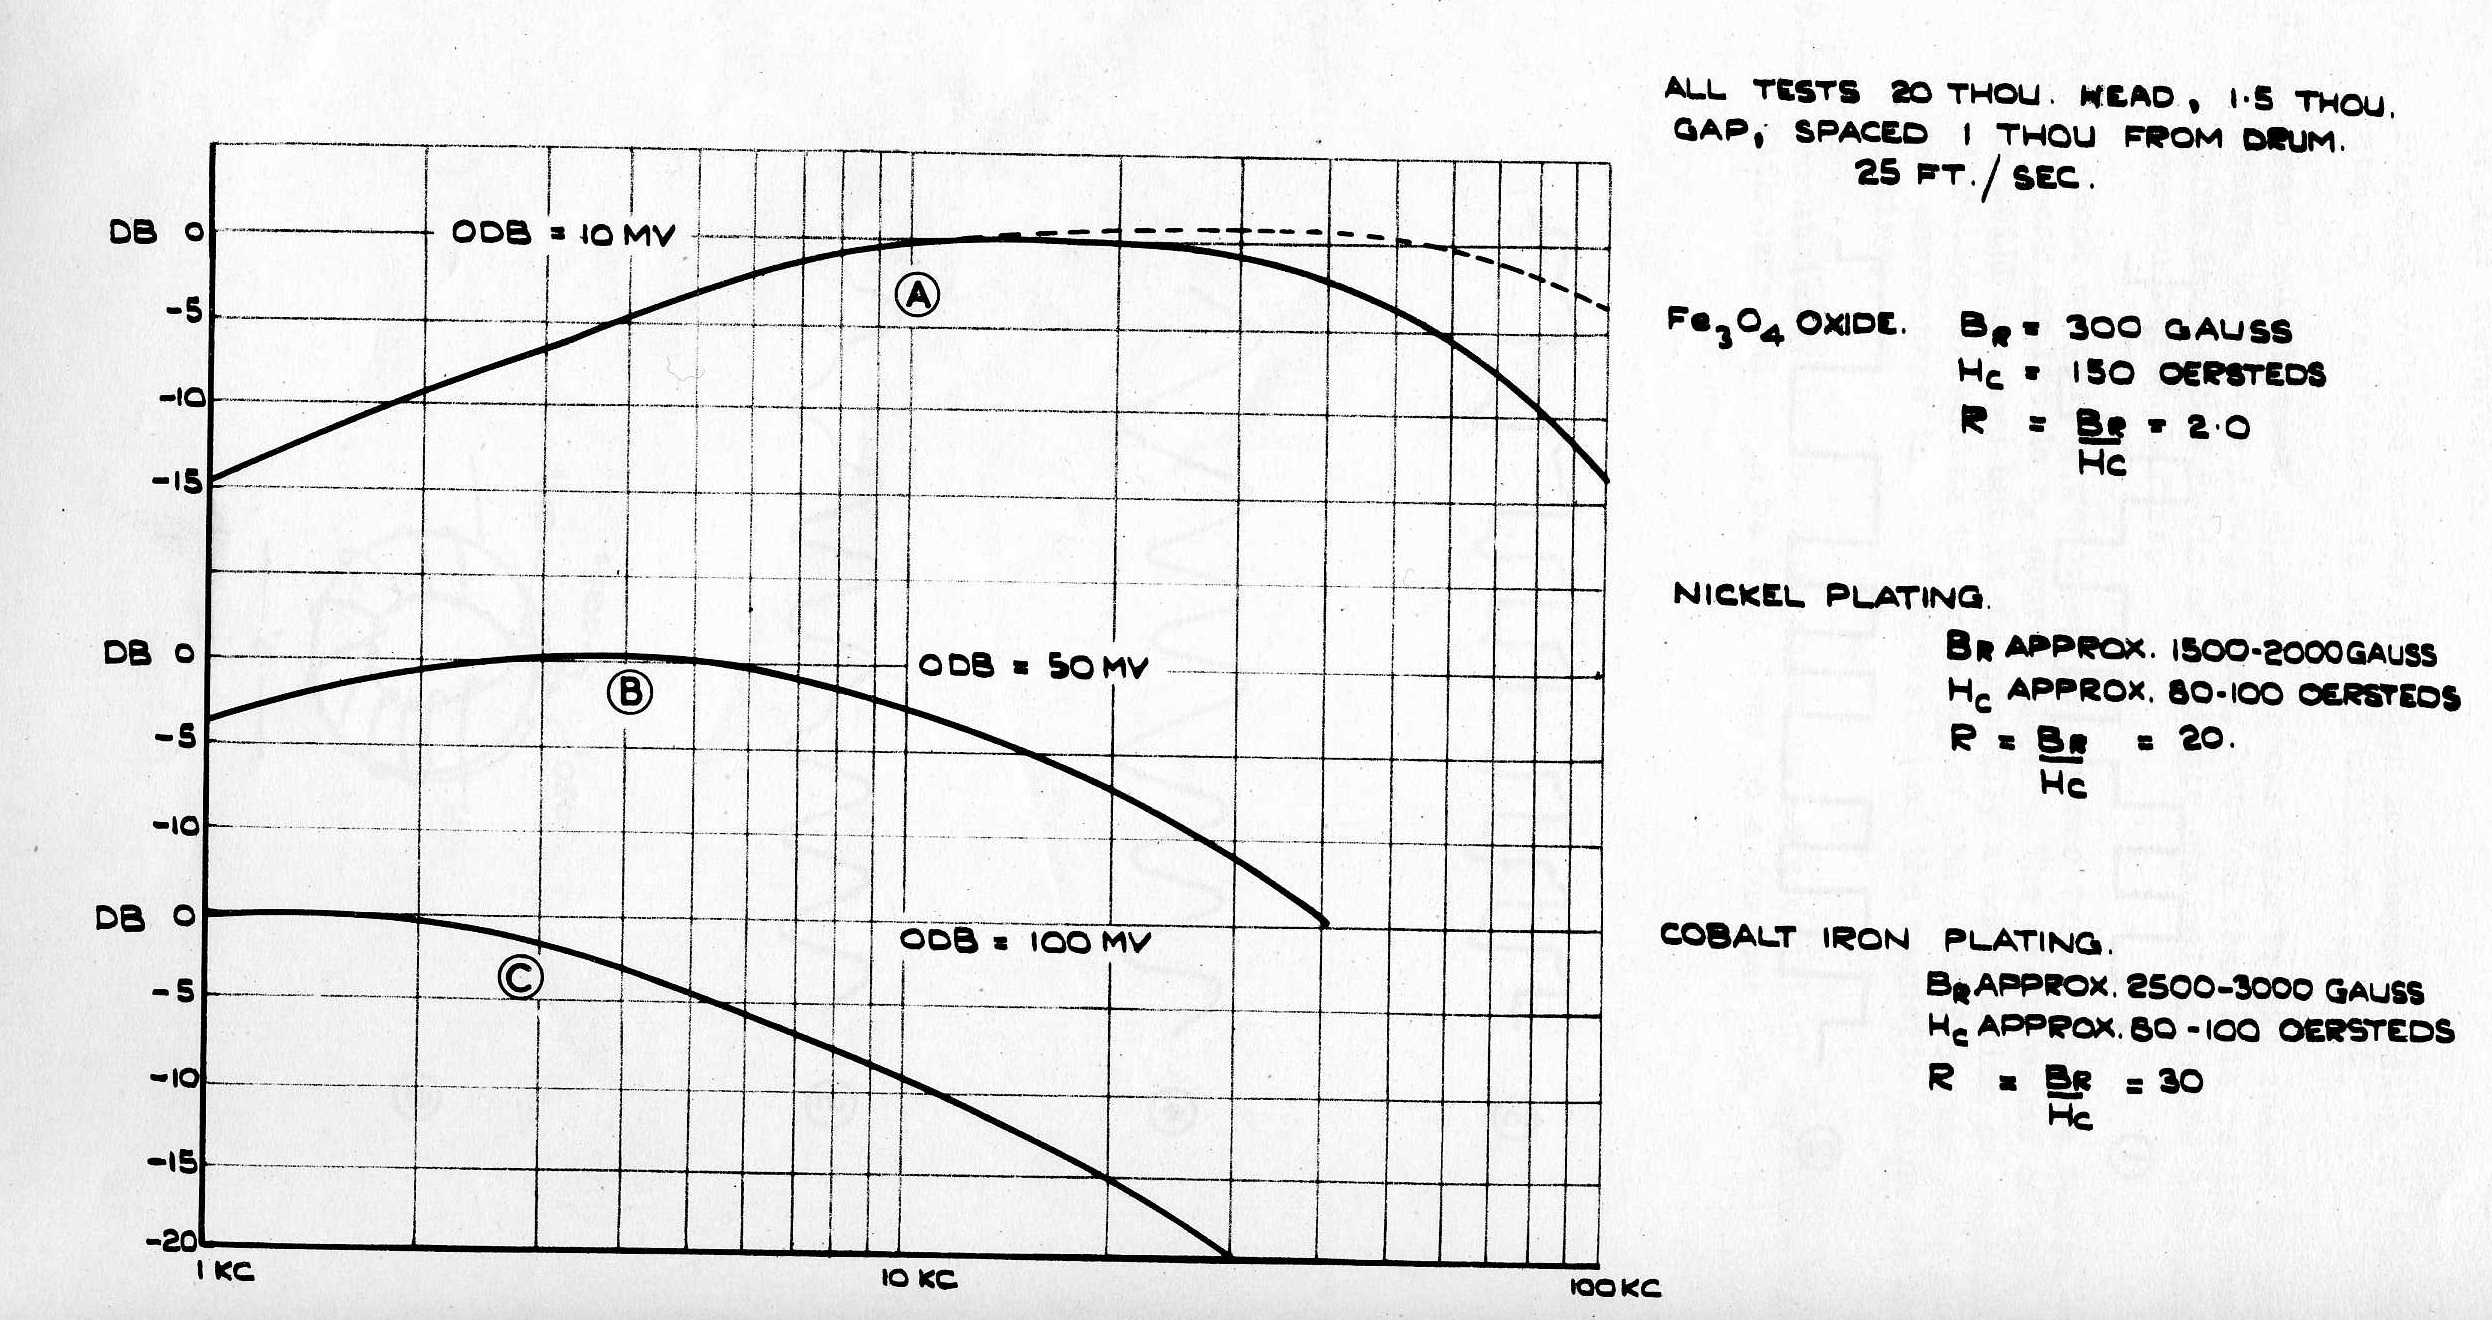
6.3. Fig.7B. shows the frequency response of a nickel plated drum, tested under identical conditions. R is approx. 20 so that demagnetization losses are severe at 50 KC. Output at low frequencies is higher than that of the oxide due to the very much higher Remanence.
6.4. Fig. 7C shows the response of a Cobalt Iron plating with a still higher Remanence, and low frequency output, but with an R of approx. 30. There is little useful output above 30KC.
7.1. The wide band signal to noise ratios of the oxide coatings lie within the range 25 to 35 DB below saturation recording level.
7.2. The plated drums give a wide band signal to noise ratio of only 10 to 20 DB. Host of the noise is at low frequency, due to uneven stresses in the plated layer. A useful output, clear of noise, may be obtained by limiting the response below 10KC in the playback chain.
8.1. In speech or music recording it is standard practice to bias the recording medium to achieve a linear amplitude recording characteristic. For this application saturation recording is used at all times and providing the input signal is sufficiently strong to run the magnetic material to saturation on each half cycle, it does not seem to matter where on the B-H loop the cycle starts.
8.2. Background noise is probably slightly lower if the material is brought to a magnetically neutral state by applying HF to the heads and turning the drum relatively slowly, but simple saturation from a strong DC field is almost equally effective and only brings up low frequency noise components due to uneven coating. The low frequency response of the playback amplifier is normally curtailed to eliminate mains hum etc, so that no special precautions need be taken in erasing a drum.
9.1. Fig.4 shows the wide range open circuit voltage across the playback head from a recording of the waveform shown in Fig.3. This shows adequate signal to noise ratio, but the gap loss shows up as a 4 to 6 DB difference in level between the two component frequencies. A simple CR correction circuit in the playback amplifier compensates for the scanning loss giving the waveform shown in Fig.5. This waveform contains all the necessary information to recreate the original Fig.1. waveform, when strobed by a 50KC clock waveform derived from a master track on the same drum.
9.2. Saturation recording is obtained for a peak current in the recording head of 200 to 250 ma. i.e., 4 - 5 ma at the high impedance winding of 50:1 transformer.
9.3. Playback voltage across the high impedance winding of the 50:1 step up transformer is 10 - 15 milli volts peak.
9.4. Gross talk between adjacent tracks with tracks spaced 25 thou. centre to centre i.e., 5 thou. between tracks is better than 40 DB which is the S/N ratio of a single channel with the corrected reproducing amplifier.
9.5. A block of pulses recorded on any one track shows a random variation of peak amplitude of approx. 10%. The exact cause of this flutter is still unknown but it is probably a combination of mechanical vibration affecting the spacing of the head from the drum surface, and unevenness in the dispersion of the magnetic oxide in the drum coating.
9.6. Eccentricity in the drum shows up as a cyclical amplitude variation. With care this can be kept down to a further 10%.
