This year has seen the successful completion of EVEREST, a four year EC-funded Esprit project to investigate and develop physical and mathematical models for the three-dimensional (3-D) simulation of silicon-based semiconductor devices. RAL was the lead partner. The project brought together three of the major European industrial device manufacturers with experts in mathematical modelling and software development. Besides RAL, partners in the project were Philips, STC Technology, SGS- Thompson, IMEC, NMRC, Analogue Devices, Trinity College Dublin, University College Swansea and the University of Bologna.
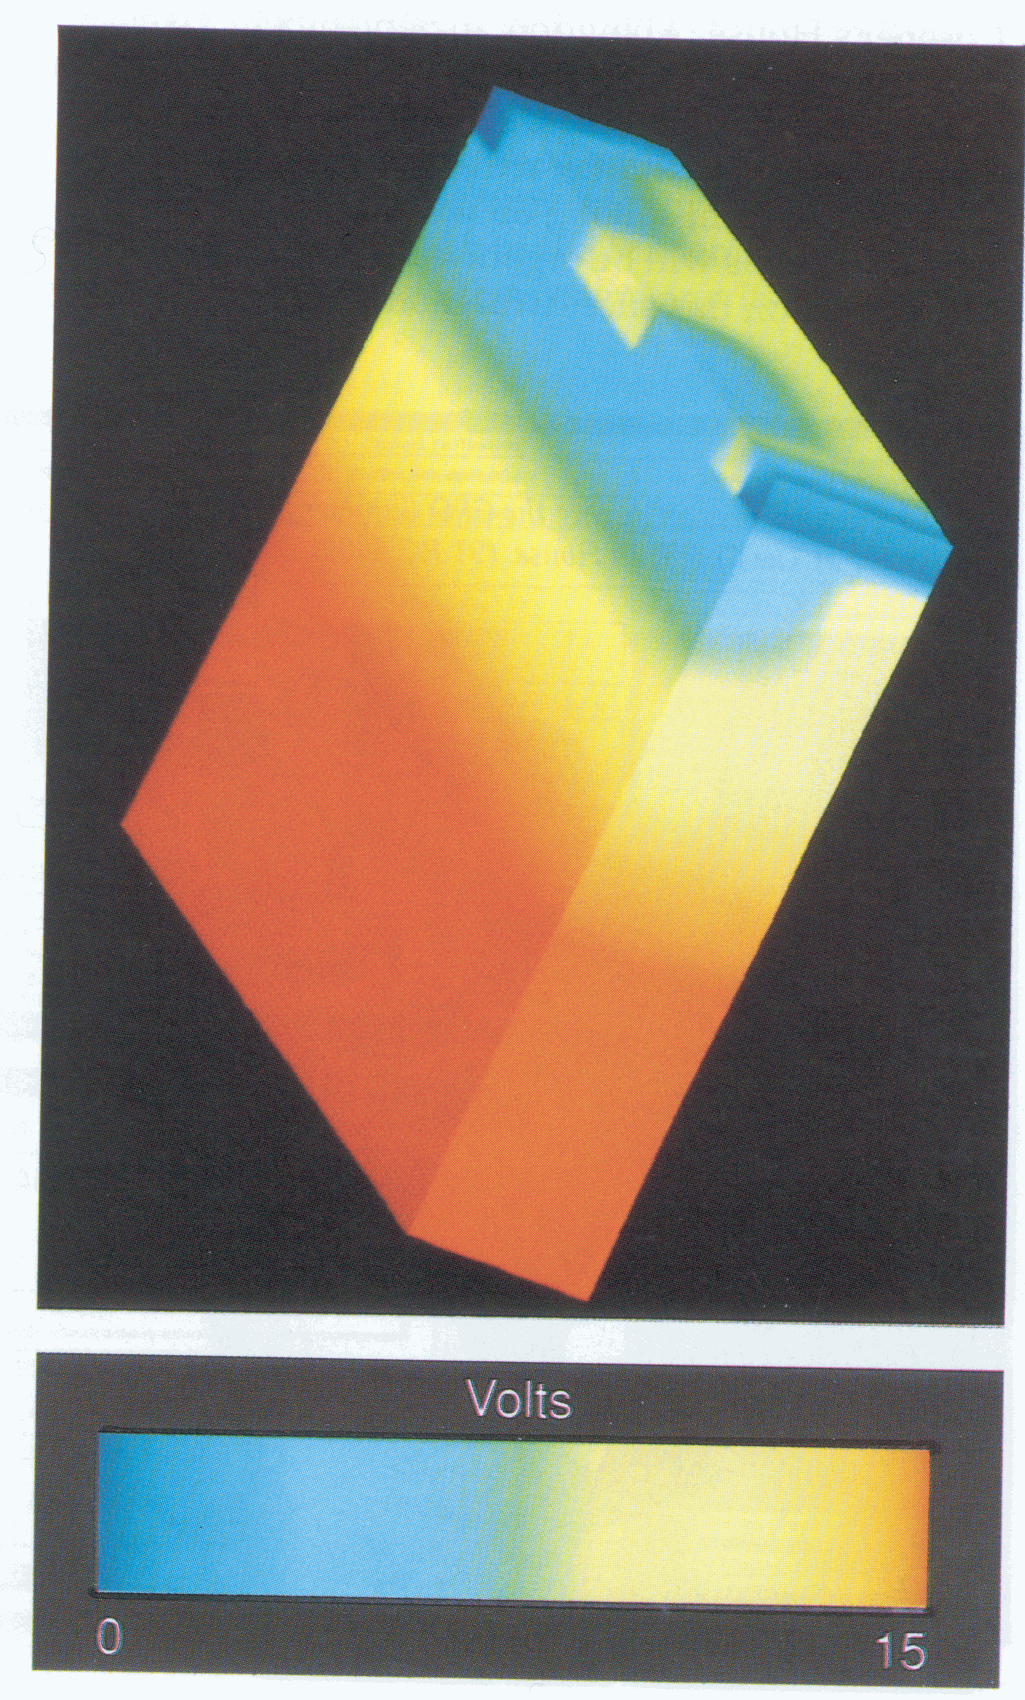
The project has significantly improved understanding of the physical models used to describe the electrical behaviour of devices and has developed a full 3-D simulator which can perform both transient and steady-state device analysis. A major advance made by the project was in the use of adaptive meshing techniques during the solution process. As computation proceeds, the EVEREST simulator estimates the error in the solution and enriches the finite element mesh used in areas where this error is large. This type of adaptive solution process is essential for cost-effective 3-D simulation. During the project the simulator was tested and evaluated by the industrial partners by simulating the electrical behaviour of complex device structures such as the charge-coupled devices (CCDs) used in video cameras (Fig 2.1). In these simulations the 3-D capability of EVEREST has been essential to understand the operation and to optimise the performance of these types of device. On completion EVEREST was one of only four 3-D simulators available world-wide and, although others are now appearing, it still ranks as one of the most advanced.
RAL has exploited the results of the EVEREST project by making the simulator available to the UK academic and industrial community, with support from the SERC/DTI IT programme. The EVEREST software has so far been distributed to ten institutions within the UK. Development of EVEREST is continuing, to extend the range of device structures it can simulate and to incorporate state-of-the-art visualisation tools to help users gain insight into the results of the simulations.
Computational fluid dynamics (CFD) is used in almost all application areas supported by the Engineering Board. Following an extensive review of the Board's activities in CFD, it was decided to establish a single focus for computing support in this area. In 1990, a CFD Community Club was established as part of the computing infrastructure programme supported by the Board. The membership of this club has grown rapidly to about 500. The objectives of the club are to provide a forum in which to present and discuss research interests of the CFD community; to increase awareness of advanced computing techniques in the community; to propose new activities to encourage use of advanced computing techniques in CFD research; and to promote the exchange of CFD software and data throughout the community.
These objectives have been promoted by a programme of meetings and technical developments directed by a small steering group of senior academics and industrialists. As a result, prototype libraries of freely available CFD software and experimental data have been released to the UK community, and commercial CFD software has been provided on the central computers at RAL for use by grant holders.
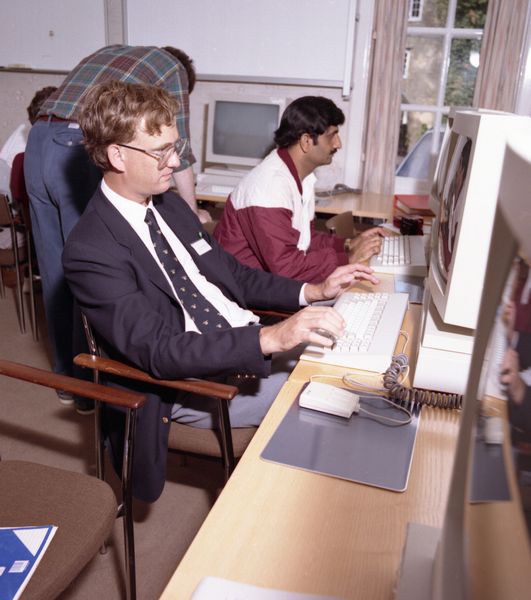
A highlight of the year was the CFD Summer School held jointly with the European Research Consortium on Flow, Turbulence and Combustion at The Cosener's House, Abingdon, in September. Twenty participants from the UK and overseas were given an intensive course on basic CFD methods combining formal lectures with interactive tutorial sessions and practical problem solving on workstations (Fig 2.2). Further schools will be organised by the Community Club based on this successful model.
Technical meetings organised by the Club on the topics of visualisation, accuracy in numerical modelling, mesh generation, software validation and turbulence modelling were well attended and generated lively and informed discussion. The steering group is developing an equally stimulating programme for the coming year.
Computer scientists and users have long cherished the goal of a programming language which runs efficiently on all computers. Fortran was the first high level language and one of the earliest for which good compilers existed for a standardised language across a wide range of machines. Fortran also now serves as a medium of exchange, and has become the dominant language for scientific and engineering programming.
The advent of commercially-available vector and parallel machines from the mid-1970s onwards posed new challenges for compiler writers to exploit effectively the architectures and capabilities of these machines. Initially non-standard extensions to Fortran, in the form of compiler directives, were a necessary expedient and portability was lost. In the last five years or so research on automatic analysis and transformation techniques has matured rapidly. Good compilers for standard Fortran 77 are now available for vector machines and for parallel machines based on a shared memory architecture.
The BRIM project, named after its partners Brunel, RAL, Intercept and Meiko, seeks to extend this to parallel machines based on a distributed memory architecture, such as transputer-based systems and hypercubes. A major objective of BRIM is to design and develop techniques for Fortran compilation that are scalable to larger numbers of processors, thus capitalising on the characteristic advantage of distributed memory systems over other parallel machines.
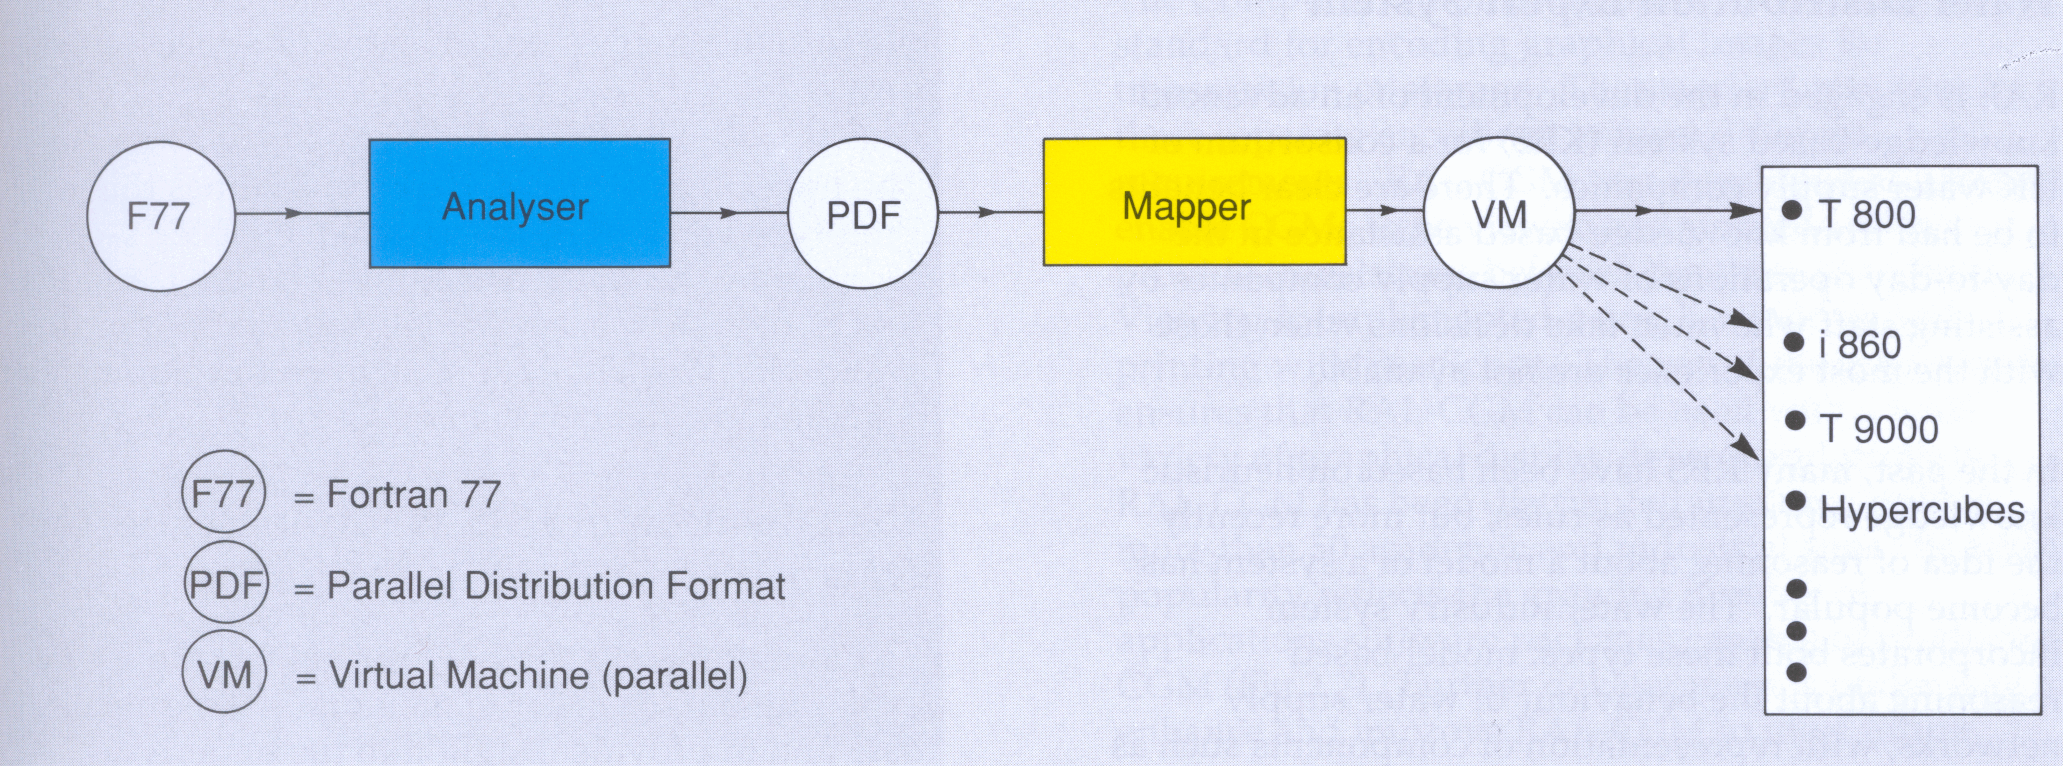
Fig 2.3 shows the overall structure of the BRIM compiler. The input is standard Fortran 77. The heart of the design is the use of an intermediate language, parallel distribution format (PDF). PDF serves as an interface between the analyser, which recognises opportunities for parallelism in the source, and the mapper, which generates code for the target parallel system. For portability the mapper is designed to produce code for a parallel virtual machine capable of efficient realisation across a range of physical machines, including systems using transputers and i860 processors. The initial implementation is planned for T800 transputer systems. The project is on the point of testing its design and techniques on real Fortran programs.
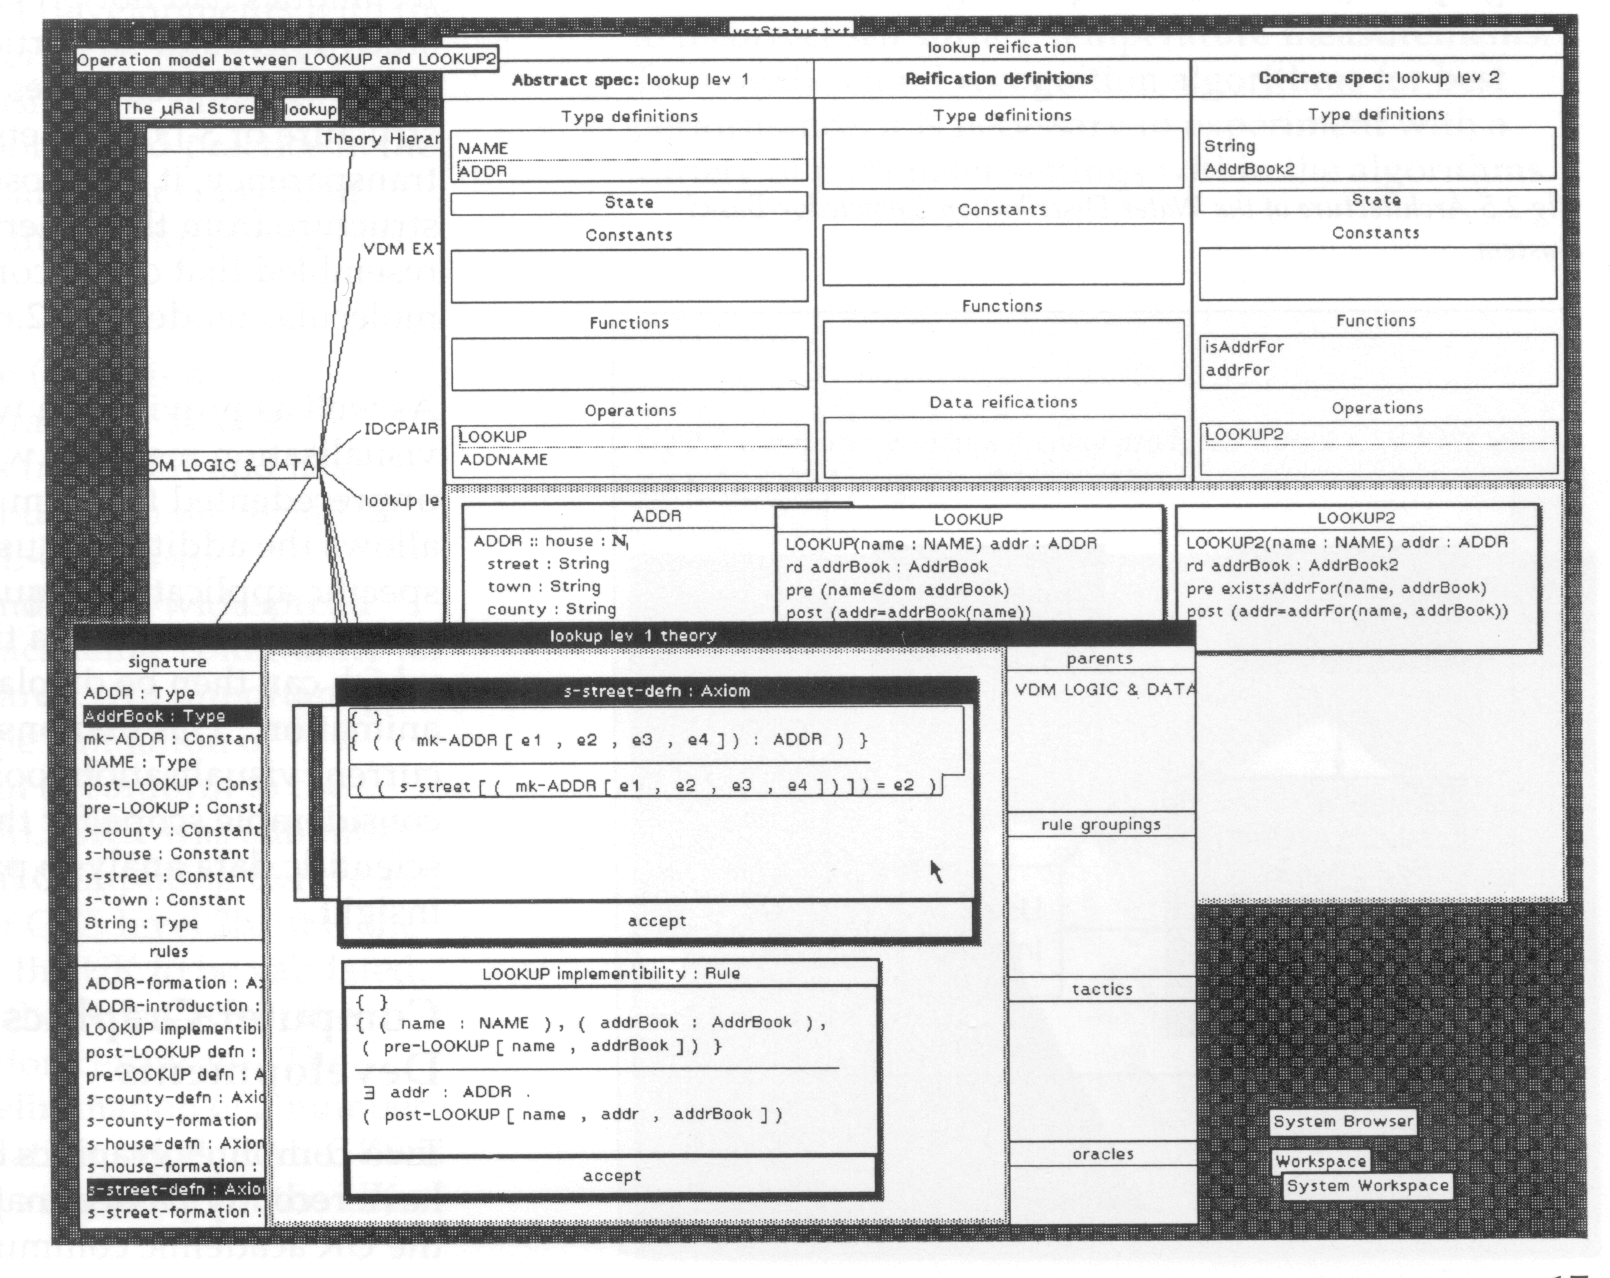
One reason often given for the slow adoption of formal methods is the lack of tools supporting the processes involved. MURAL, originally developed by Manchester University and RAL, is designed to assist with the theorem proving tasks arising in software engineering applications. Considerable emphasis has been placed upon the design of the user interface, enabling users to maintain their intuition of the problem domain and guide the proof in the right direction, whilst the faultless symbolic manipulation of the machine maintains the integrity of the proof. An exploratory style of working is encouraged with the intention of assisting the proof discovery process rather than merely serving to check proofs previously worked out on paper. Proofs can be constructed by working forwards from the hypotheses, backwards from the conclusion, or from new lines added directly to the middle of the proof. Lines of reasoning can be temporarily abandoned whilst alternative approaches are attempted or lemmas conjectured and proved on the fly.
An instantiation of the proof assistant has been developed for the Vienna Development Method (VOM) providing support for the creation of specifications and reifications between them, and also for the construction of the theories that provide the context in which proof obligations can be meaningfully discharged. As part of RAL's contribution to the original MURAL development project, a prototype VDM Support Tool was produced to maintain a store of VDM developments and generate MURAL theories from them (Fig 2.4). Though the tool supports only a small subset of the VDM specification language, and only a limited form of reification, work is well under way to extend the supported subset and reification model, and to improve the theory generation.
MURAL has attracted a great deal of interest from both the academic and industrial communities. Many have indicated a desire to use it in the teaching of formal methods, logic and proof. Funding under the SERC/DTI IT programme is supporting the distribution of MURAL to the academic community and improvements to the system and its user documentation.
RAL is engaged in the development of an advanced knowledge-based system (KBS) for a consortium of UK water supply companies. There are clear benefits to be had from knowledge-based assistance in the day-to-day operations of water supply companies by assisting staff who must take decisions when those with the most experience are not available.
In the past, many KBS have been based on heuristic knowledge represented as rules, but more recently the idea of reasoning about a model of a system has become popular. The water industry system incorporates both these types: model-based reasoning about the behaviour of water supply networks, with representation of components such as reservoirs and trunk mains; and heuristic knowledge gained from experts, which allows the system to reason about, for instance, what to do in the case of abnormal incidents such as pump failures or burst mains. In addition, the KBS includes both analytical reasoning, to assess the developing situation modelled within it, and planning of actions to control the situation. Fig 2.5 represents the architecture of the system.
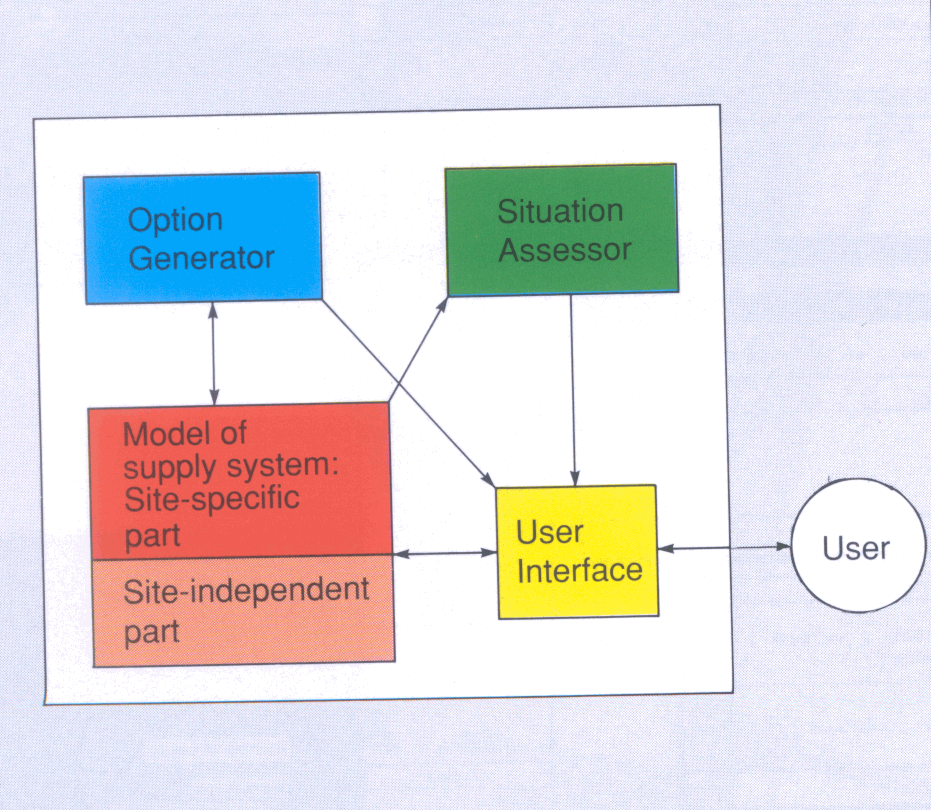
The KBS simulates the behaviour of important components of the supply system by using the model of the water supply network. Each state of the supply system is assessed by the 'Situation Assessor' to note important events including deviations from normal behaviour, for example a reservoir with less water than expected, or breaking of constraints, for example using excessive power at peak times. The Option Generator suggests intelligent courses of action that the user could take to alleviate the effects of problems. These can then be simulated and evaluated by the KBS to show the user the consequences of the action on the supply system.
The User Interface presents to the user an easy-to-use graphical and textual representation of the state of the supply system and allows the user to accept the system's suggestions of action or suggest their own.
The project has achieved major milestones this year. Prototype versions of the system have been well received by the water companies involved, and the first pilot system has been delivered to Southern Water plc. Work will soon begin on development of a site-independent version.
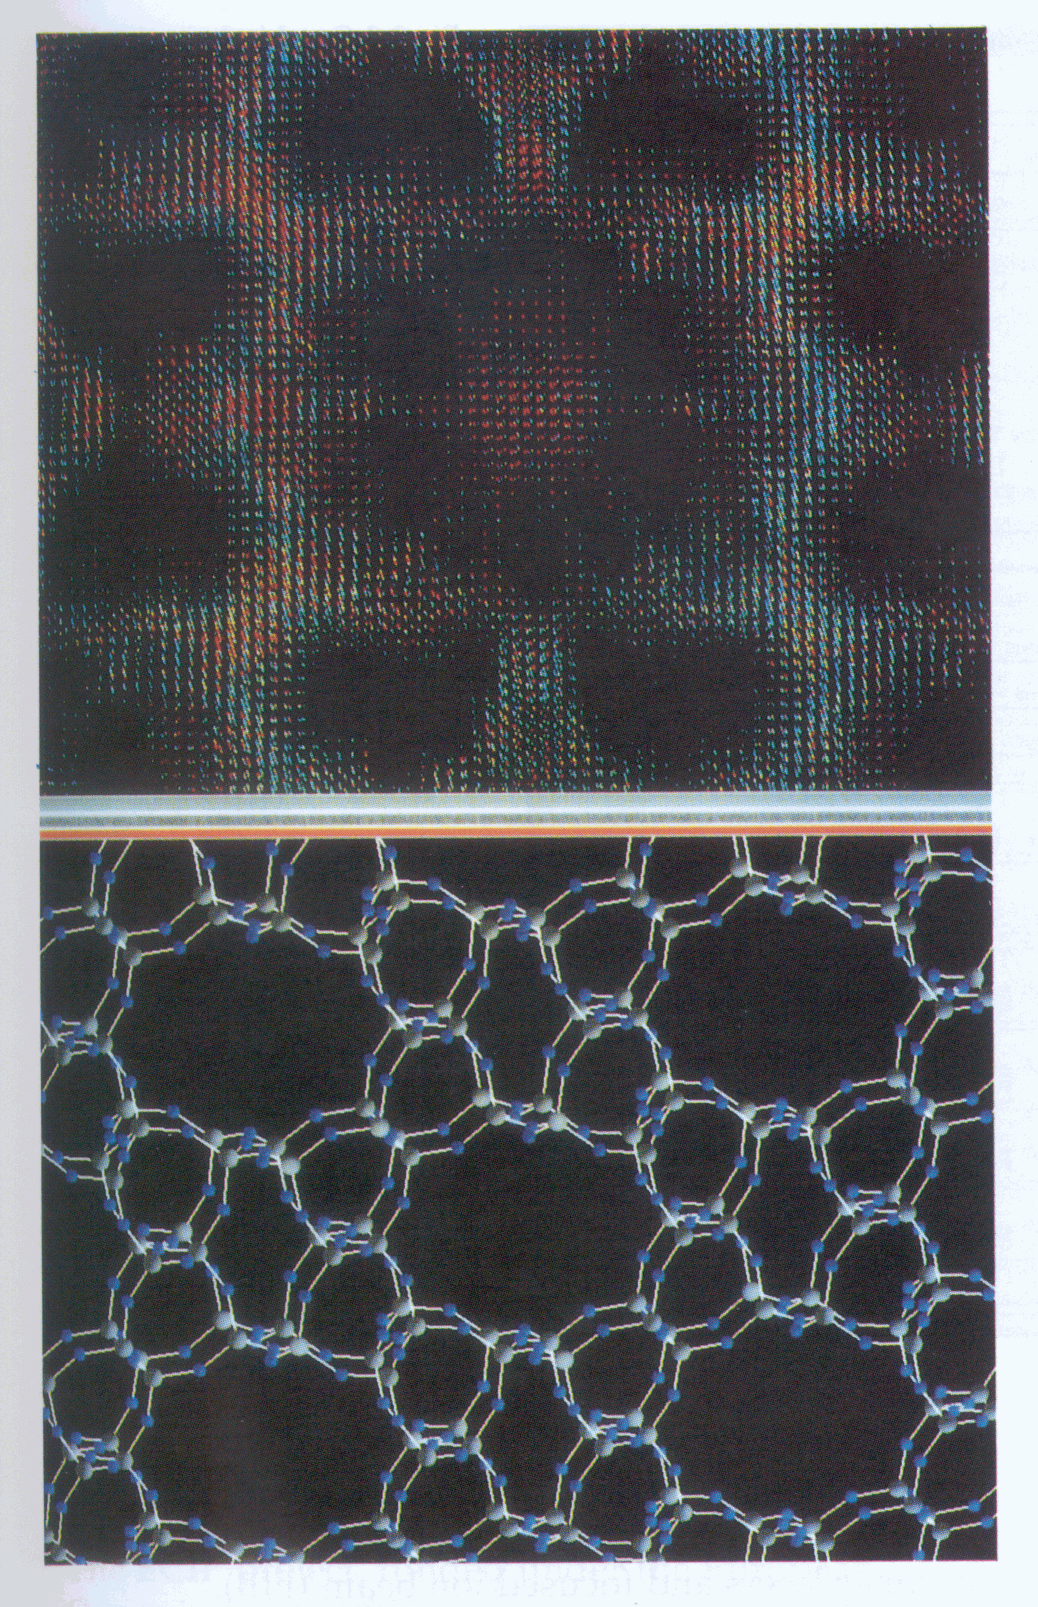
Visualisation is the use of graphical techniques for exploring data in order to gain understanding of the data and to provide insight into the underlying physical processes. As a feasibility study, some of the latest visualisation techniques have been used to investigate the analysis of neutron scattering data from the ISIS Facility at RAL. The data used included 2 dimensional (2-D) arrays of data from the LOQ diffractometer, 3 dimensional (3-D) arrays of experimental crystallographic data, and 3-D molecular data in Schakal format. The software used was the Application Visualisation System (AVS) running on a high performance graphical workstation.
The techniques evaluated included the representation of 2-D data arrays by line and fill-area contouring and surface generation, the use of colour maps to code different data values, data thresholding to select and emphasise data regions of interest, representation of molecular data by a 3-D geometrical ball and stick model, interactive 3-D data slicing with arbitrary 2-D projections, construction of isosurfaces in 3-D data for specified data values, the use of a wide range of image processing techniques to highlight features within 2-D data, and display of 3-D data using volume rendering techniques. Several of these techniques had not previously been available to study ISIS data. In particular, using volume visualisation techniques which permit the internal structure of 3-D data sets to be studied using transparency, it was possible to reveal that the 3-D structure from the experimental data closely resembled that of the corresponding ball and stick molecular model (Fig 2.6).
As well as providing a wide range of built-in visualisation methods which give users unprecedented freedom to explore their data, AVS allows the addition of user written modules for specific application requirements. A further feature is the ability to create a time series of static images which can then be displayed sequentially to provide animation. This demonstration of the power of current visualisation toolkits such as AVS has shown considerable scope for their application to a range of scientific data analysis problems requiring visual insight.
Two computer graphics development projects at RAL have recently passed major milestones with release to the UK academic community of software which supports the graphics standards GKS and CGM. These projects have been joint developments with the Advisory Group on Computer Graphics (AGOCG) which is responsible for advising the University Funding Council (UFC) on policy and practice in the computer graphics area. A particular concern of AGOCG is the promotion of international graphics standards.
The Graphical Kernel System (GKS) is an ISO standard for 2-D computer graphics. RAL's involvement with GKS dates from 1981 and has involved a significant contribution to the technical content of the standard. RAL-GKS is an implementation of GKS intended for widespread distribution throughout the academic community for education, training and research. An important part of the standards process is the validation of implementations which claim to conform to the standard. In March 1991, RAL-GKS was submitted for validation to the National Computing Centre and was passed without errors at GKS level2b. It is the first GKS implementation in the UK to be validated, and is at the time of writing the only GKS in the world with a current validation certificate. The process also resulted in the elimination of a number of errors from the GKS validation suite! RAL-GKS is currently being distributed to users within the UK academic community.
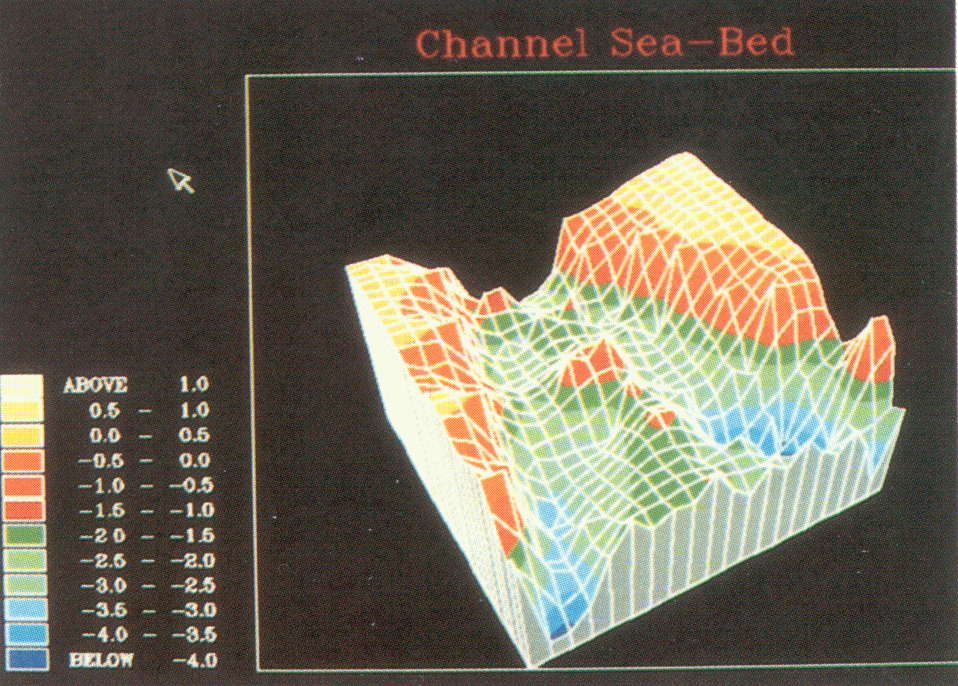
The Computer Graphics Metafile (CGM) is an ISO standard for encoding graphical images for transmission or storage. The standard provides for three separate encodings to meet different requirements. RAL-CGM was developed as a tool to enable CGMs to be viewed and printed and to provide translations between the three encodings. Viewing is implemented using X-windows and printing with PostScript. The use of these standards ensures that RAL-CGM can be used with a wide variety of graphical display devices and printers. RAL-CGM has been distributed in source code to more than 50 academic and industrial sites. Its wide popularity reflects the growing number of applications software packages capable of producing CGM (Fig 2.7). Further development is under way to enhance and improve RAL-CGM to meet future needs.
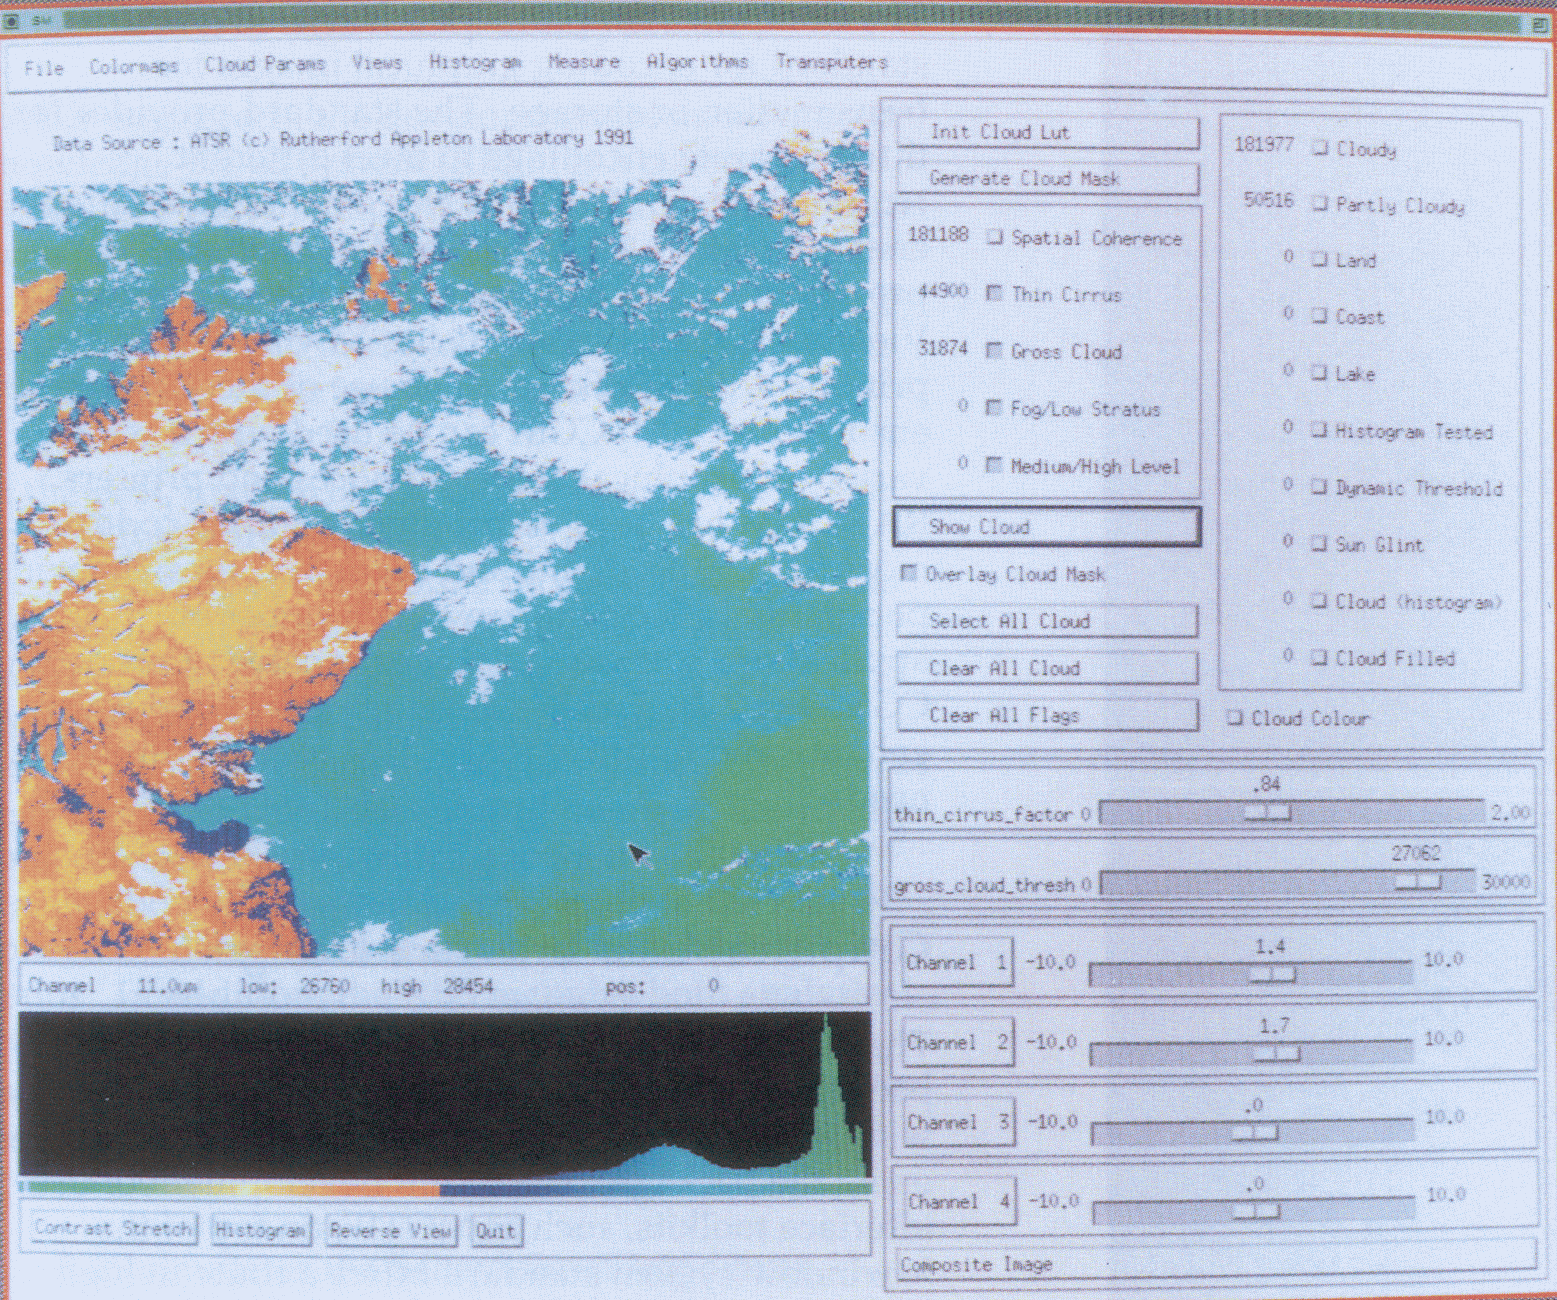
The quality of the user interface to an application package is a key factor in determining the efficiency with which the user can achieve his or her objectives using the package. The recent development of user interface toolkits, such as MOTIF, on top of the X-window system standard offers a route to high quality, portable, graphical user interfaces. To gain understanding of how to use such toolkits effectively, a joint development project between RAL's Informatics and Space Science Departments has produced Satview, a new interactive program for calibrating cloud recognition algorithms used in processing satellite image data. This is being applied to the analysis of some of the first images produced by the Along Track Scanning Radiometer (A TSR) instrument aboard the ERS-1 satellite. This instrument is designed to produce data for the accurate measurement of sea surface temperatures. ATSR images can be contaminated by cloud and, unless this is recognised and eliminated, it will lead to incorrect sea surface temperature measurements. To tune the cloud recognition algorithms for best performance, it is necessary to experiment with a variety of parameter settings within the algorithms.
This is a highly interactive task requiring good user interface techniques and rapid feedback of results to the user.
Satview has been implemented on a high performance IBM RS/6000 graphical workstation using the MOTIF widget library. This provides a range of basic user interface objects such as buttons and sliders, together with management functions which allow them to be assembled into an effective graphical user interface. The software can also be readily ported to other UNIX workstations. Satview allows interactive processing of raw A TSR images and provides a convenient way of visualising the results as images (Fig 2.8). The performance of the algorithms can be measured and the optimum calibration parameters necessary to identify correctly all cloud within the A TSR images can be determined. Simple image processing operations can be carried out to extract specific features and generate new images. The highly interactive nature of Satview provides a flexible environment for carrying out tests and for tuning performance. This is made possible by the combination of an advanced graphical user interface and a powerful computing system.