The algorithm demonstrated in this article was developed for use in the application of finite element techniques at the Institute of Sound and Vibration Research, of the University of Southampton.
The techniques are an extension of methods developed for the analysis of structures, especially as applied to aircraft design, in which the mechanical properties of geometrically simple components of structural members (e.g., a T beam is three straps, or long plates) are specified in isolation, while the equilibrium of force quantities, and the continuity of spatial movements, in regions of physical connection amongst components, are provided for by linking equations (e.g., forces and moments, and translations and rotations along the line of junction of the three plates in a T beam).
In the extension, geometrically uniform components are themselves sub-divided into further simple elements, within which physical events are described by simple mathematical relations, chosen according to rules which provide the possibility of convergence of the necessarily approximate description, overall, to the true one, as the number of sub-divisions is increased.
These sub-elements are assumed to be connected to neighbours only at certain boundary points, with events throughout each element made a function of those occurring at these 'nodal' points.
Thus the continuous physical system and the events within it, are discretized to a set of elements within each of which a simple description of events provides, in total, a good approximation to the quite complex continuum.
The relations between, and within elements, being sufficiently simple, can be expressed in the form of matrices. With the use of large and fast digital computers, solutions may be obtained by these 'techniques', for otherwise intractable problems of force, mass and energy transfer.
Plainly, in regions of the continuum where rates of change of physical events are high, the size of elements must be small.
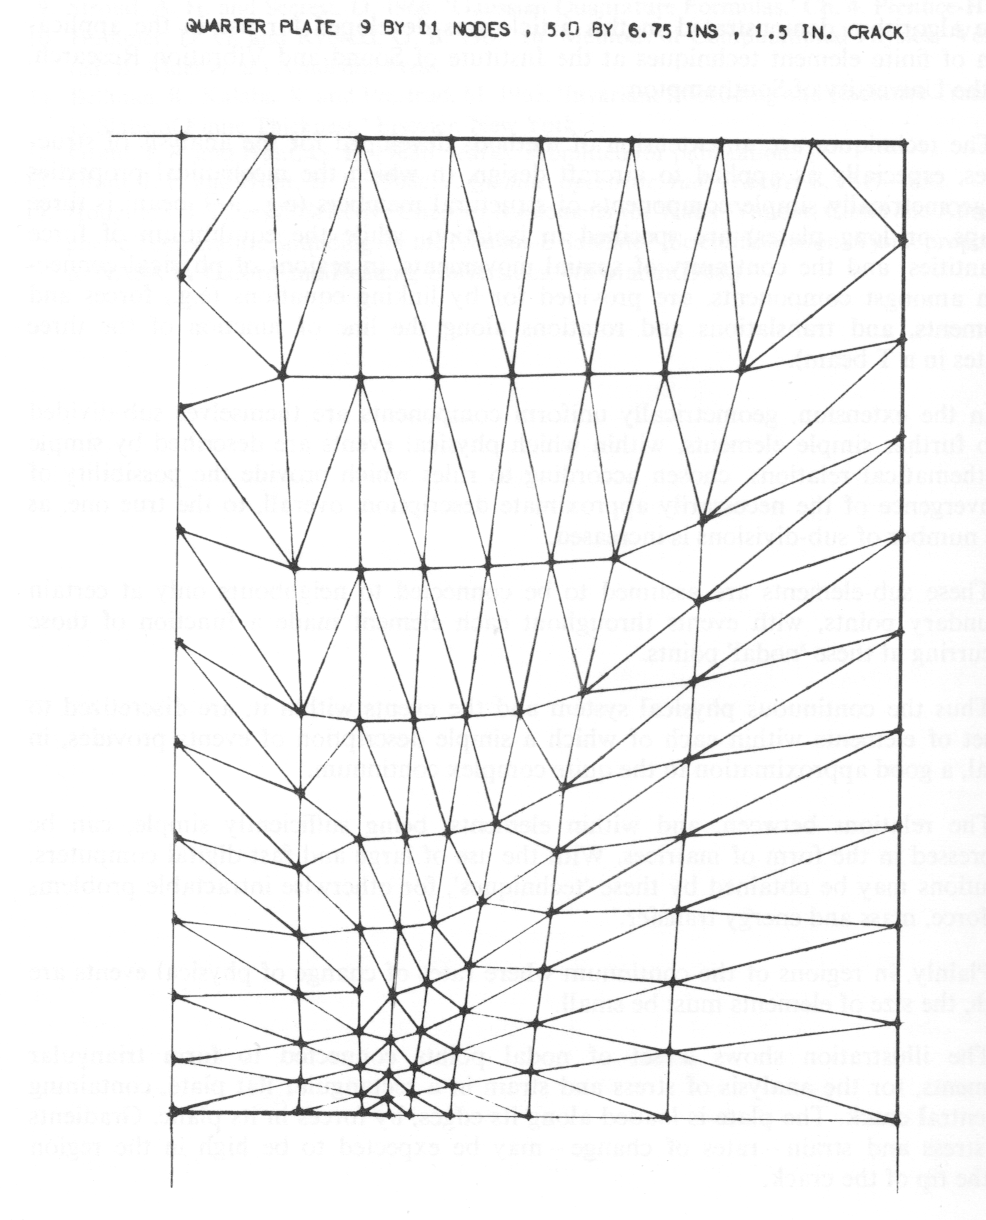
The illustration shows a set of nodal points connected to form triangular elements, for the analysis of stress and strain in a rectangular flat plate, containing a central crack. The plate is loaded along its edges, by forces in its plane. Gradients of stress and strain - rates of change - may be expected to be high in the region of the tip of the crack.
The algorithm applies a transformation to a set of regularly disposed - and therefore, easily generated by the computer - nodal points, to cause a smooth and continuous migration towards the region of required high element density.
The data plotted were generated by the Atlas computer from programs written with the help of the Staff.
The illustration was plotted automatically by the SC4020 photographic plotting equipment of the Laboratory.
In the example, representing the upper right corner of a rectangular plate with a central, x direction crack, 0.3 in length, of the x direction plate width, mirror symmetry about the lower and left boundaries is assumed.
Two transformations were performed - the first to increase nodal point density toward the plate centre, especially along the crack edge, and the second to provide high element density about the crack tip.
The mathematical process involved is equally applicable to the concentration or the dispersion of points within a three dimensional rectangular parallelepiped.