
Paul Nelson from the Atlas Computer Laboratory attended the Conference and presented two papers.
The goal this year was to insure that the effort which each member put forth in support of UAIDE had a positive result. This required that every operation performed at the national, regional, and local level be reviewed. This review indicated certain action must he taken concerning our legal structure, organization structure, publications, local chapters, regional meetings, and the annual meeting. This goal brought about significant individual effort, tremendous team effort, and helped to identify the problem UAIDE faced in the future.
UAIDE was incorporated in the State of California as a non-profit organization with a non-exempt tax status. This incorporation provides the officers of UAIDE legal protection in those areas where they had to enter into contractual agreements. It provided DatagraphiX with a better legal environment for subsidizing UAIDE's effort, and finally provide a definite procedure for disposal of material assigned to UAIDE by its users (UAIDE Library)
Several changes were made to the organizational structure of UAIDE to make it more functional. The first major change was the separation of the combined Secretary-Treasurer office into two distinct offices and responsibilities. This has been extremely effective in providing a much more balanced work load for the two offices. A corresponding secretary position was also established and is filled by appointment via the President. This addition allows the secretary to function as an officer of the organization rather than spending an inordinate amount of time doing clerical work. This has proven effective in getting more timely minutes and newsletter publication. Finally three distinct special interest groups Scientific, Business, Animation were established in place of the standing committees, Hardware, Software, Advanced Design, Application, Business Systems, and Computer Animation. This change was intended to help the user identify himself with a specific area of effort. This change helped us to better organize the annual meeting and to add depth of participation to the organization.
The format and publication date of the UAIDE newsletter were modified. The format was changed to one using excerpts from the minutes of board meetings, DatagraphiX news, Publications concerning COM, and specific messages from the UAIDE President. This change was well received. Publication date was set at a bi-monthly cycle.
An attempt was made to have the proceedings made available at the annual meeting. This failed although a target date of January 1, 1970 has been set for publication and would be a significant improvement.
Two UAIDE local chapters are now active. One is in the Los Angeles Area and the other in Michigan. Commitment has been made for the development of a Local chapter in the Washington D. C., Hew York City, and Chicago areas. It is felt that only through local chapters will UAIDE be able to have the input of those who are closest to doing actual application using DatagraphiX COM equipment.
A business oriented regional meeting was held in Washington, D. C. with an attendance of 100 users. This consisted of entirely paper presentations for an entire day and was well received by all attendees. Most all of the papers given were represented at the annual meeting and will be published in the proceedings of the Annual Meeting. Two scientific regional meetings were held; one in Washington, D. C. and the other in the L. A. area. Attendance was approximately 30 at both.
Jim Stubbs, UAIDE DatagraphiX representative, spent considerable time convincing DatagraphiX senior management of the potential of UAIDE. This effort resulted in a mandate from Don Mitchell to his staff to use UAIDE wherever possible to insure that DatagraphiX goals were in tune with user needs.
Gary Clickard, UAIDE board member from Ford Motor Co., effort in preparing a three year plan for the expansion of UAIDE activity to meet the expanding needs of DatagraphiX and its users will serve as an excellent guideline for the coming year.
John Logan, UAIDE Executive Secretary, efforts in preparing a handbook for his position, in preparing the user catalog, in preparing annual meeting material, plus the responsibility for proceedings publication has worked harder than any other individual in the organization to insure UAIDE's goals are reached.
The biggest problem that lays ahead is avoiding the annual update of the objectives of the organization and concentrating on achieving the objectives of UAIDE. The minutes of the past years indicate the large percentages of time has been spent trying to figure out what UAIDE was supposed to be doing rather than actually achieving a specific end product.
Jim Splear
UAIDE President - 1970
Two items concerning the financial organization of UAIDE may be of interest to the readers:
Attached is a report summarizing the income and disbursement transactions during the year 1970. The reports of both the UAIDE Group and UAIDE are included.
D. T.Rumford, Treasurer
| UAIDE Group 1 January- 2 June 1970 |
Total ($) | UAIDE (as incorporated) 3 June- 31 December 1970 |
Total ($) | |
|---|---|---|---|---|
| Cash (beginning of period) | 6960.08 | 6313.01 | ||
| Receipts DatagraphiX |
6000.00 | 3000.00 | ||
| Proceedings | 90.26 | 463.00 | ||
| Other Publications | 8.00 | 32.00 | ||
| UAIDE Annual Meeting | 0.00 | 4930.00 | ||
| Other Registrations | 490.00 | 1055.00 | ||
| Total Receipts | 6588.26 | 9480.00 | ||
| Disbursements |
||||
| Telephone | 1482.49 | 1276.13 | ||
| Postage and Office Supplies | 15.00 | 108.40 | ||
| Travel | 4062.71 | 4752.85 | ||
| Board Meals | 346.86 | 0.00 | ||
| Clerical Support | 405.08 | 1059.47 | ||
| Chapter Promotion | 153,20 | 550.00 | ||
| Regional Meeting Promotion | 624.86 | 2104.64 | ||
| UAM Expenses | 20.13 | 4230.26 | ||
| Miscellaneous | 125.00 | 490.71 | ||
| Total Disimbursements | 7235.33 | 14572.46 | ||
| Cash (end of period) | 6313.01 | 1220.55 |
The objectives of the Business Systems Committee for calendar year 1970 were as follows:
With the above goals established, here is what was accomplished during calendar year 1970.
The following objectives have been established for the Business Systems Committee in Calendar year 1971.
The Southern California Local Chapter was conceived and started in the year 1970. It was an exciting year for UAIDE in the Local Chapter. The dinner meetings are monthly and have had an average attendance of 25 attendees. The membership includes 25 members for 11 different companies.
The officers of the Local Chapter are:
President          Don Stanley       Lockheed-California Company, Burbank
Treasurer          Hans Lindblom     Naval Weapons Laboratory, China Lake
Program Chairman   George Baum       MeDonnell-Douglas, Huntingdon Beach
                   Jim Tsukida       Pacific Missile Range, Point Mugu
Secretary          Steve Popelka     DatagraphiX, Santa Monica
                   Gary Haas         DatagraphiX, Santa Monica
Arrangements       Jeannine Lamar    Rand Corporation, Santa Monica
One of the events of 1970 was the establishment for UAIDE of an official address. All of the officers, board members, committee chairman, and representatives of UAIDE can be addressed by name or title through the following address:
UAIDE
P. 0. Box 2449
San Diego, Calif. 92112
Mr Doug Woodham
Wally Taber Productions
111 Continental Avenue
Suite #309
Dallas, Texas 75207
(214) 748-6392
Mr Rod Keitz
K & H Productions
3601 Oak Grove
Dallas, Texas 75204
(214) 526-5268
Mr Ed Edwards
Battelle Memorial  Institute
505 King Avenue
Columbus, Ohio 43201
(614) 299-3151 X3388
Mr James M. Tsukida
Scientific Data Analysis and Processing Department Code 3432
Pacific Missile Range
Pt.  Mugu, California 93041
Mrs Evelyn Clickard
8221 Clippert
Taylor, Michigan 48180
(313) 291-8554
Mr George A. Baum
McDonald Douglas
Bldg. 35-25
3855 Lakewood Blvd.
Long Beach, California 90801
(213)  593-2096
Mr John L.  Ferber
Dept. of Health, Education & Welfare
5906 Bryn Mawr Road
College Park, Maryland 20740
(202) 963-5695
Mr Don Kennedy
NASA GODDARD
Information Processing
Code 656
Greenbelt, Maryland 20771
(301) 982-6346
Mr Jim Splear
General  Motors Corp. - Research Labs
12 Mile and Mound Road
Warren, Michigan 48092
(313)  575-3004
Mr Roger Nagel
University of Maryland
Computer Science Center
College Park, Maryland 20783
(301) 454-4527
Mr Franklin Gracer
IBM Research
P. 0. Box 218
Yorktown Hts., New York 10598
(914) 945-2937
Mr Sherrill Martin
Kaye Instruments, Inc.
737 Concord Avenue
Cambridge, Ma. 02138
(617) 868-7080
Mr Tom Doran
Army Material Command
Building T-7
Arlington, Virginia
(202) 0X5-5631
Mr Tink Henry
Oldsmobile Division of G.M.
Data Processing Department
Lansing, Michigan 48921
(517)  373-4910
Mr Henry Dolecki
Bank of the Commonwealth
P. O. Box 2401
Detroit, Michigan 48231
(313) 965-8800 Ext.  8716
Mr Don Stanley
Dept. 8031, Bldg. 67, Plant A1
Lockheed Burbank
P. 0. Box 551
Burbank, California 91503
(213) 847-7748
Representative to UAIDE      Mr James Stubbs
UAIDE Executive Secretary    Mr John Logan
Business Systems             Mr Harley Brown
                             Mr Mark Woods
Scientific Systems           Mr Rod Johnson
Computer Animation           Mr Paul Ressler
                             Mr Robert Foster
Publicity Chairman           Mr Howard Bernstein
All DatagraphiX personnel may be reached at the following address:
Stromberg DatagraphiX, Inc.
P. O. Box 2449
San Diego> California 92112
(714) 298-8331
The 1971 UAIDE Annual Meeting will be held October 25-29, 1971 at:
The Biltmore Hotel
515 S. Olive St
Los Angeles, Calif. 90013
The Program Chairman is:
Mrs Gina Robinson
K & H Productions
3601 Oak Grove
Dallas, Texas 75204
For information concerning the meeting write:
Program Chairman
UAIDE
P. O. Box 2449
San Diego, Calif. 92112
It is indeed a pleasure to be talking to a group of the Users of Automatic Information Display Equipment - in a field in which I have had a strong interest over the years. Today my topic is not, however, information displays - but the organization of a vendor for effective user group communication.
Taking a highly simplified view of the problem, I contend that an effective user group will:
Now for the vendor to effectively work with a user's group, he must:
I believe, that the objective that each member of a user's group should have is:
As you may remember, in the early days user groups were a group of people banded together to help each other. Today the groups are more sophisticated and more diverse. In the beginning every attendee's experience was different from the other man's, and every man could learn from others. Another way to say that is - all were beginners and knew very little to start. Today's users have greatly different objectives. Of course there still is the basic drive to solve problems together. However, it is shaded at times by the placing of too much emphasis on convincing the vendor he should solve a problem - rather than the members of the user's group sitting down and carefully thinking through the problem. Pressure tactics pressed on vendors at meetings I view as a non-constructive use of a user's group. An ideal user's group, in my opinion, is one with a focus on mutual problem solving - not on the solving of problems by the vendor. In my opinion, an effective user's group must be based on sound technical work by the members. It-will do us no good to ask DatagraphiX to tune their hardware to higher accuracy than the state of the art. It has been designed to operate and be priced with a certain reliability and certain accuracy. Any push to achieve higher accuracy by pressure tactics is, in my opinion, futile.
Does that mean we can't ask for improvements from the vendor - Not at all. It means that we ask for improvements that, as a group of users, we can clearly demonstrate as being feasible. And this can only happen by continuity of work by small task forces working, not at the large annual meetings, but working for weeks together to cleanly and precisely formulate problem solutions.
The proceeding holds equally for both software and hardware. The responsibility for technical feasibility of user's group requests should lie in the user's group.
Now suppose a group of users do have a very well thought out, very feasible way to solve a technical problem. Is that enough for the vendor to be convinced and to proceed on the project? No, a user's group, I believe, should try to analyze the benefits to the vendor and show the economic gains he should expect from the projects the increased sales, the decreased maintenance, and the new market potential. Remember one of the objectives of a user's group is the mutual solving of problems - and that should include the vendor's problems of being profitable.
This brings me to my third point. While vendors are corporations, they are also groups of people, with all the problems of people motivation. Remember the computer system we are asking to be improved, and the hardware for which we are requesting changes, were probably designed by the man we are trying to convince to accept the suggested improvements.
Therefore, to be effective we must sell an idea to the vendor. We must convince him that the project is technically feasible and economically worthwhile for him.
Now suppose the user group does do a thorough job of planning, does indeed show technically and economically feasible potential, will the vendor respond - and indeed how should he respond?
I believe the vendor wants to serve. His livelihood depends on it.
Is this an impossible task for a user's group or a vendor? I don't believe so. By its very nature the people at user's group meetings are solution oriented. They want problems solved. I feel given a user's group environment which encourages aggressive, continuous problem identification and a strong task force-type approach to problem solving, can motivate a vendor. He can be motivated by good technical and economic arguments for your ideas.
In my presentation I have essentially placed the challenge of effective vendor responsiveness to a user's group on the user, not on the vendor. My reason is simple. By choice we selected the vendor for the product we are using. We are the ones that identify the problems the user group thinks are important. And we have the freedom of changing vendors. If the vendor does not think the problems are significant, and hence; is not responsive - we can change vendors and user's groups. We do not have to beat our head against the wall.
Summary of talk given by Dr. Howard J. Teas at UAIDE Luncheon, 10/21/70, Carillon Hotel, Miami Beach, Florida
Southeast Florida is in the fortunate position of receiving fresh air from over the Atlantic Ocean during a major part of the year, Miami is near the top of the clean air list of major cities in the United States primarily because of its geography and meteorology. Even though we have open trash burning, smoky incinerators and the expected jet and automobile exhausts, we do not have a critical air pollution problem.
Many of the waterways of South Florida are freshwater canals that originate in Lake Okeechobee or the Everglades. In the native state these canals, sometimes called rivers or creeks, are often crystal clear. Because of the need to control the intrusion of salt water near the coast, the levels of these canals are regulated by water control dams close to where they empty into the bays. As a consequence of the water control structures our canals have little flow except at the time of rain and are in fact stagnant for considerable periods of time. It is the waters of these clear canals that serve in South Florida as depositories for sewage plant effluents, industrial wastes, septic tank seepage and agricultural runoff.
Sewage is the major pollution problem of South Florida. Somewhat more than half of the people of Dade County, the county in which Miami is located, have their waste lines connected to septic tanks. These pose a health hazard because of the very porous underlying limestone and the nature of the fresh water aquifer which is utilized for drinking water. Less than half of the people of Dade County are served by approximately 100 sewage plants. It has been estimated by our pollution control people that about nine out of ten of these sewage plants fail to meet the legally required 90% removal of organic matter from their effluent either occasionally or in some cases continuously. As a consequence of the inadequate treatment of sewage and the nature of South Florida's waterways, extensive banks of sewage sludge as deep as five feet have formed in some canals near the outfalls of sewage plants. The coliform bacteria counts in many of these canals within the urbanized part of their length make the water unfit for fishing, swimming or water contact sports. Indeed, in many cases the odor and appearance of the canals is so unaesthetic as to make their use for contact sports unlikely.
A well run sewage treatment plant gives rise to little or no odor in adjacent areas. However, it is readily understandable that a plant which is doing a grossly inadequate job of sewage treatment may cause odor problems. One plant in Dade County had so many complaints from its neighbors that the operator began spraying perfume into the air in an attempt to mask the odor.
The clear canals that slowly flow from the Everglades and which become the recipients of nitrate and phosphates from septic tank seepage, sewage plant effluent and suburban yard fertilizer runoff are on occasion the sites of fish kills. As the water in these canals is enriched by nitrate, phosphates, and other mineral nutrients and organic materials, it becomes a rich medium for the growth of algae. Algae, like other green plants, release oxygen into the water as they carry out photosynthesis in sunlight. At night algae, like other living organisms, require oxygen for their metabolism. The water of canals that have had nutrients added and have developed heavy algae growth may retain enough dissolved oxygen at night for the fish. However, at high levels of nitrification, with the consequent algal growths or blooms, several consecutive days of cloudy weather may spell trouble for the canal's fish. On cloudy days the algae may not produce enough oxygenation of the water to last overnight and as a consequence the concentration of dissolved oxygen at night may fall to such low levels that fish are asphyxiated.
The canals in the agricultural areas receive large amounts of nutrients in the form of fertilizer runoff during the winter vegetable growing season. The blooms of algae that follow such nutrient additives have been responsible for fish kills during cloudy weather in some of the agricultural area canals where there is no contamination with sewage plant effluent. Clearly, excessive nutrients in our waterways is a problem, irrespective of whether the source of nutrients is sewage plant effluent, fertilizer runoff or septic tank seepage.
Not all sewage in South Florida finds its way, with or without treatment, into the canals or septic tanks. Several communities in the area dispose of their sewage by pipelines into the ocean. The great majority of the approximately three hundred thousand people of Miami Beach are served by such an outfall that is located 7,000 feet out into the ocean, only five blocks north of the Carillon Hotel. At the point where the 30 million gallons a day of raw sewage come boiling out of the pipe there is a large murky area that is locally called the Rose Bowl. Flocks of seagulls can often be seen near the Rose Bowl and it is an area that attracts both fish and fishermen in great numbers. The problem with ocean outfalls is one of health: the ocean currents shift and sometimes carry the sewage to shore, contaminating bathing beaches. Also, contamination might be carried to people by birds or fish.
South Florida's air is not too polluted, but the majority of the freshwater canals and some of its bay and ocean beaches are unfit for swimming because of sewage pollution.
As you are aware, South Florida is an area attuned to tourists. Florida is reported to be the first state in tourist income and within the Florida and southeastern coast is the greatest focus of tourism, In addition to the stream of visitors the area is growing very rapidly in permanent resident population. The influx of tourists and new citizens overtaxes many public facilities and services, including sewers and transportation. The rapid and generally unplanned development that is taking place poses a serious threat to the future of South Florida as a desirable place to live as well as for tourists to visit. Creeping peoplitis is my term for these problems associated with too rapid growth. Creeping peoplitis is the disease syndrome that characterizes the new high rises with only enough space between them for parking lots; it gives us real estate developments that don't even provide solutions for their own sewage, transportation and recreational area problems. Creeping peoplitis is responsible for filling the mangrove swamps and installing concrete seawalls where larvae of shrimp and game fish should be spending their childhood days.
The reactions of those of us in South Florida concerned with environmental problems has been mostly negative, that is, we are active against things that threaten the environment. We fight creeping peoplitis issue by issue. We spend our time being negative, trying to stop things like a poorly located jetport, hold up a large real estate development that would fill the mangrove area, stop new developments that have no plan for sewage treatment other than to further overload inadequate existing facilities. My hope for South Florida is that by winning negative issues we will gain enough support to force regional land use planning before rather than in response to the pressure of developers. Then we may have a partial cure for creeping peoplitis.
Business groups using microfilm to update data in information search and retrieval systems might anticipate that computer animation is a natural extension of a medium with which they are already involved. That is true only in the sense that the output is still on film and that viewing the film can provide business information; the questions the animated film can answer are of a different nature and the personnel interested in that information are usually different.
It is assumed here that the potential business user has a general familiarity with computer animation to the extent that he has seen computer generated films. Contact with the periphery of the field can lead one to the conclusion that the thrust of animation efforts are in areas of a) education and research, b) engineering simulation displays, c) art, d) image quality technique development (halftones, shading, color), e) software development for powerful passive and interactive graphic systems. Few of the efforts seem connected with potential business uses of animation.
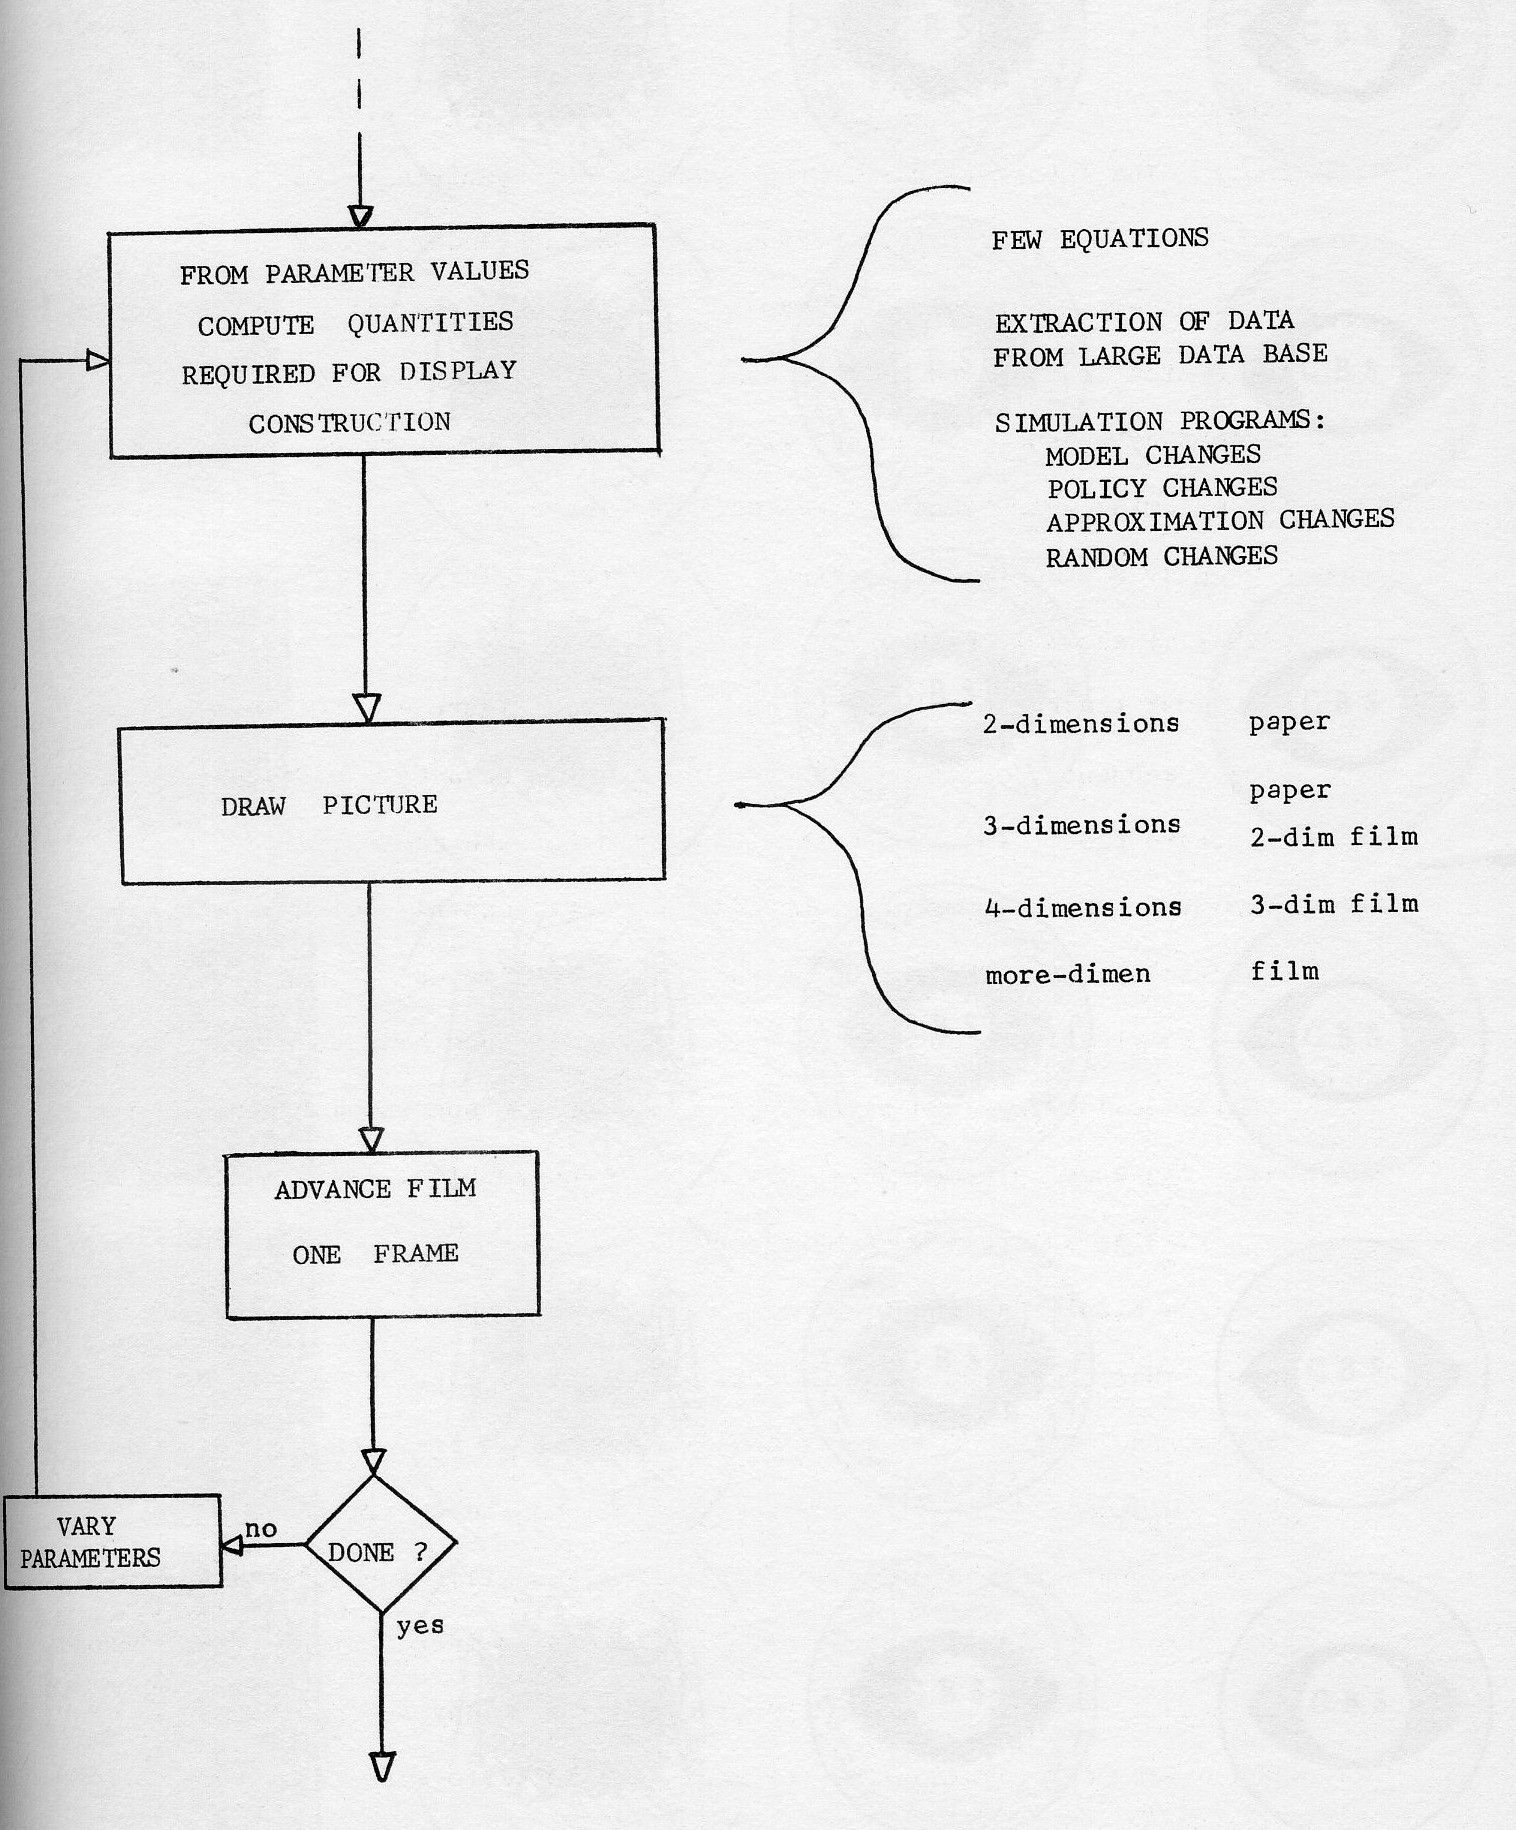
However complex, the variety of uses all reduce at some level to a flow plan that involves the basic elements shown on the left side of figure 1. The loop construction in a computer program allows small changes in variables to be made from frame to frame so that the display characteristics which are a function of those variables are exhibited in a motion whose smoothness depends upon how small one is willing to make the changes in the variables used to construct the display. The mechanics of implementing such a flow vary with the software language, the computer and the display device used. The implementation capability for generating animated footage can be viewed two ways. On the one hand it is simply a technique available to a producer to be used when appropriate. On the other hand, computer animation can be the guts of a biweekly production run to repeatedly extract weakly related cross sections of data from a large data base or bases. In the latter view, you have strong candidates for display in a form different from a fixed graph or bar chart.
A general classification of computer animated business display possibilities would have to include
The variety of fixed graphs possible are well characterized and described elsewhere in these proceedings. Here we will show from the above classes some non-standard display uses made possible by computer animation.
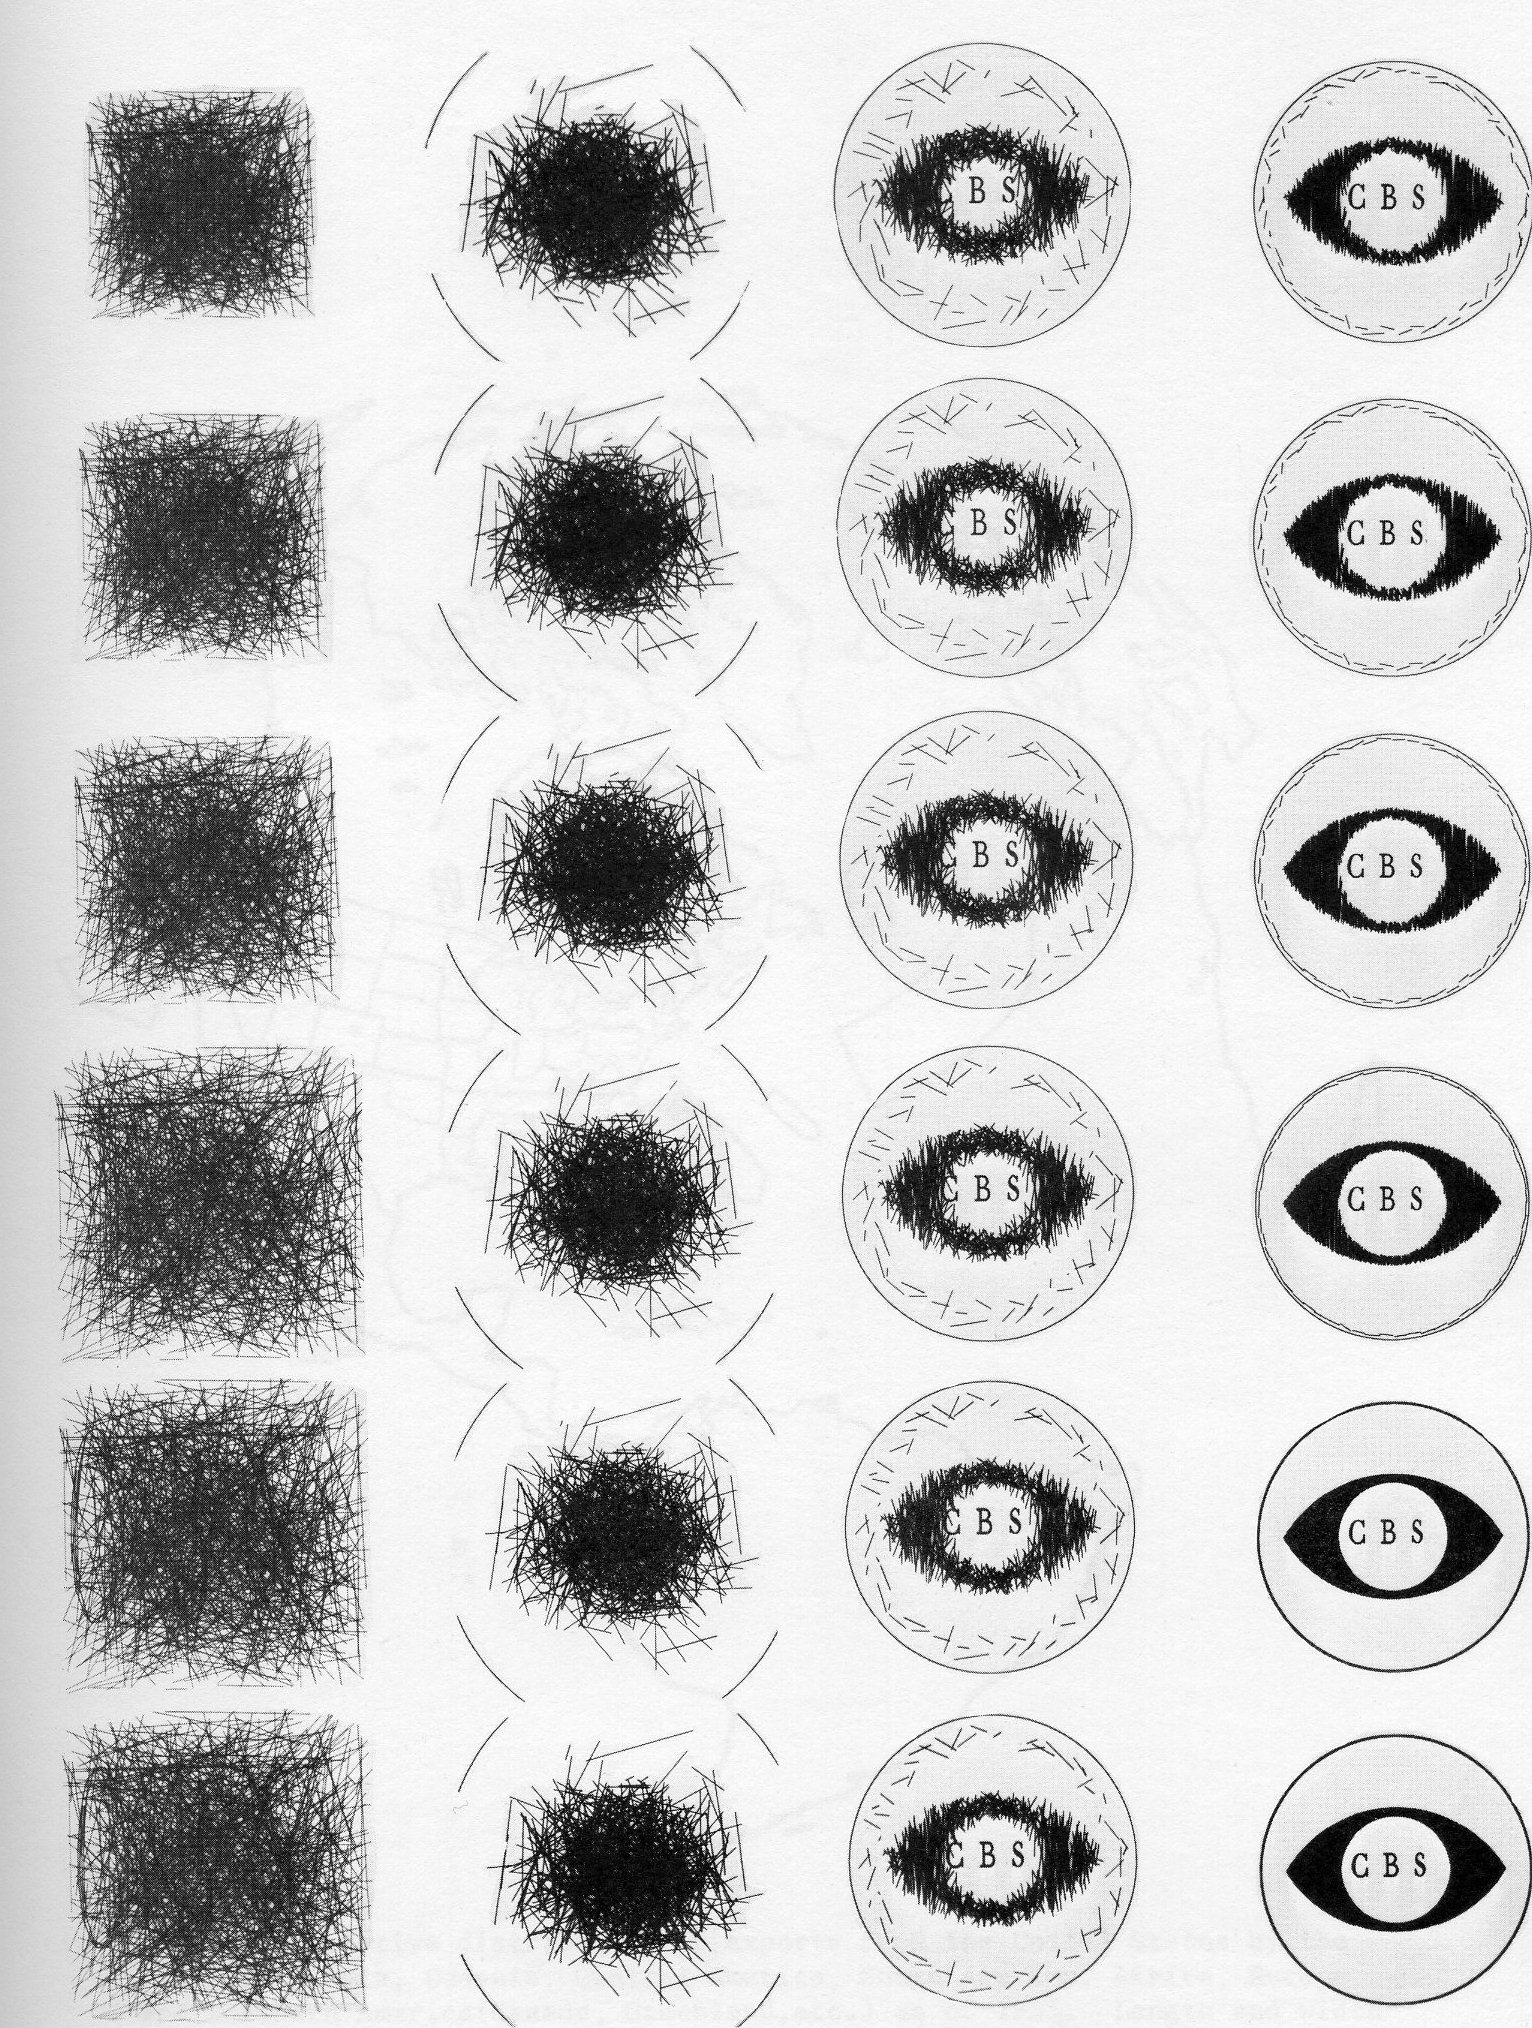
Figure 2 contains several frames of a logo construction from a computer generated sequence of the CBS eye. One can contemplate imaginative, attention getting metamorphoses of product shapes which might otherwise be considered out of the question.
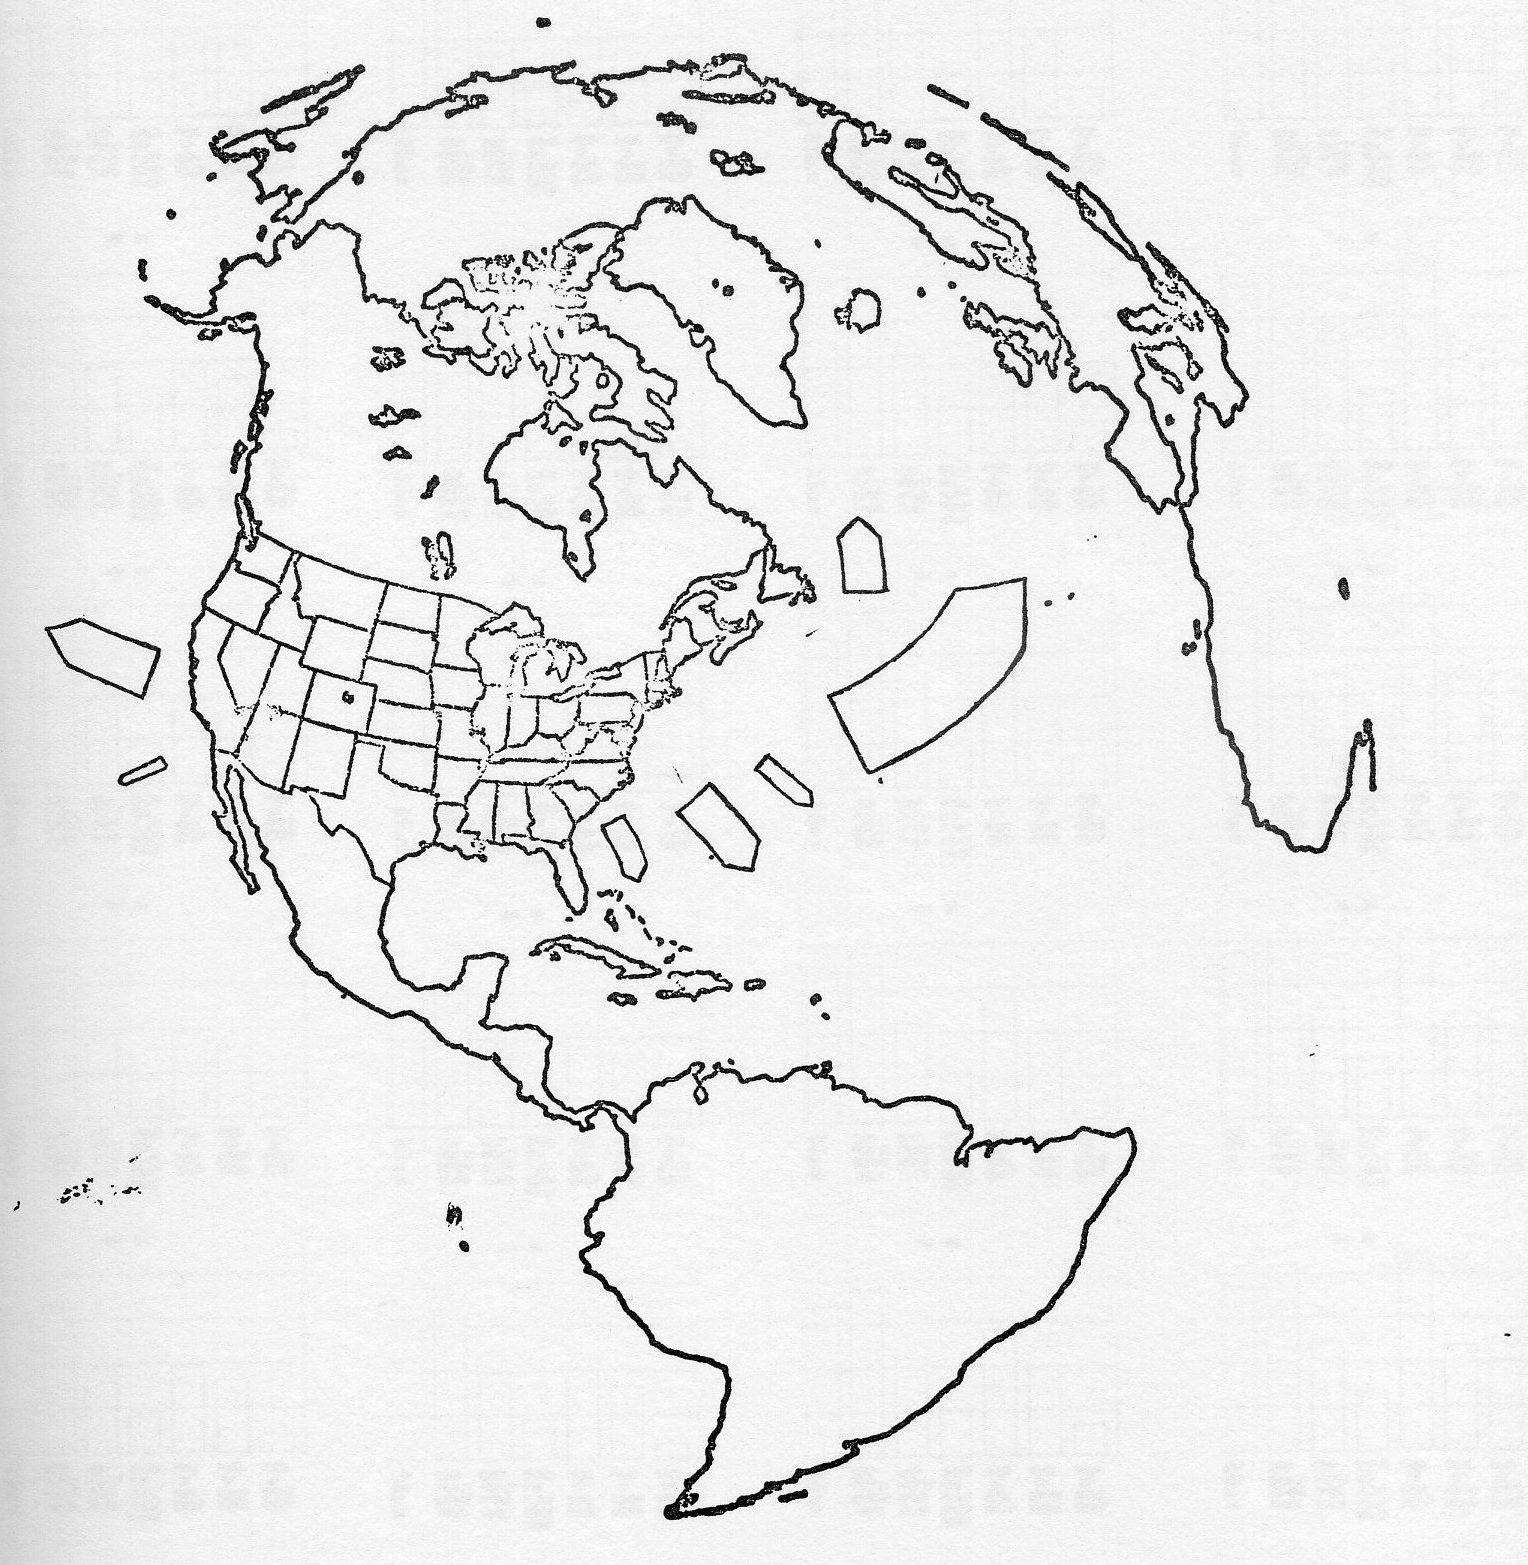
In information retrieval systems using microfiche or roll film, the connection between frames is some indexing method or scheme for ordering successive frames; with the movie, one looks for changes as a single parameter (not necessarily time) or many parameters change from frame to frame. The information sought is usually not specific values but rather trends and relationships. Frequently apparent randomness is observed in local movement but overall order is detected when the total environment of the motion is observed. Topographical displays allow visual comparison of company trends (say sales) with growth patterns or related business trends to determine where geographical deficiencies exist or can be anticipated in a company's efforts to catch part of a market. The view can be local or global as shown in Figure 3.
Even the bar chart can be made dynamic. Figure 4 shows several frames from a sequence depicting changes in the GNP over a five year period. Several corporate profit and production quantities for the same time period are displayed. Bar heights are computed to change smoothly between quarterly reported values. The motion of the bars over time can be superimposed with individual company performance records to show how the company is leading or lagging industry wide averages or perhaps not matching them at all. The same information displayed on a geographical basis would be of even greater interest to a management team.
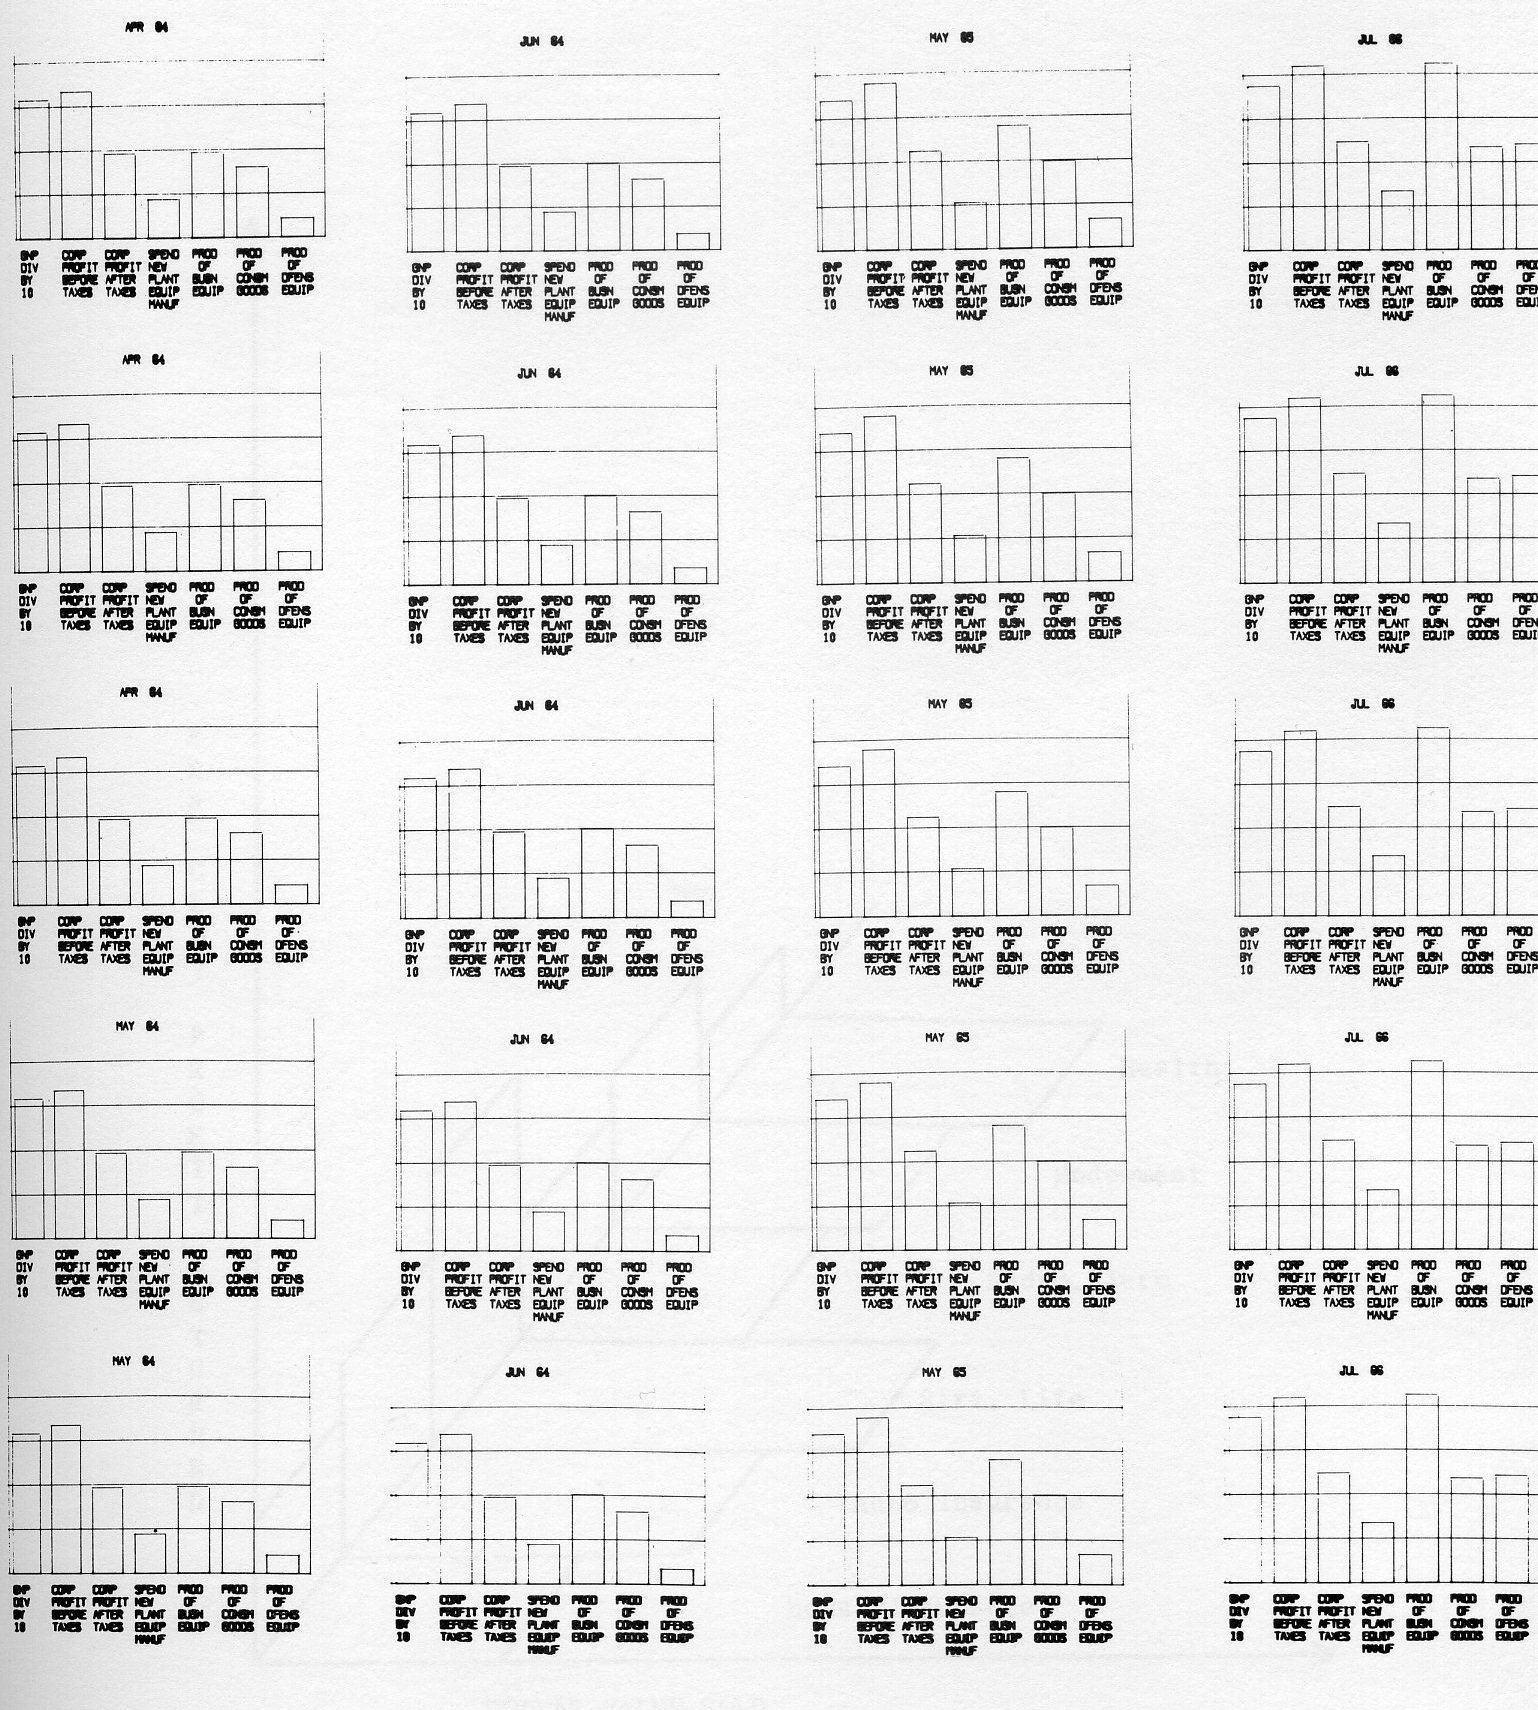
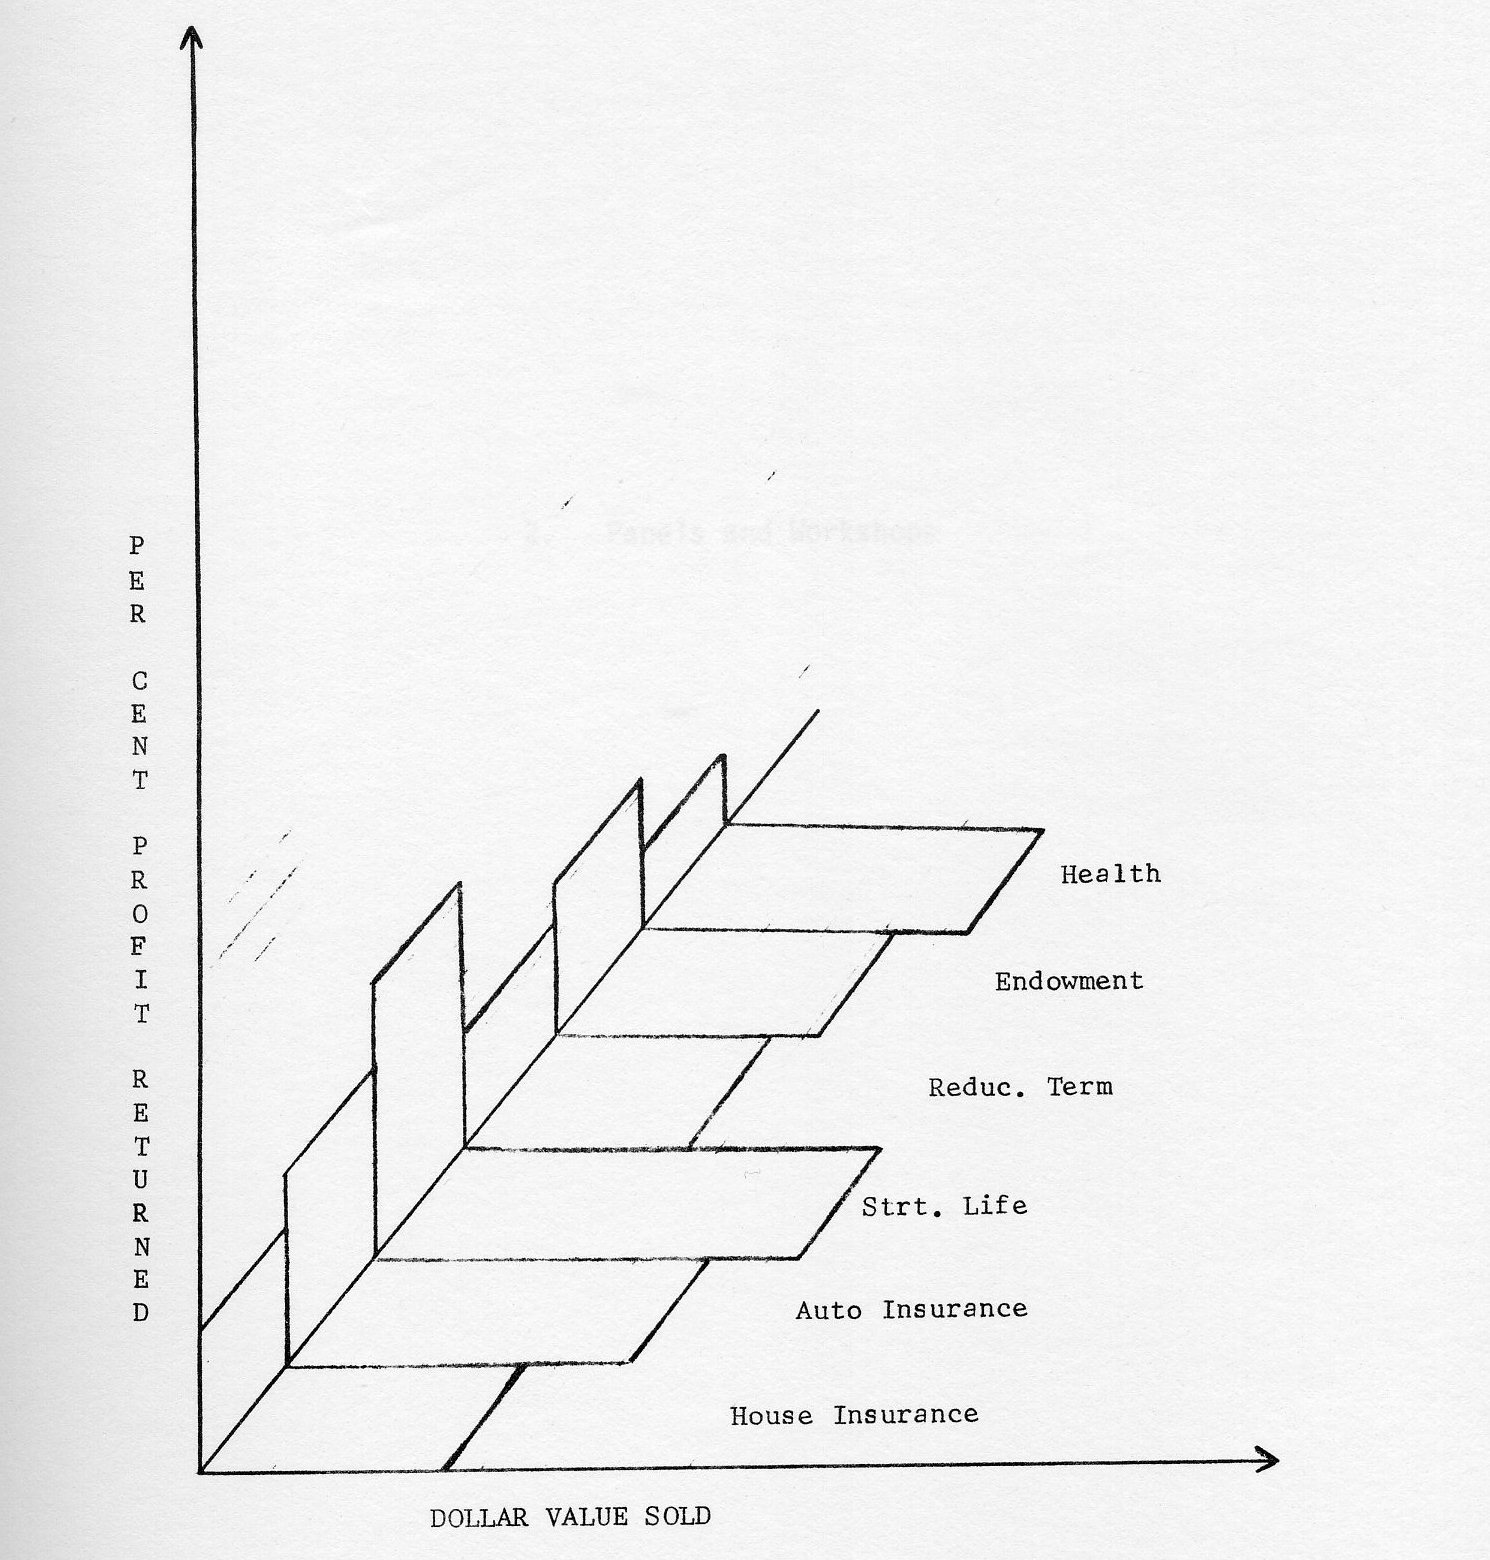
The simple bar chart animation of Figure 4 could be extended to any of several bar chart types, pie charts, statistical maps and charts drawn in projection. Figure 5 is an attempt to show how a frame from such a chart might be designed to allow comparison of disparate quantities.
The cost of generating business animation films depends on a) whether the output represents a new program or merely an increment of effort beyond a currently made computer run, b) the amount, if any, of post computer production work required (say packaging in loops to send to salesmen across the country), c) the general utility of the program for repeated use.
In the end, pursuit of business animation has to be dictated on the basis of an evaluation of the worth of the information displayed versus its cost.
DatagraphiX has announced in the past year a collection of software packages to support its Micromation printers called BEST, Business Equipment Software Techniques. This talk covered the major packages in BEST as far as the purpose, capabilities, limitations, and basic design of each. The individual packages covered included MPS (Micromation Printer System), DOW (DatagraphiX Output Writer), DART (DatagraphiX Automatic Retrieval Techniques), and VIP (Verification of InPut). Each of these packages is better suited to solving a certain class of problem within a particular computer environment. The appropriate types of problems and computer environment was pointed out for each.
Also discussed at some length was the various general approaches to programming for a Micromation printer. These include use of LPS (Line Printer Simulation) versus standard mode data; use of direct generation of Micromation format from the problem program versus post processing; use of offline recorder versus online. The advantages of the Sysout Writer approach used in DOW was especially noted. The problems inherent in fiche management regarding generation of hand readable titles and fiche indexes were reviewed and approaches to solving these problems were discussed.
The session is divided into three segments:
Throughout the evolution of DatagraphiX microfilm recorders, the customer has indicated the needs of the market, primarily through UAIDE. The 4020, the first DatagraphiX commercial microfilm recorder, although developed for scientific work, has straight printing throughput capability of 7,000 lines a minute, ten times faster than the state-of-the-art impact printers. Through application seminars of UAIDE, DatagraphiX (then Data Products Division of Stromberg-Carlson) realized that a market existed for a faster alphanumeric microfilm recorder at a much lower price than the 4020. This information gave birth to the 4400 - DatagraphiX first total alphanumeric business recorder.
Social Security required some additional features on their 4400 such as a Polaroid Camera, faster transfer rates, tape backspace, and write check, so DatagraphiX built the 4410 to fulfill their needs. Another machine, the 4411 with other special features was configured for the Census Bureau about the same time.
These two requests highlighted the fact that a single machine would not take care of the business spectrum's total needs. The DatagraphiX 4360 and DatagraphiX 4440 resulted.
In the past year, several new features have been announced and installed on these two business recorders:
The above six new options have all been tested, installed, and are working satisfactorily. Some design bugs were found as is the case with any new computer equipment. Mr. Reynolds of Bank of Wachovia, was instrumental in helping us uncover a 360 LPS skip immediate space problem. We had designed it skip immediate print.
Two additional features, not options, were also introduced this year as a result of customer demands:
Recently DatagraphiX had made various special engineering modifications for customers. Some of these may have appeal to the general business COM market.
Response to these features will help mold the future of DatagraphiX present product line and possibly the next generation of Micromation.
One of the tasks of the Business Systems Committee is to provide a medium for the mutual exchange of information concerning business applications. The main objective of this workshop is to determine the problems of micromation systems documentation, and to update the purposes and objectives of current efforts to develop a business system manual within UAIDE.
During the past year, the business systems committee has attempted to accumulate documentation to be used in the proposed manual. A first attempt was made on September 18, 1969 by the Michigan Chapter of UAIDE. At the last board meeting, each of the UAIDE board members were questioned to determined the purpose and objective of a business systems manual. No one would agree on just what was the intent of the manual.
The proposed business systems manual was considered in terms of what role this type of documentation must play. What type of audience are we considering?
(The audience was asked to comment on the role of a business systems manual based on various audience levels.)
After the audience levels were determined, the chairman handed out the objective setting worksheet, and the content sheet of the business systems manual proposed by the Michigan Chapter.
Accumulate and maintain a Business Systems Committee (BSC) Manual. This manual will have five sections, each section being a consolidation of documentation submitted by UAIDE member. The sections and their content follow:
Name:     ________________
Company:  ________________
The following items are considered to be important in terms of providing information to the interested reader. Circle those topics which you think should be included. Draw a line through the items which should not be included and add new topics to the bottom of the list.
Name:     ________________
Company:  ________________
The following items are considered to be important in terms of providing information to the Systems Analyst. Circle those items which you think should be included. Draw a line through those items which should not appear and add new items to the bottom of the list.
Name:     ________________
Company:  ________________
The following items are considered to be important in terms of providing information to the programmer. Circle those items which you think should be included. Draw a line through those items which should not appear and add new items to the bottom of the list.
Name:     ________________
Company:  ________________
The following items are considered to be important in terms of providing information to the COM equipment operator. Circle those items which you think should be included. Draw a line through those items which should not appear and add new items to the bottom of the list.
The chairman stated that this panel would be a continuation of the workshop on Business System Documentation held on Tuesday, October 20, 1970. The purpose of the panel discussion was to uncover those topics which need to be added to the system manual.
The panelists were asked to discuss:
Tom Doran - Chairman
"Tink" Henry
Wayne Hilton
Anzelo Zanis
R. Peoples - Chairman
J. Voltiner
R. Quinn
E. Zamula
M. Bickerton
J. Landermilk
W. Kidd
R. Conti - Chairman
D. Gust
M. Woods
A. Smith
A. Collard - Chairman
R. Reynolds III
H. Brown
N. Stable
H. Wallech
B. Walton
The following items are considered to be important in terms of providing information to the interested reader.
CONSIDERATIONS IN DESIGNING A MICROFILM SYSTEM
CONSIDERATIONS FOR PROGRAMMING A MICROFILM SYSTEM
The first seven items listed below are your original suggestions relative to providing information to the COM equipment operator. These are supplemented with the comments of the subcommittee members.
It is proposed that the Business System Committee develop, as part of its manual, some guidelines aimed at managers of entities since they determine ultimately how effective microfilm will be in their organization.
The guidelines would, in non technical terms, explain:

Panelists:
Harley Brown  - Datagraphix
Robert Conte  - Insurance Company of North America
G. Tink Henry - Oldsmobile Division of G.M.
Harry Wade    - Social Security Administration
Angelo Zannis - Ford Motor Company
This morning I will be describing to you how we are helping the Stockholder Records Department at Ford get out from under the avalanche of paper produced by today's computers.
During the past five years, the stock market has experienced wide fluctuations in share trading volume. There have been several days in which 19 million or more shares have changed hands. More recently, the market has hit trading volumes where 8 million shares were considered to be a good day's activity. We've read or heard of the paper log jams of 1966 through 1968, resulting from the deluge of persons entering the market - and of the steps taken by the brokerage houses to expand their back room facilities to handle the volume. Brokerage houses today have been forced to curtail their expansion efforts due to a lack of activity. The paper explosion and activity fluctuations in the brokerage houses had a ripple but direct affect on the transfer and record keeping operations performed by banks and by individual companies set up to handle their own Stockholder Record Operations.
At the end of 1966, we at Ford revised our Stockholder Record Keeping System into a highly sophisticated computerized operation that, among other things, is responsive to the demands created by fluctuations in activity volume. In changing the system, we also expanded our Stockholder data base to incorporate far more comprehensive transaction information within one master file. The expanded data base enabled us to develop other sub-systems related to stockholders that had previously been handled manually or on simple EDP equipment. Our discussion today concerns itself with a description of the evolutionary - or perhaps a more vivid adjective metamorphic change brought about in one of these sub-systems - The Proxy System.
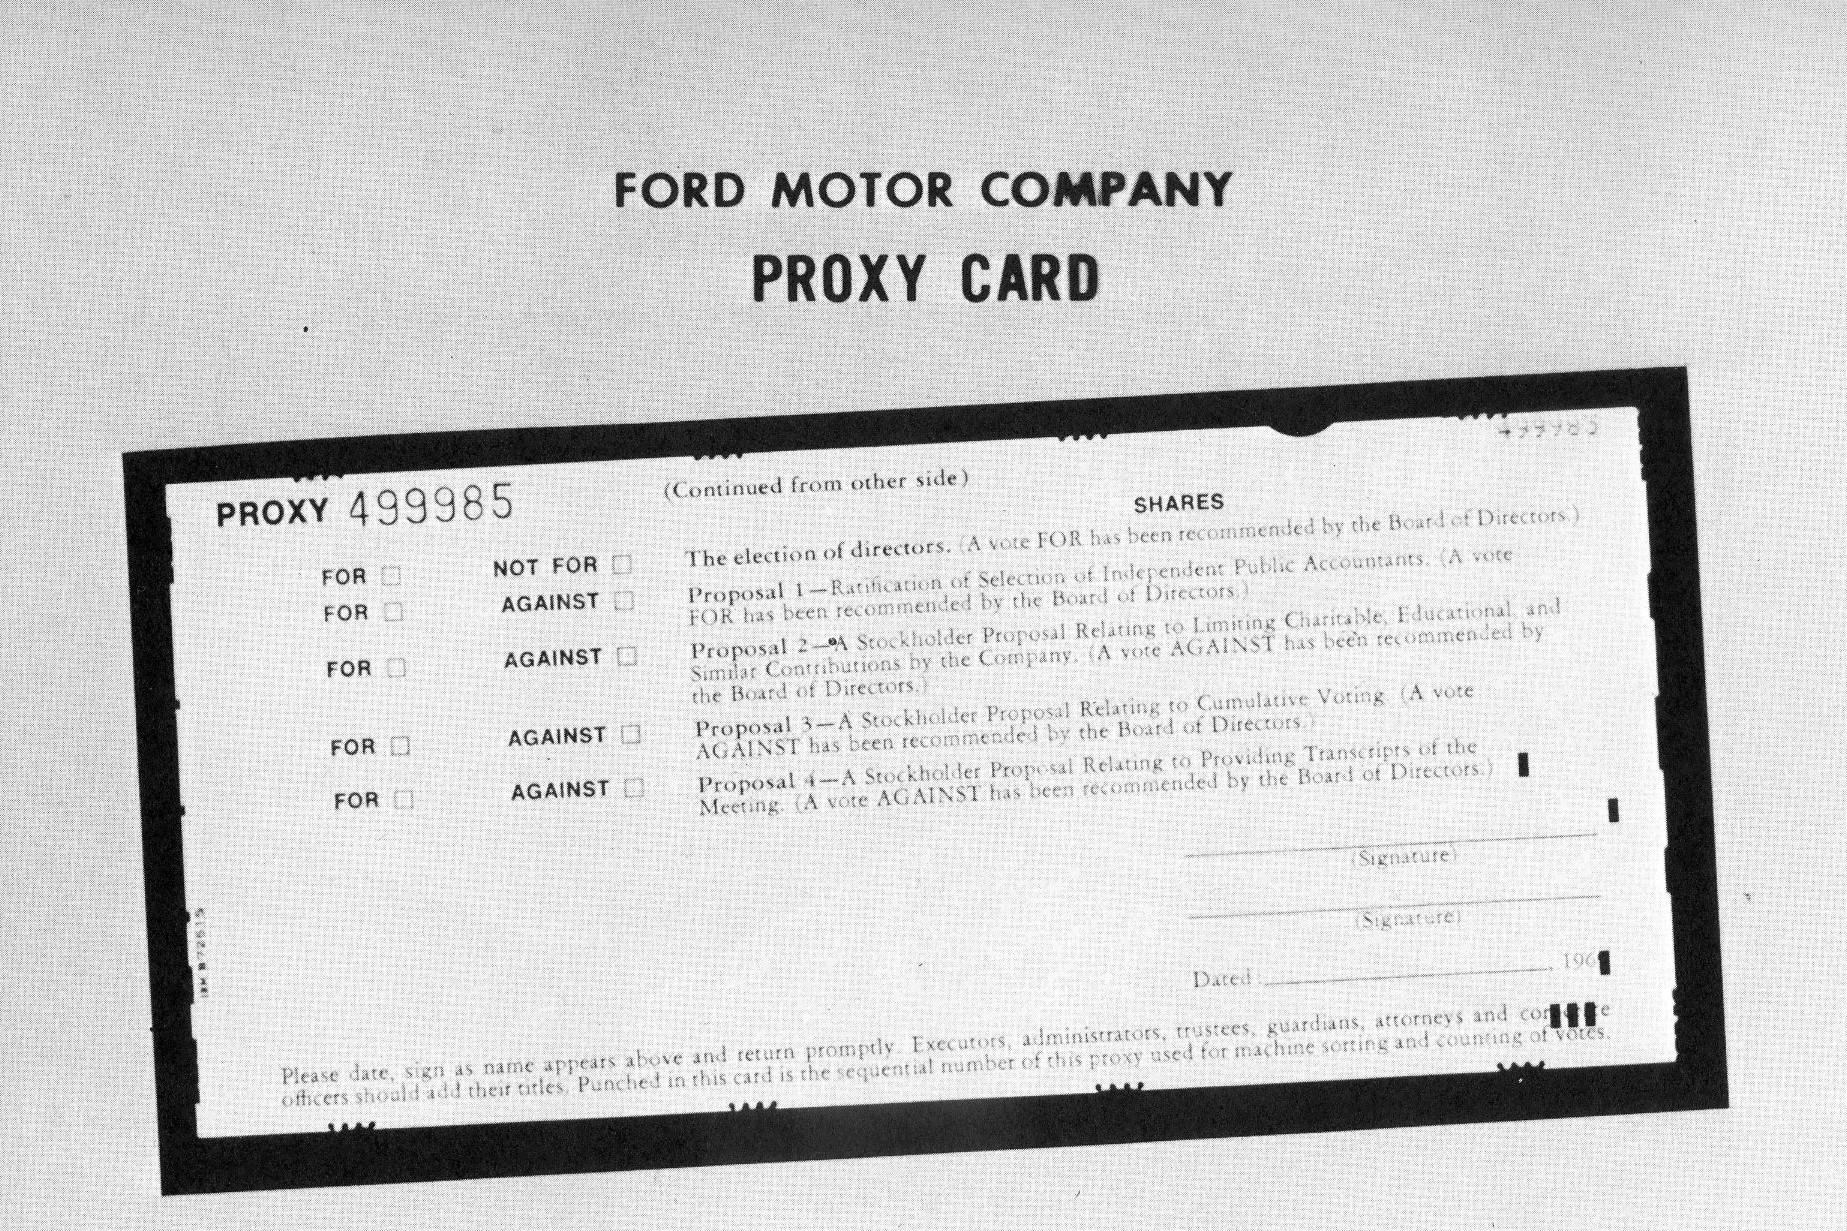
Consistent with other companies, the Ford Motor Company holds an annual stockholders meeting. Every stockholder is invited. Our meetings are held in the Ford Auditorium located in downtown Detroit - about 12 miles from our Central Corporate Office. Approximately 1,200-1,500 people attend these meetings each year. At the meeting, the events of the preceding year and forecast objectives and developments for the coming year are discussed. In addition, a portion of the meeting is set aside to enable stockholders to cast their ballots on proposals brought before them by management and individual stockholders. Stockholders have the option of mailing in their proxies prior to the meeting or casting their ballots at the meeting.
The Administrative activities performed by the Stockholder Records Department with respect to the Annual Meeting can be divided into two time phases.
The first phase includes those activities performed prior to the day of the meeting. They include:
The second phase includes those activities unique to the day of the meeting. These include:
In observing the operating system used in 1966 on the day of the meeting, we noticed:
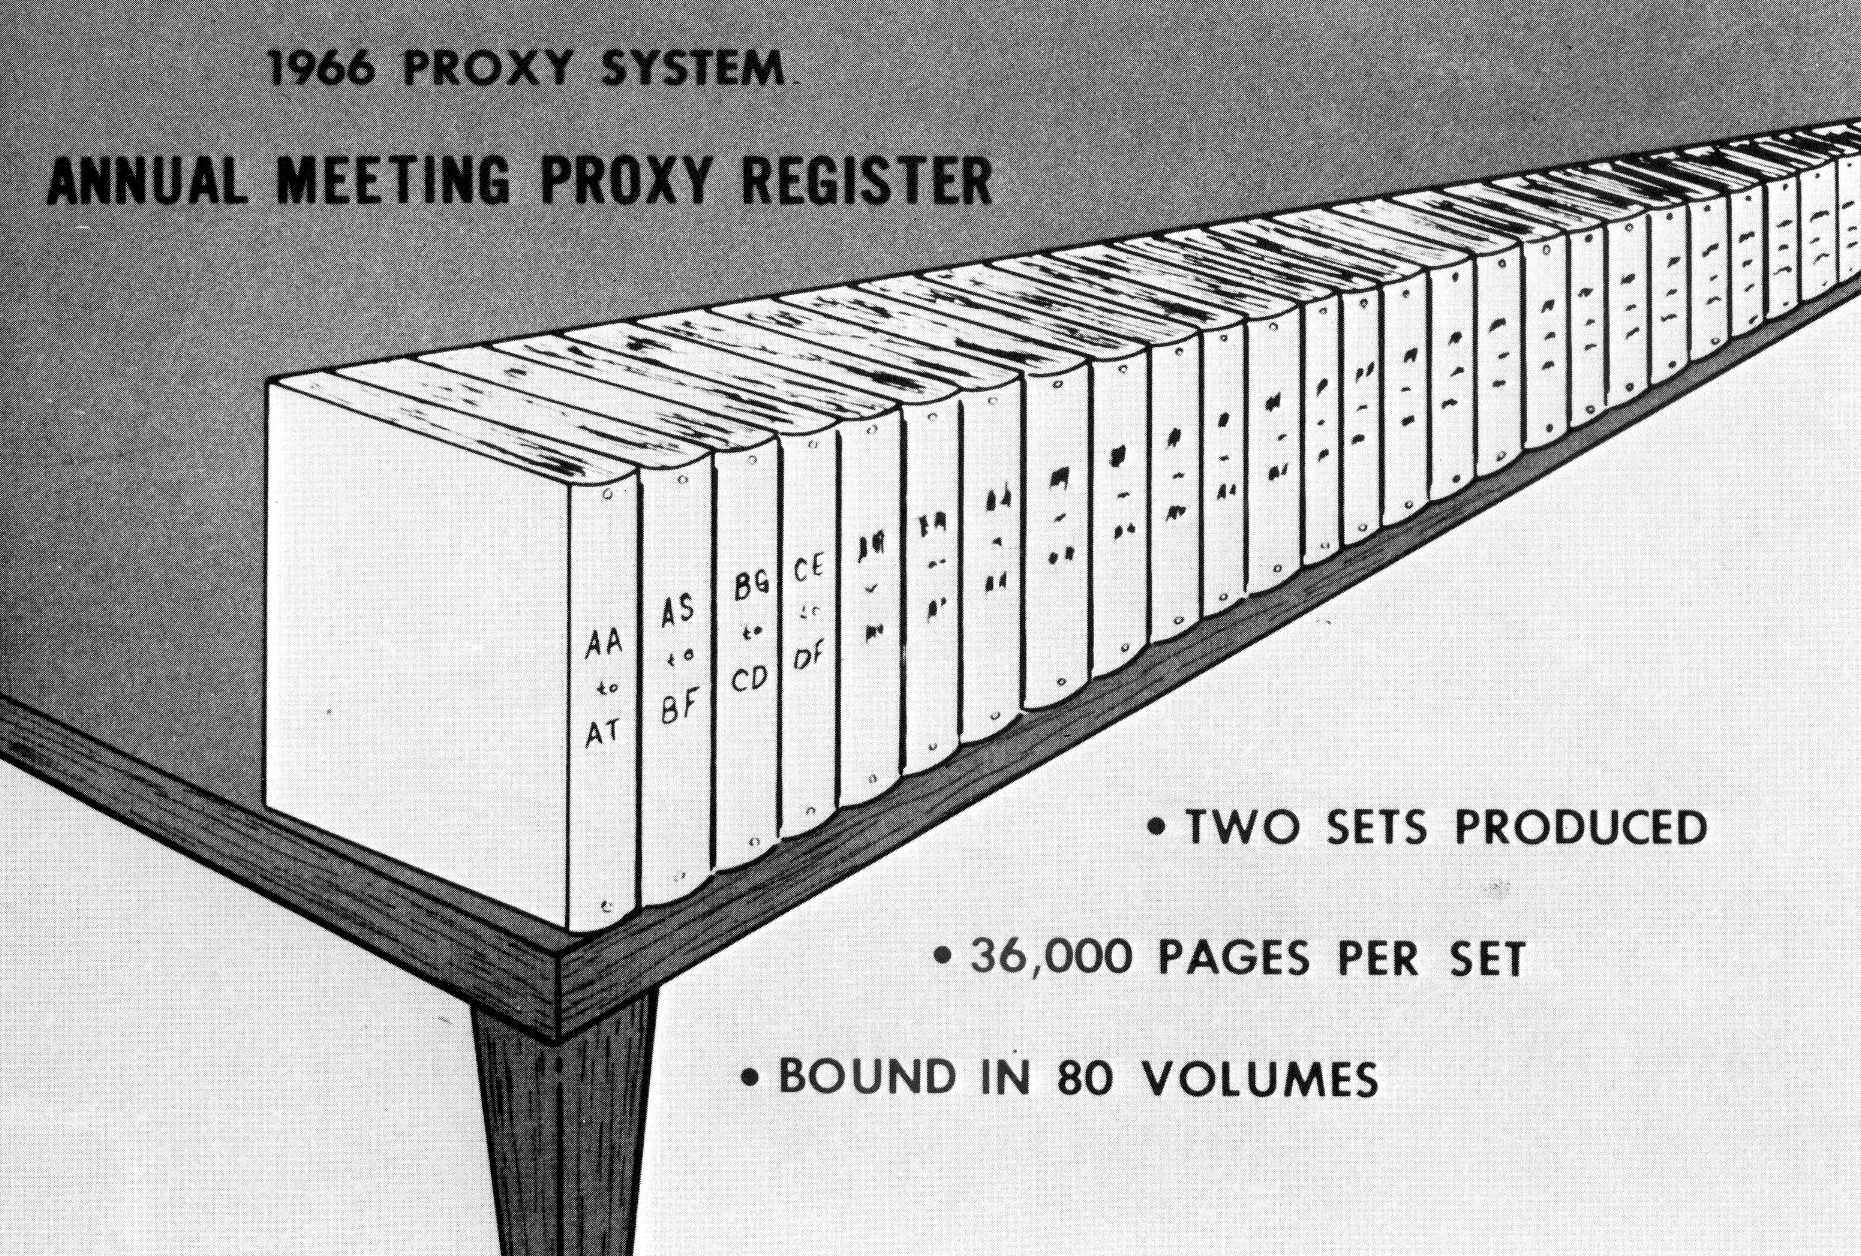
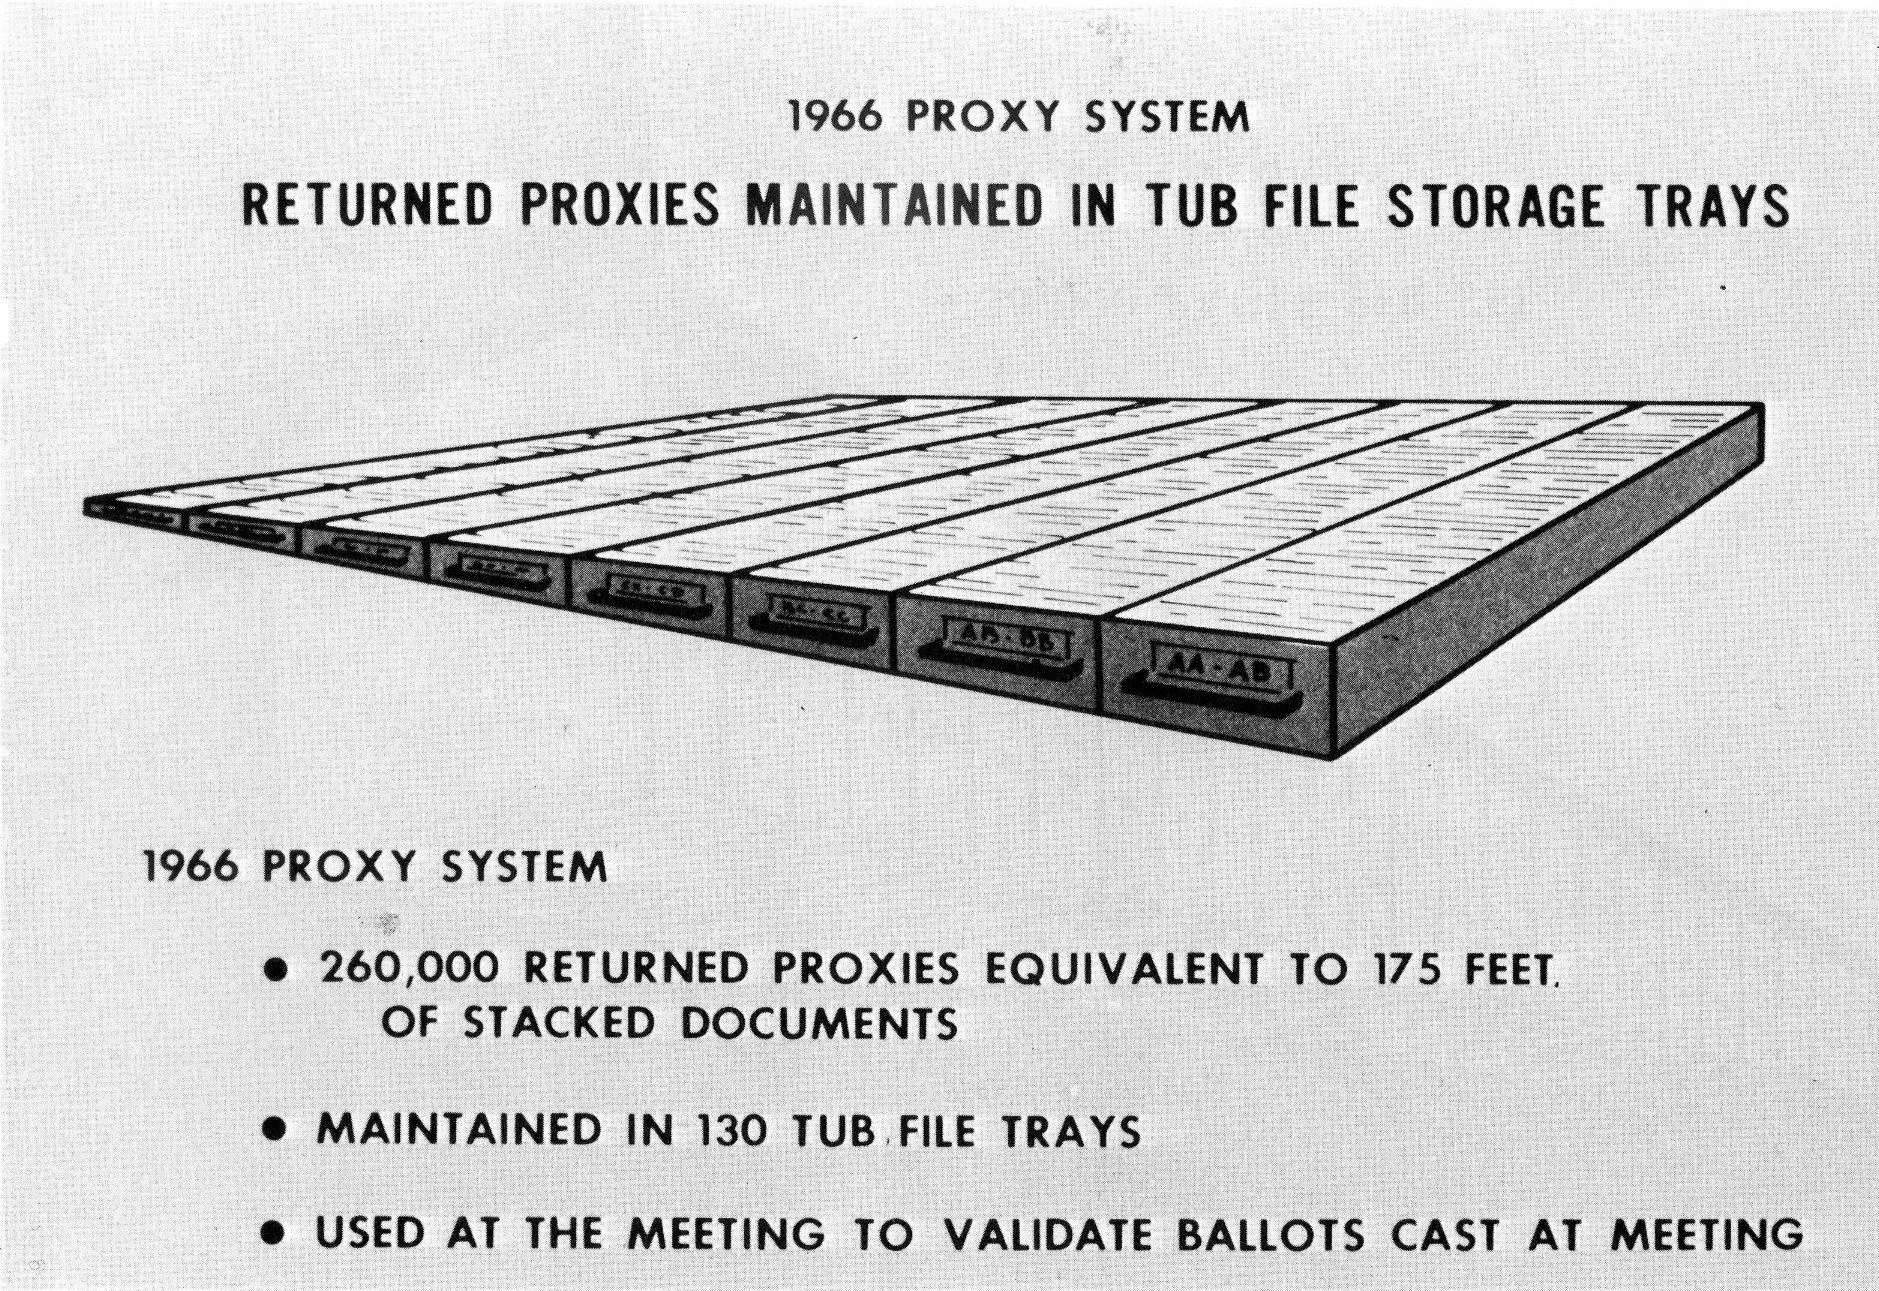
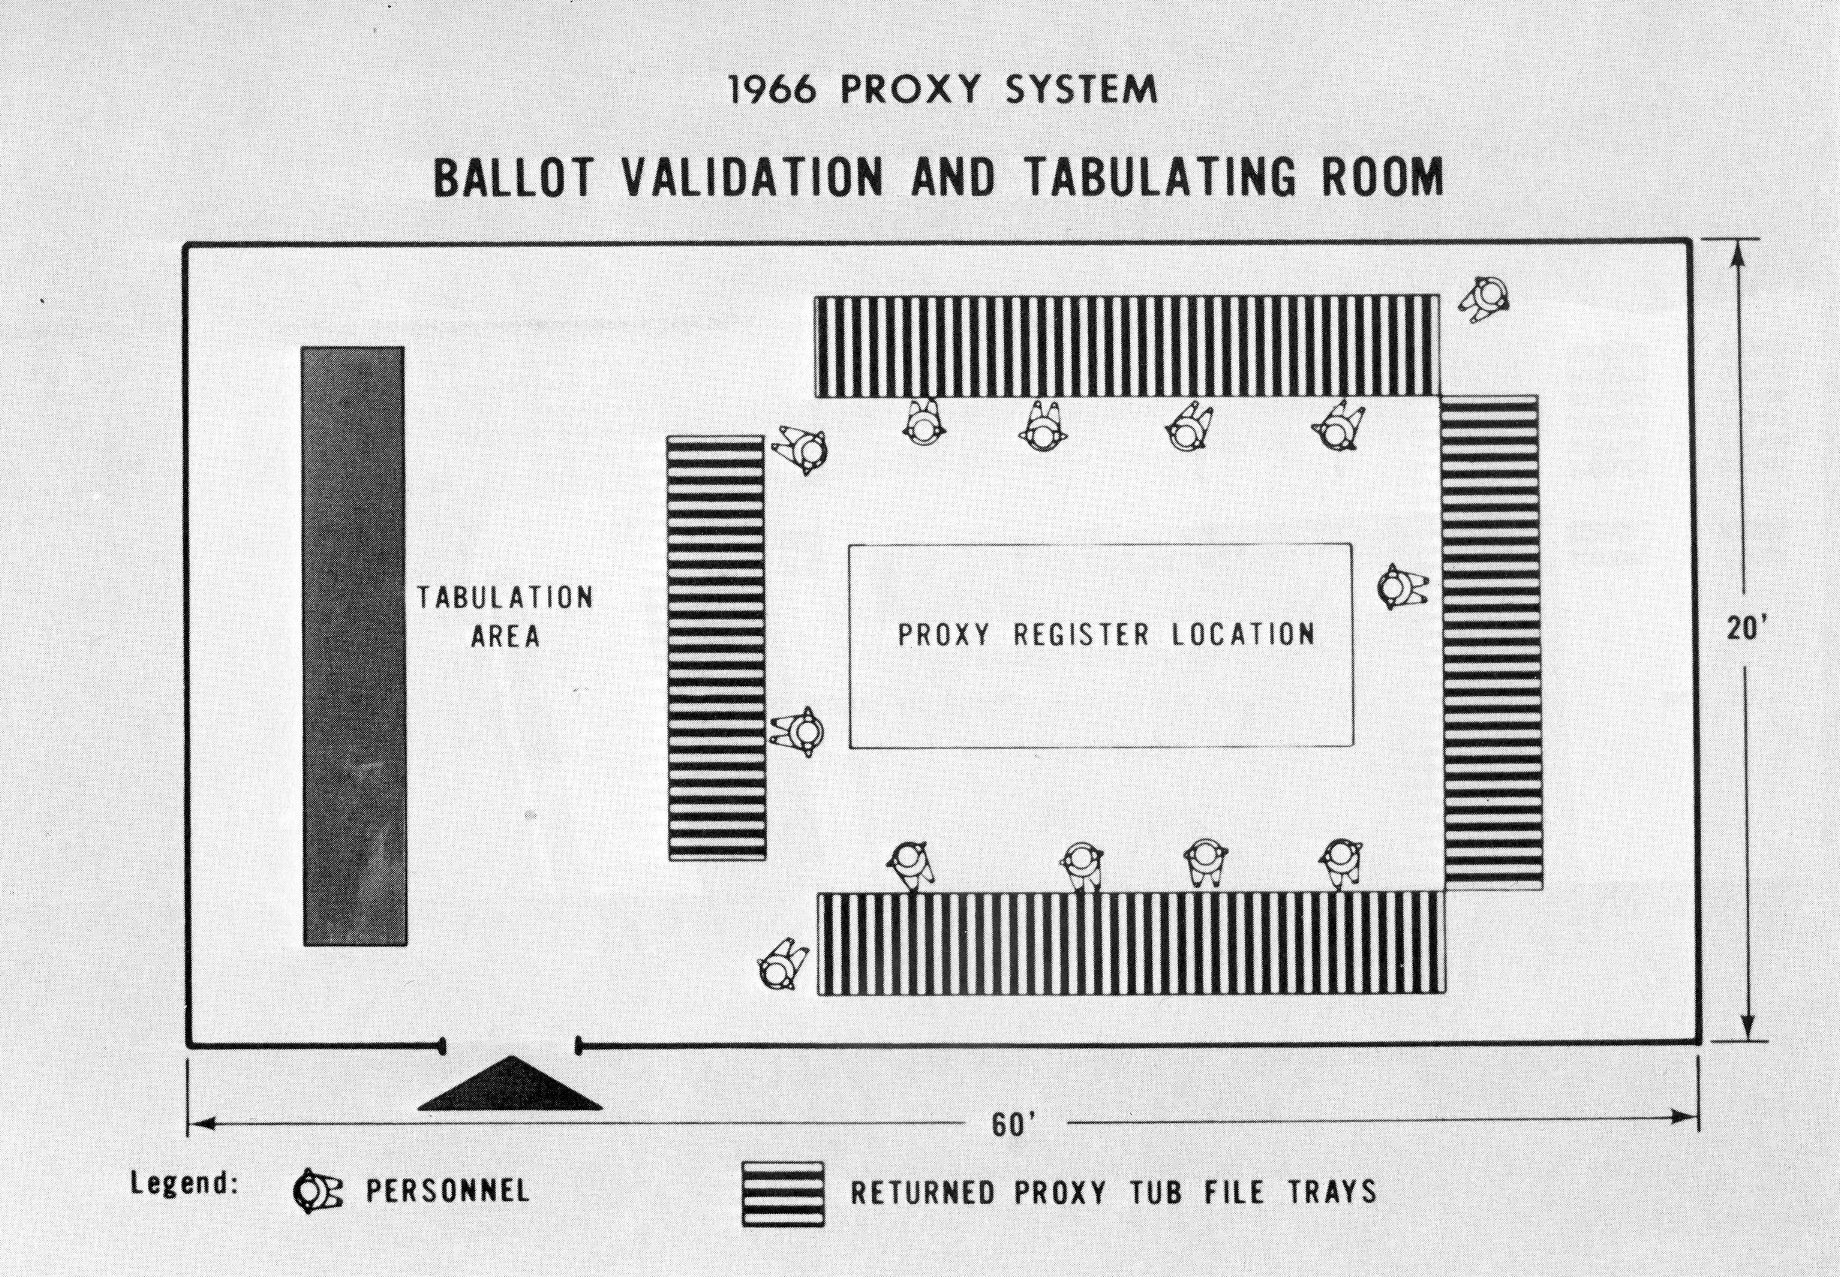
To summarise, the 1966 operation I have described was costly, cumbersome, required a substantial amount of manual effort, and the retrieval time was agonizingly slow.
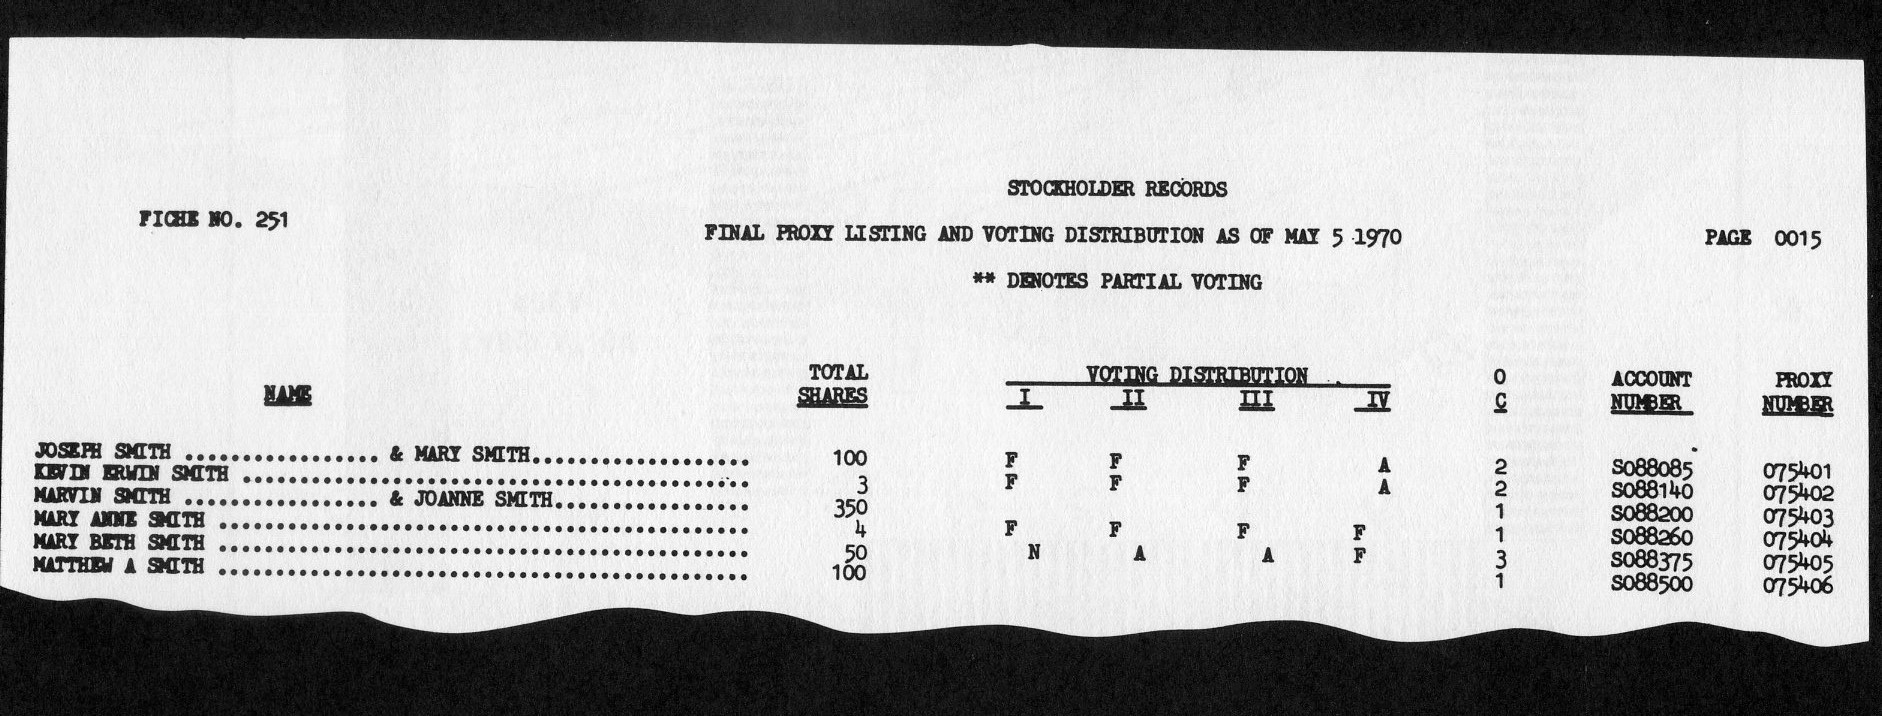
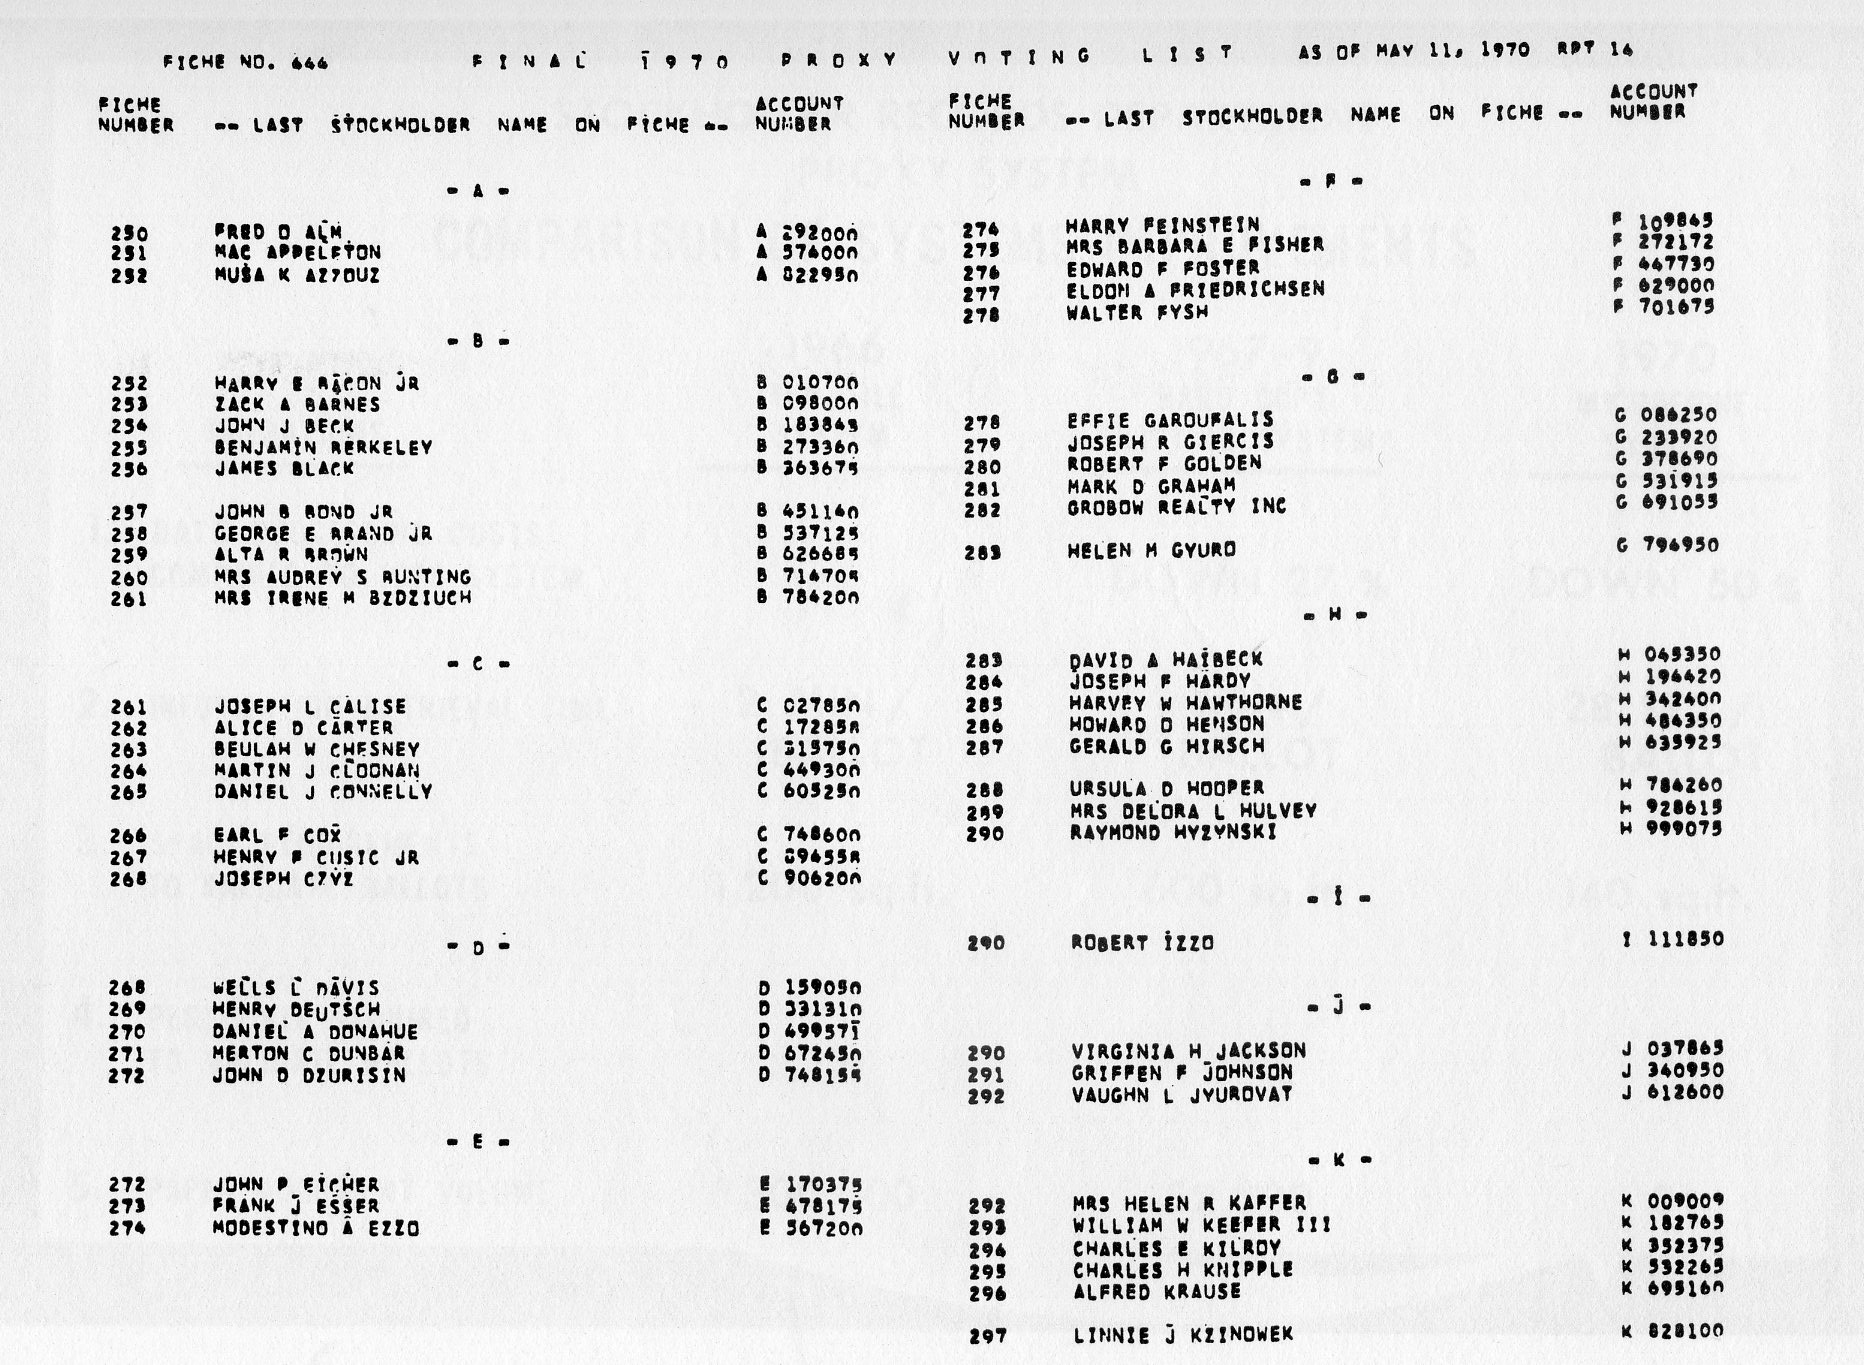
We changed that system. The system designed for the 1967 meeting eliminated the need for using the actual returned proxy cards in the validation procedure. Instead, a 16,000-page Final Voting list produced by computer was provided to replace the quarter of a million proxies. This listing indicated whether or not a proxy had been returned for each stockholder. It also showed how each proposal appearing on the proxy card had been voted (Fig. 6).
Installation of the revised system provided several benefits:
Subtle modifications to the computer programs in 1968 and 1969 improved computer process throughput time and also provided the Stockholder Records Department with more comprehensive statistical reports. Although the changes brought about by the revised paper system improved the efficiency of the operation, the large volume of printed data still made stockholder identification and ballot validation both costly and cumbersome. During the winter of 1969, we began exploring the possibility of using microfilm to replace the paper-generated Proxy Register and Proxy Voting list.
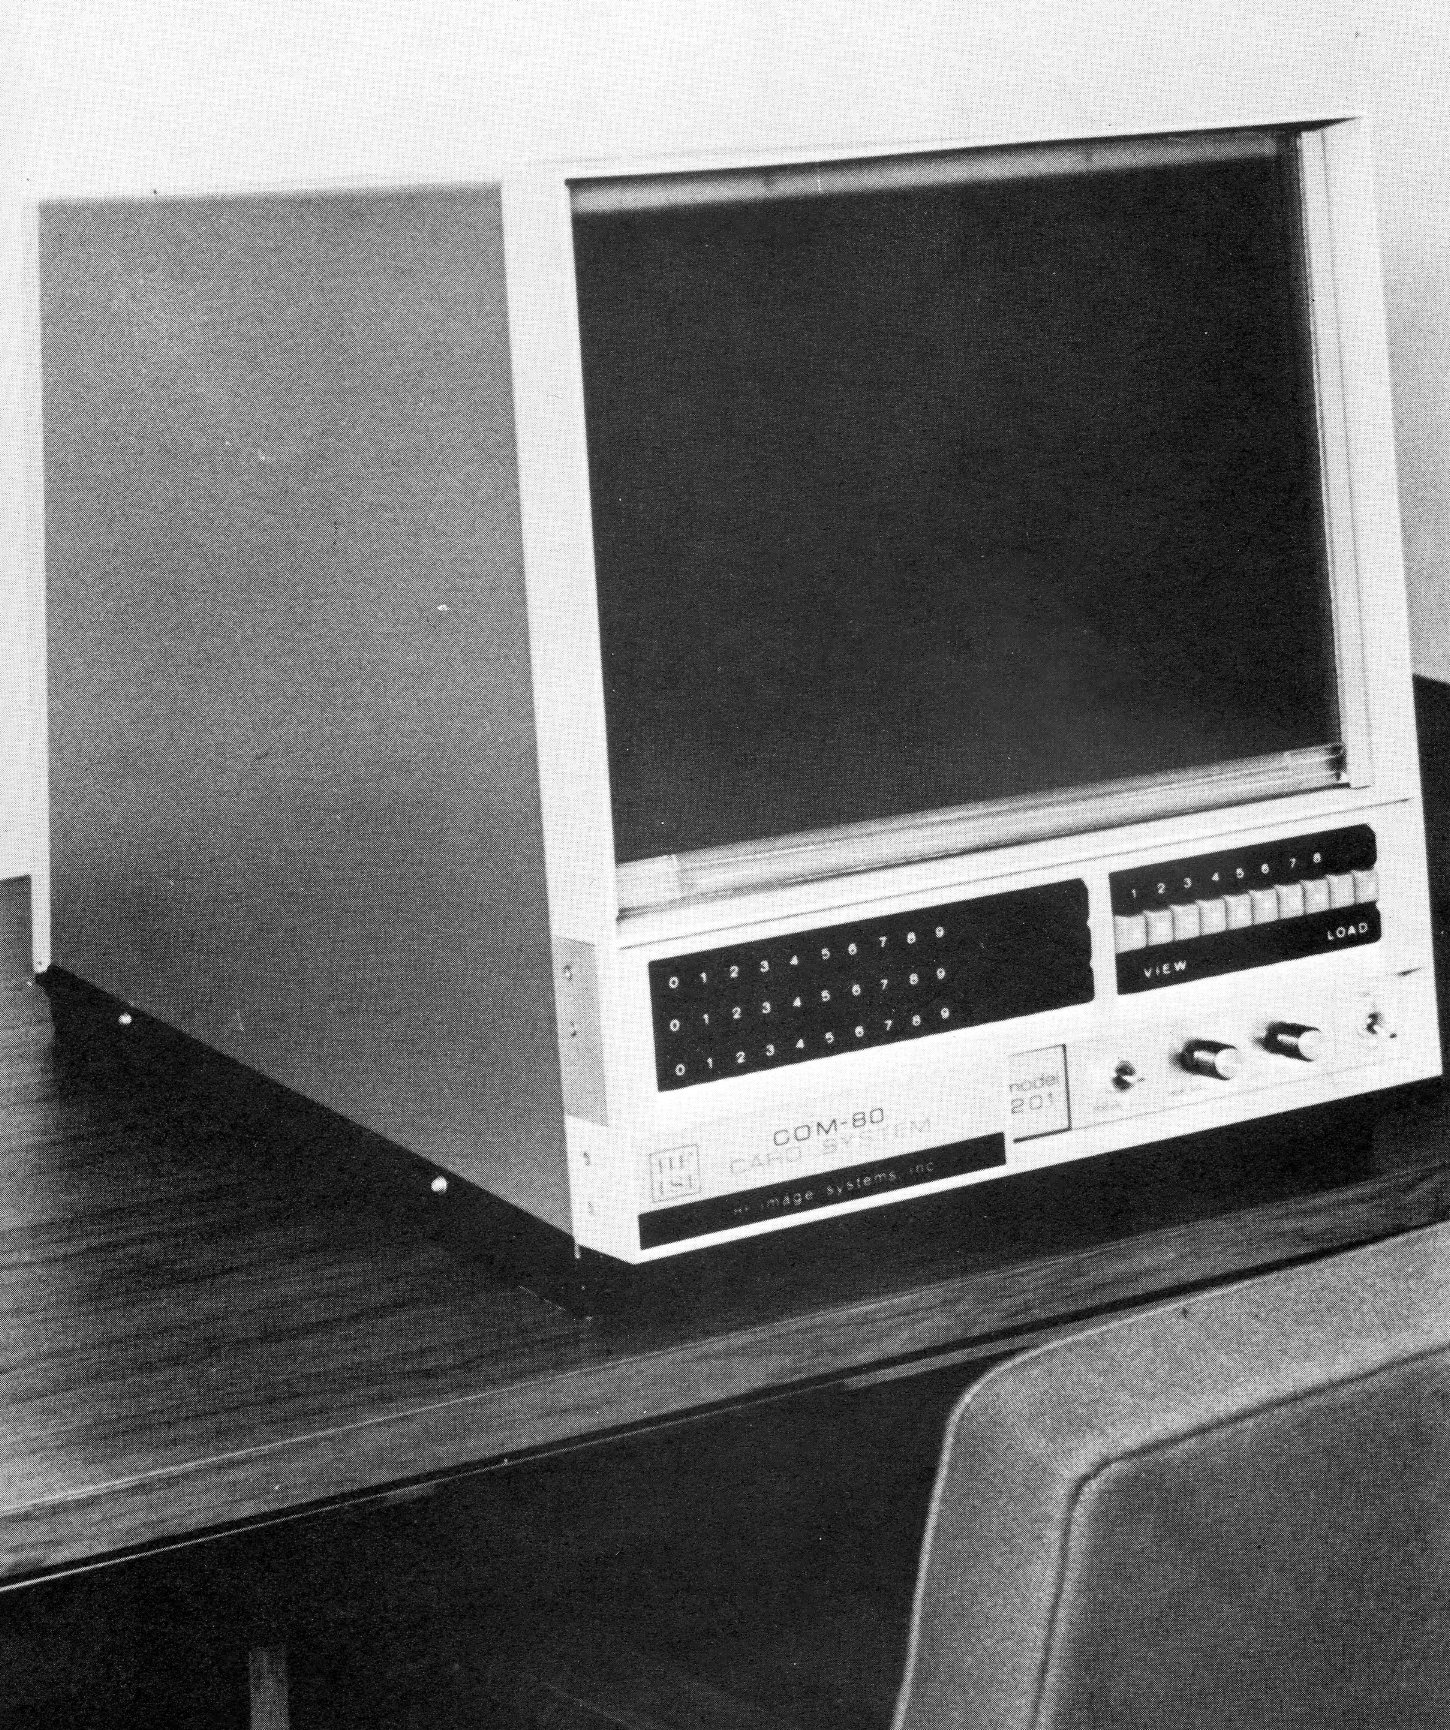
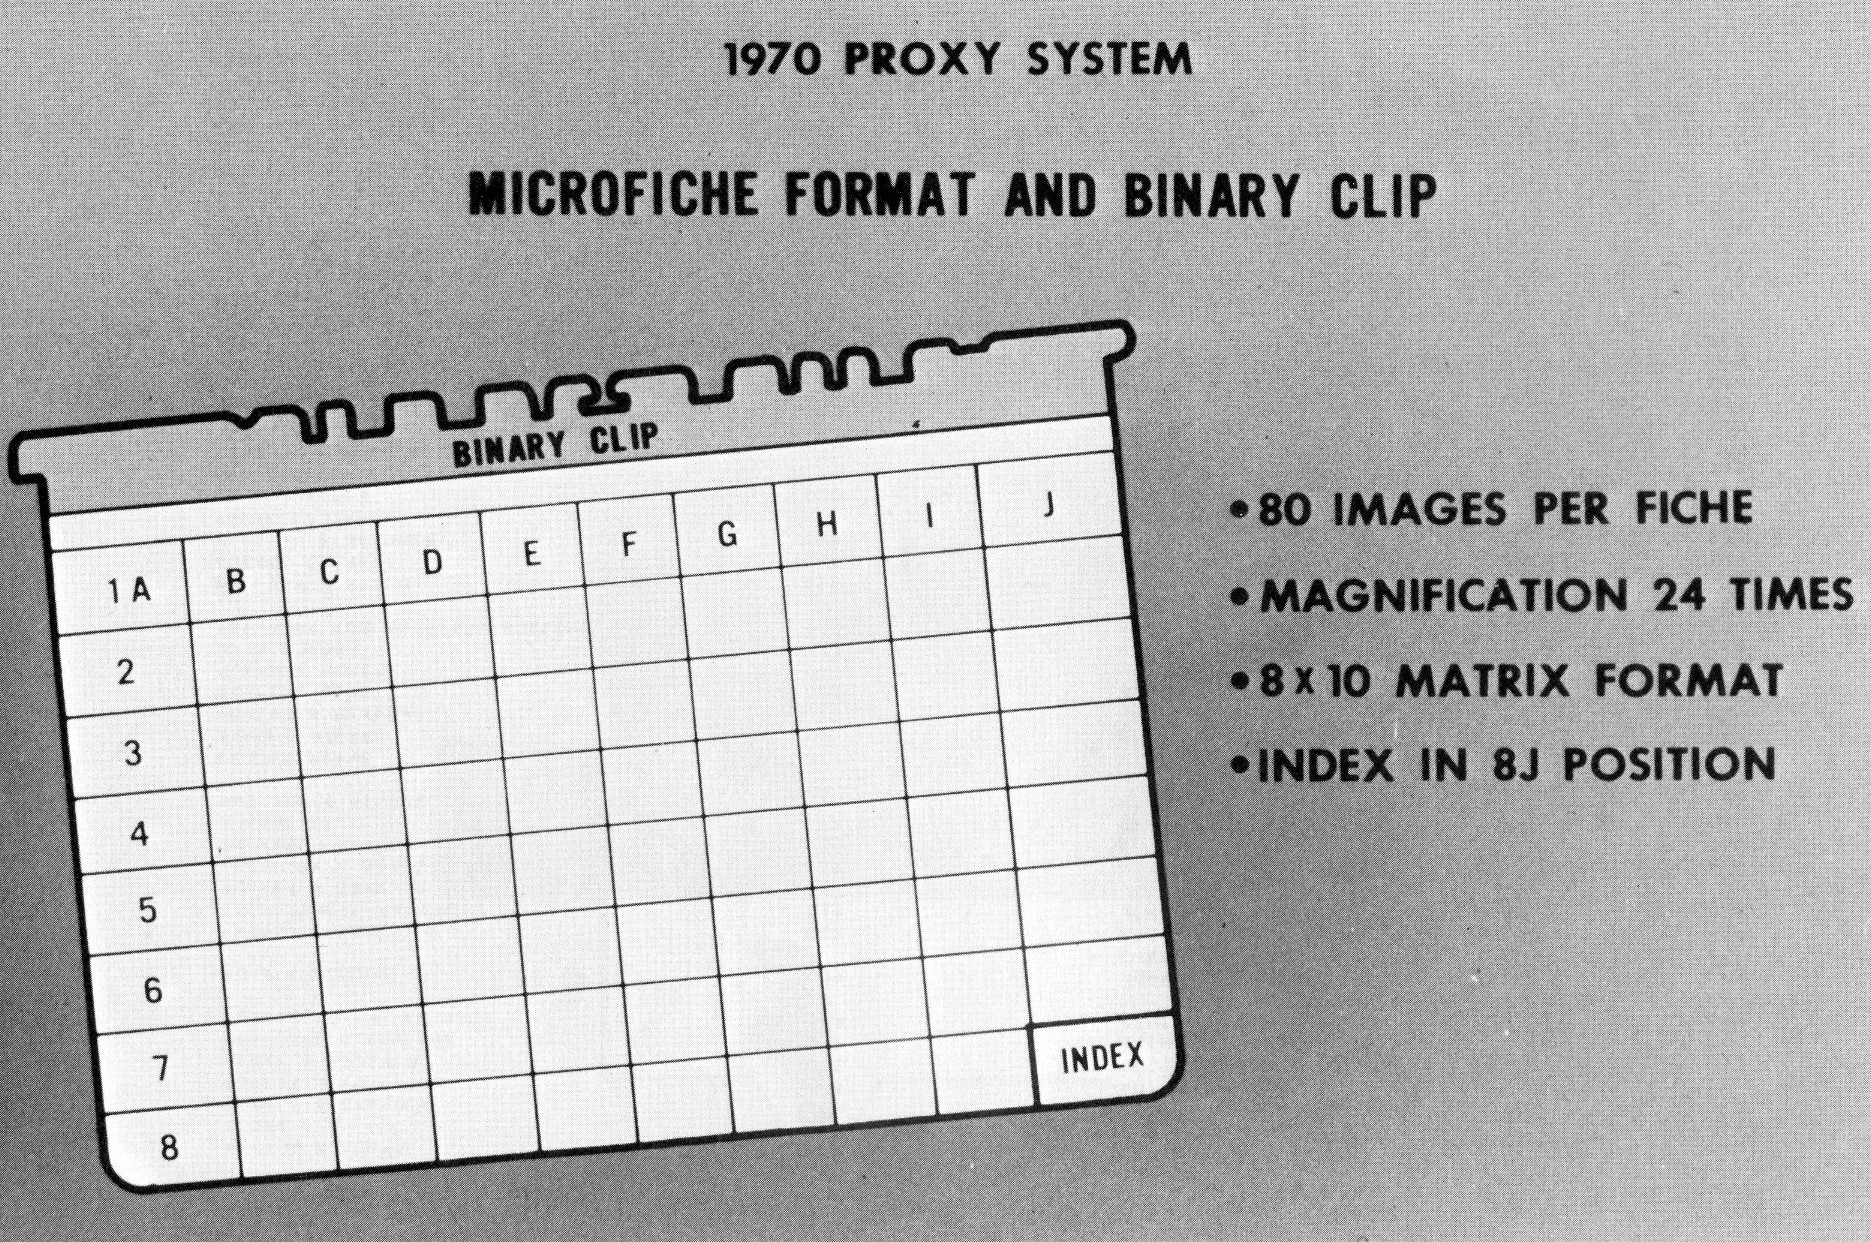
The heart of this system was, of course, the microfilm reader. Our specifications were very demanding - the reader had to be portable, easily operated, have random access capability, have absolute file security, be reasonably inexpensive and reliable. After evaluating several microform methods and readers, we decided that the system be designed around an Image Systems Microfiche CARD reader (Fig. 7). For those of you unfamiliar with this equipment, allow me to digress a few moments to describe it to you. As you can see on the slide, the device is a desk-top, self-contained microfiche reader. Up to 750 microfiche, equivalent to 60,000 11" × 14" pages, can be stored in a carousel housed within the reader. Accessing a page of data is accomplished by pressing a combination of three fiche locator keys positioned on the left-hand side of the control panel located at the front of the machine. When the keys are pressed, a selection cycle is initiated, activating the carousel until the desired fiche is located and projected on the screen. The first microfiche image brought up on the screen is normally the index page for that particular fiche. To find a specific page, one need only press the X and Y page coordinate keys on the right of the keyboard and the desired page will appear. Depending on how good one is at pushing the buttons, one can locate any page within 20-30 seconds. The fiche is located by a binary-coded metal strip attached to the top of the fiche. A total of eighty images can be placed on one fiche in an image matrix of 8 down and 10 across (Fig. 8).
In January 1970, a Stromberg DatagraphiX 4400 COM unit with a universal camera, giving us computer data microfilm microfiche capability, was installed at our central data processing center.
Having selected the reader and having in-house capability to generate COM microfiche, we undertook with Stockholder Records to put in a system that would produce the 36,000-page Proxy Register and the 16,000-page Final Voting List on microfiche instead of hard copy. It was obvious that the use of microfilm would lower data processing costs, increase file security, and reduce retrieval time for stockholder identification and ballot validation.
As a by-product of the rapid retrieval feature of the system, we were in a position to make a positive identification of every person wishing to enter the meeting without a ticket. This rapid retrieval feature appealed to our management who were concerned about having unauthorized people attending the meeting. Quite frankly, we thought we might experience demonstrations just as other major companies were experiencing during their 1970 annual stockholder meetings. Approval to install the system was given about three weeks before we had to mail out the proxies.
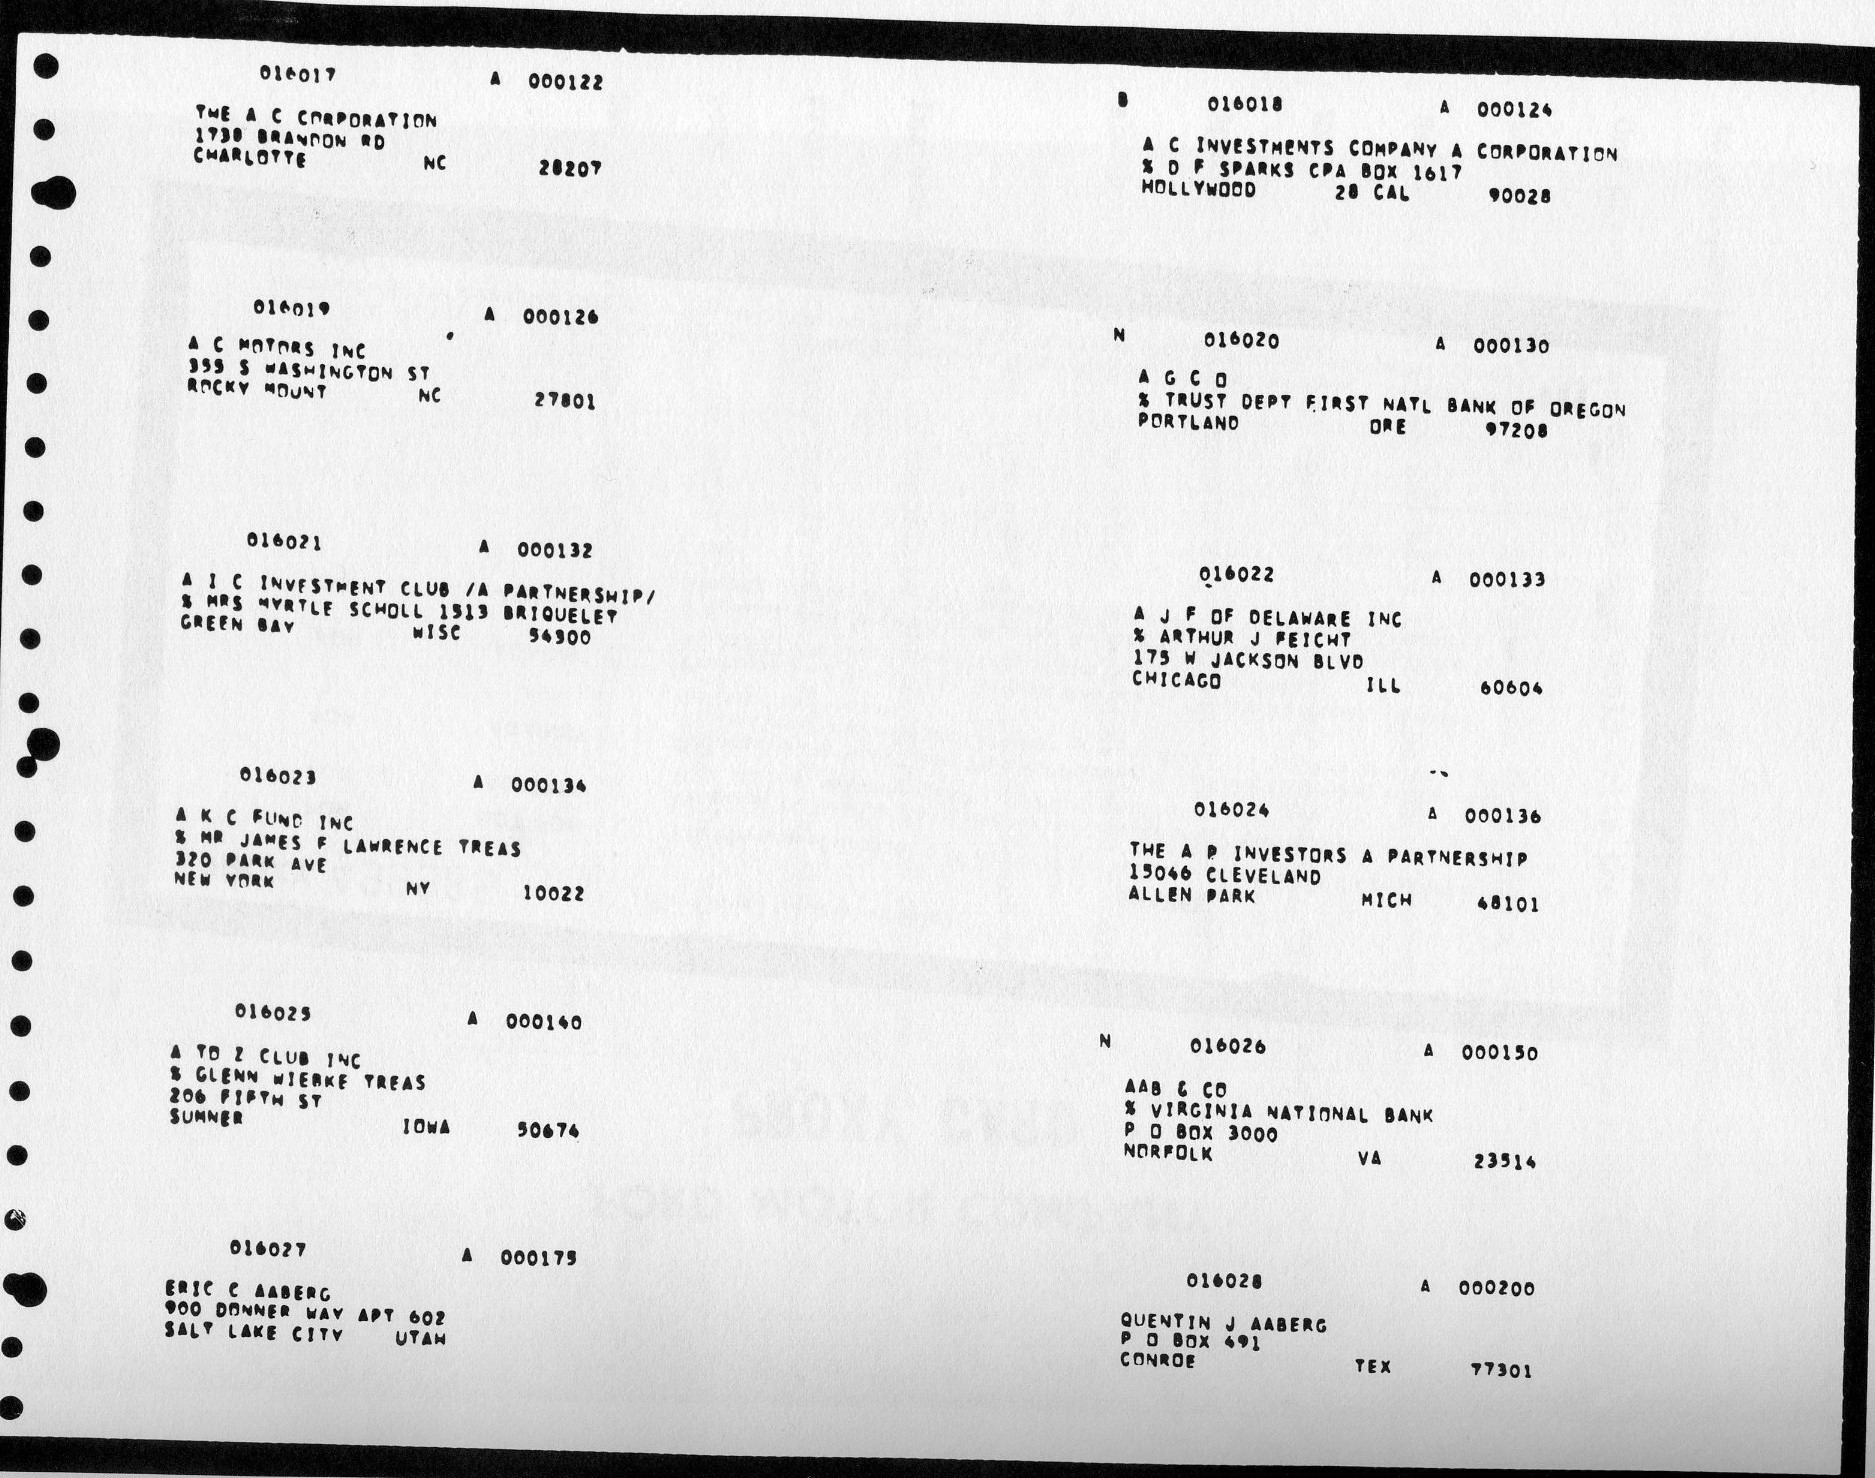
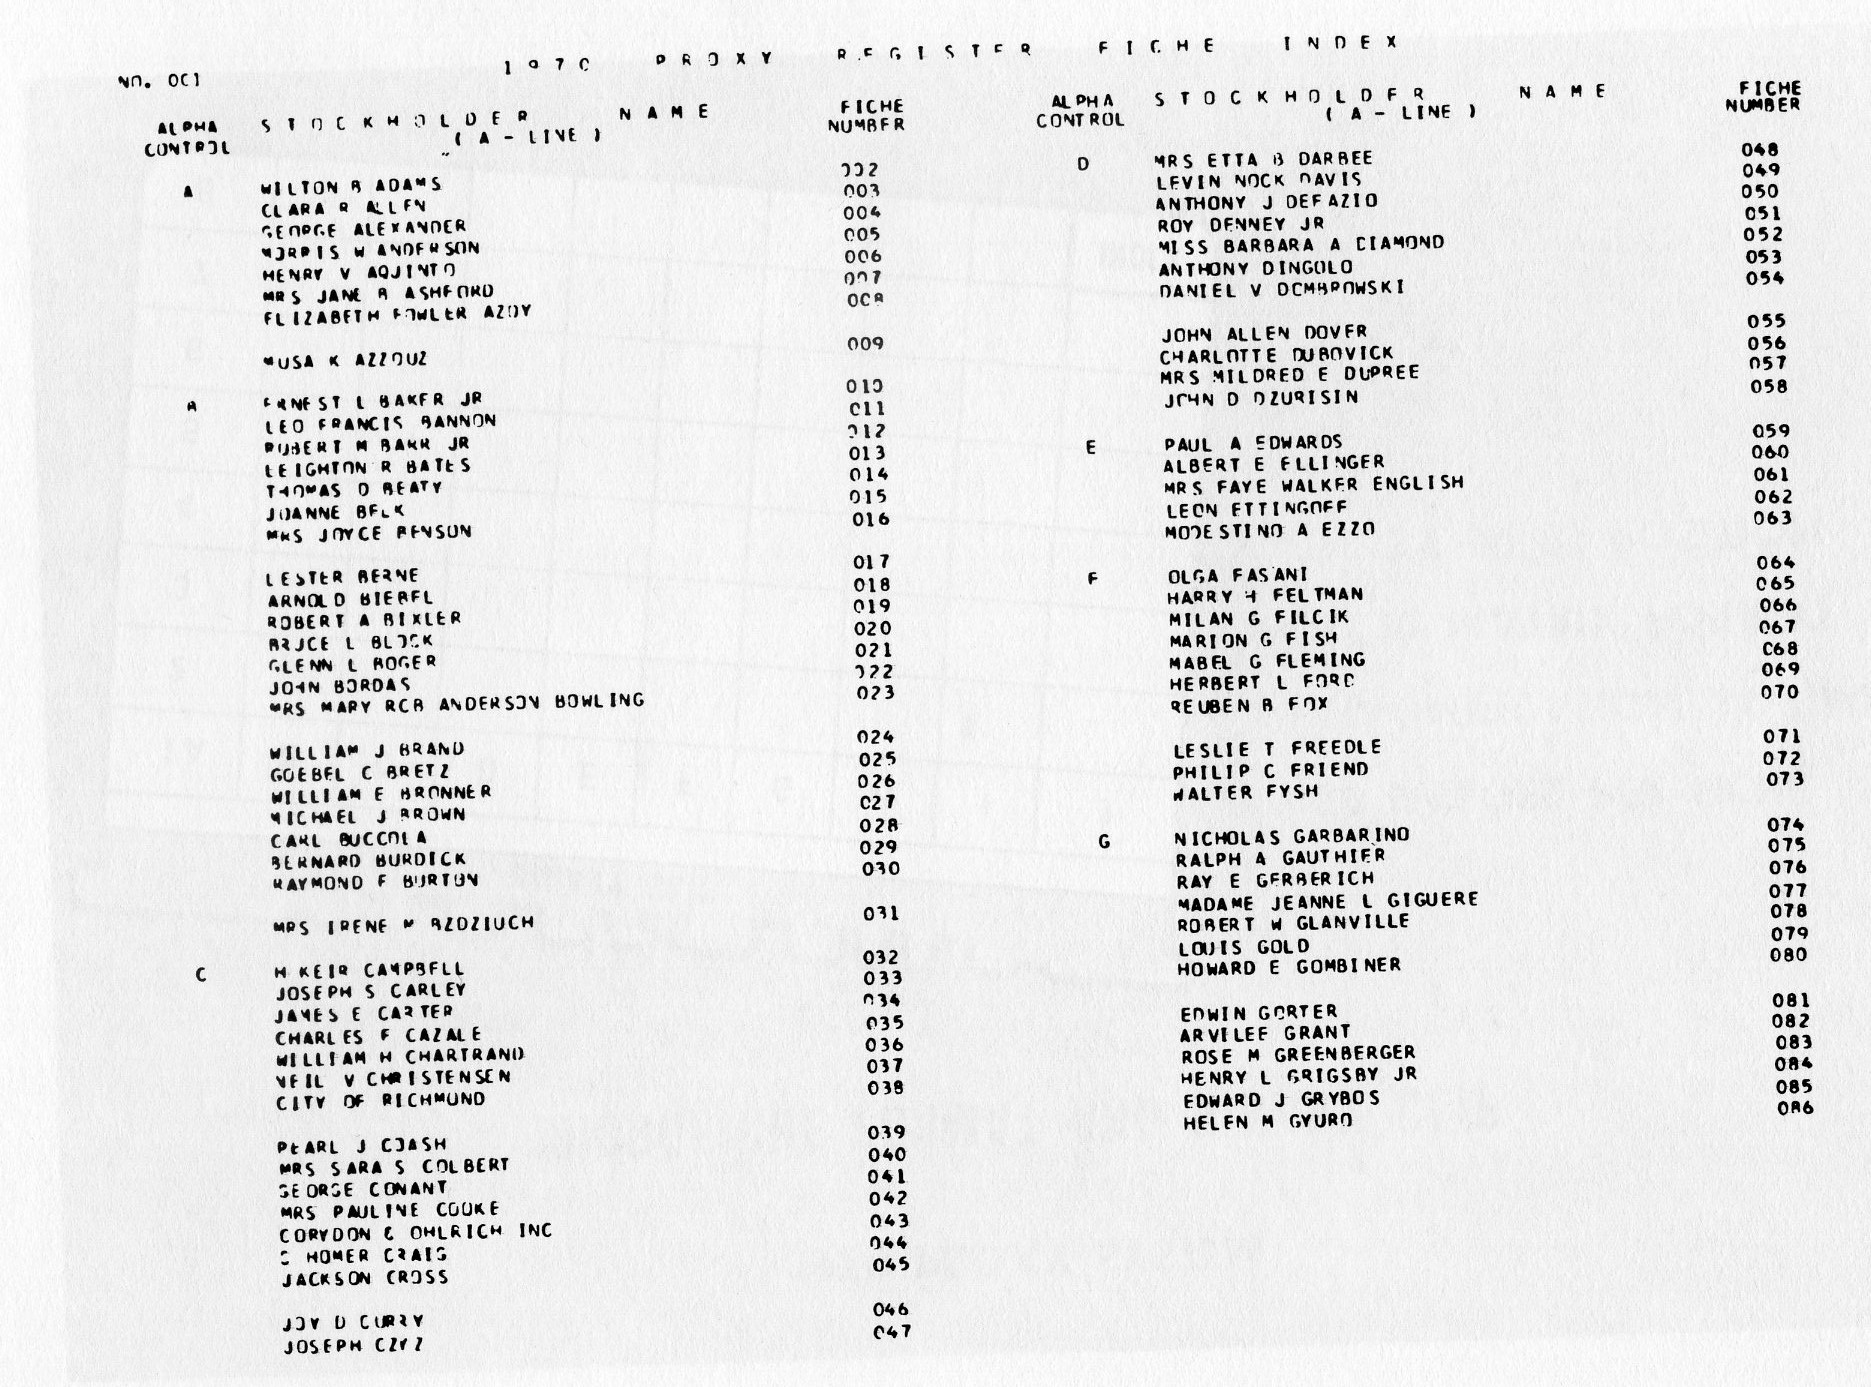
Our first step in designing the system was to develop a set of indexes to be used in retrieving individual stockholder proxy data from the 400,OOO proxy records contained on the file. The logic used to develop the indexes for both the Register and the Final Voting list was identical. Since all of the fiche were housed in the reader and fiche titling could not be used to select a particular fiche, a master fiche index had to be developed. To do this, we captured the name of the last stockholder appearing on each image of the Proxy Register and the image coordinate in core as we formatted the report on magnetic tape. When the 79th name, representing the 79th image, was accumulated, a page index was written for that particular fiche. At the same time, the last name contained on the fiche was placed in another work-in-storage area together with its corresponding fiche number. When the last data fiche was formatted, a master fiche index was produced (Fig. 9). The fiche master indexes for both the Proxy Register and Final Voting List were also produced on hard copy.
Most new systems experience a certain amount of launching problems. The Proxy System was no exception. The systems design and program development phases were accomplished without incident - and ahead of schedule. Our problems lay with the new COM device and the limited amount of processing equipment we had within the Company to manufacture microfiche copies. We found, for example, that the universal camera could not hold image registration properly, the microfiche cut mark, located at the bottom of each fiche, was so large it obliterated some of the data; film skewing was common; and the images were not sharp. Since we were dealing with confidential data, film processing had to be handled by our Microfilm Services Department. The equipment to process 105mm COM output in-house was extremely limited. Although-there was no difficulty in developing the silver originals, cutting the fiche, producing the diazo copies, and attaching the binary clips to the fiche was a painstaking manual operation. One by one, the hardware problems were overcome and the methods of producing microfiche copies were improved. On the day that the Proxies were mailed, we produced the Proxy Register on microfiche and loaded the fiche into the reader - The System was Launched.
There was about a five-week span between the mailing of the proxies and the Annual Stockholder meeting. This gave us enough time to have the clerical people get accustomed to the reader, evaluate the idea of having the master index on fiche instead of hard copy, and develop the program for producing the Final Voting List on film. Two days before the meeting, we processed the last of our returned proxies through system and generated the Final Voting List on microfiche.
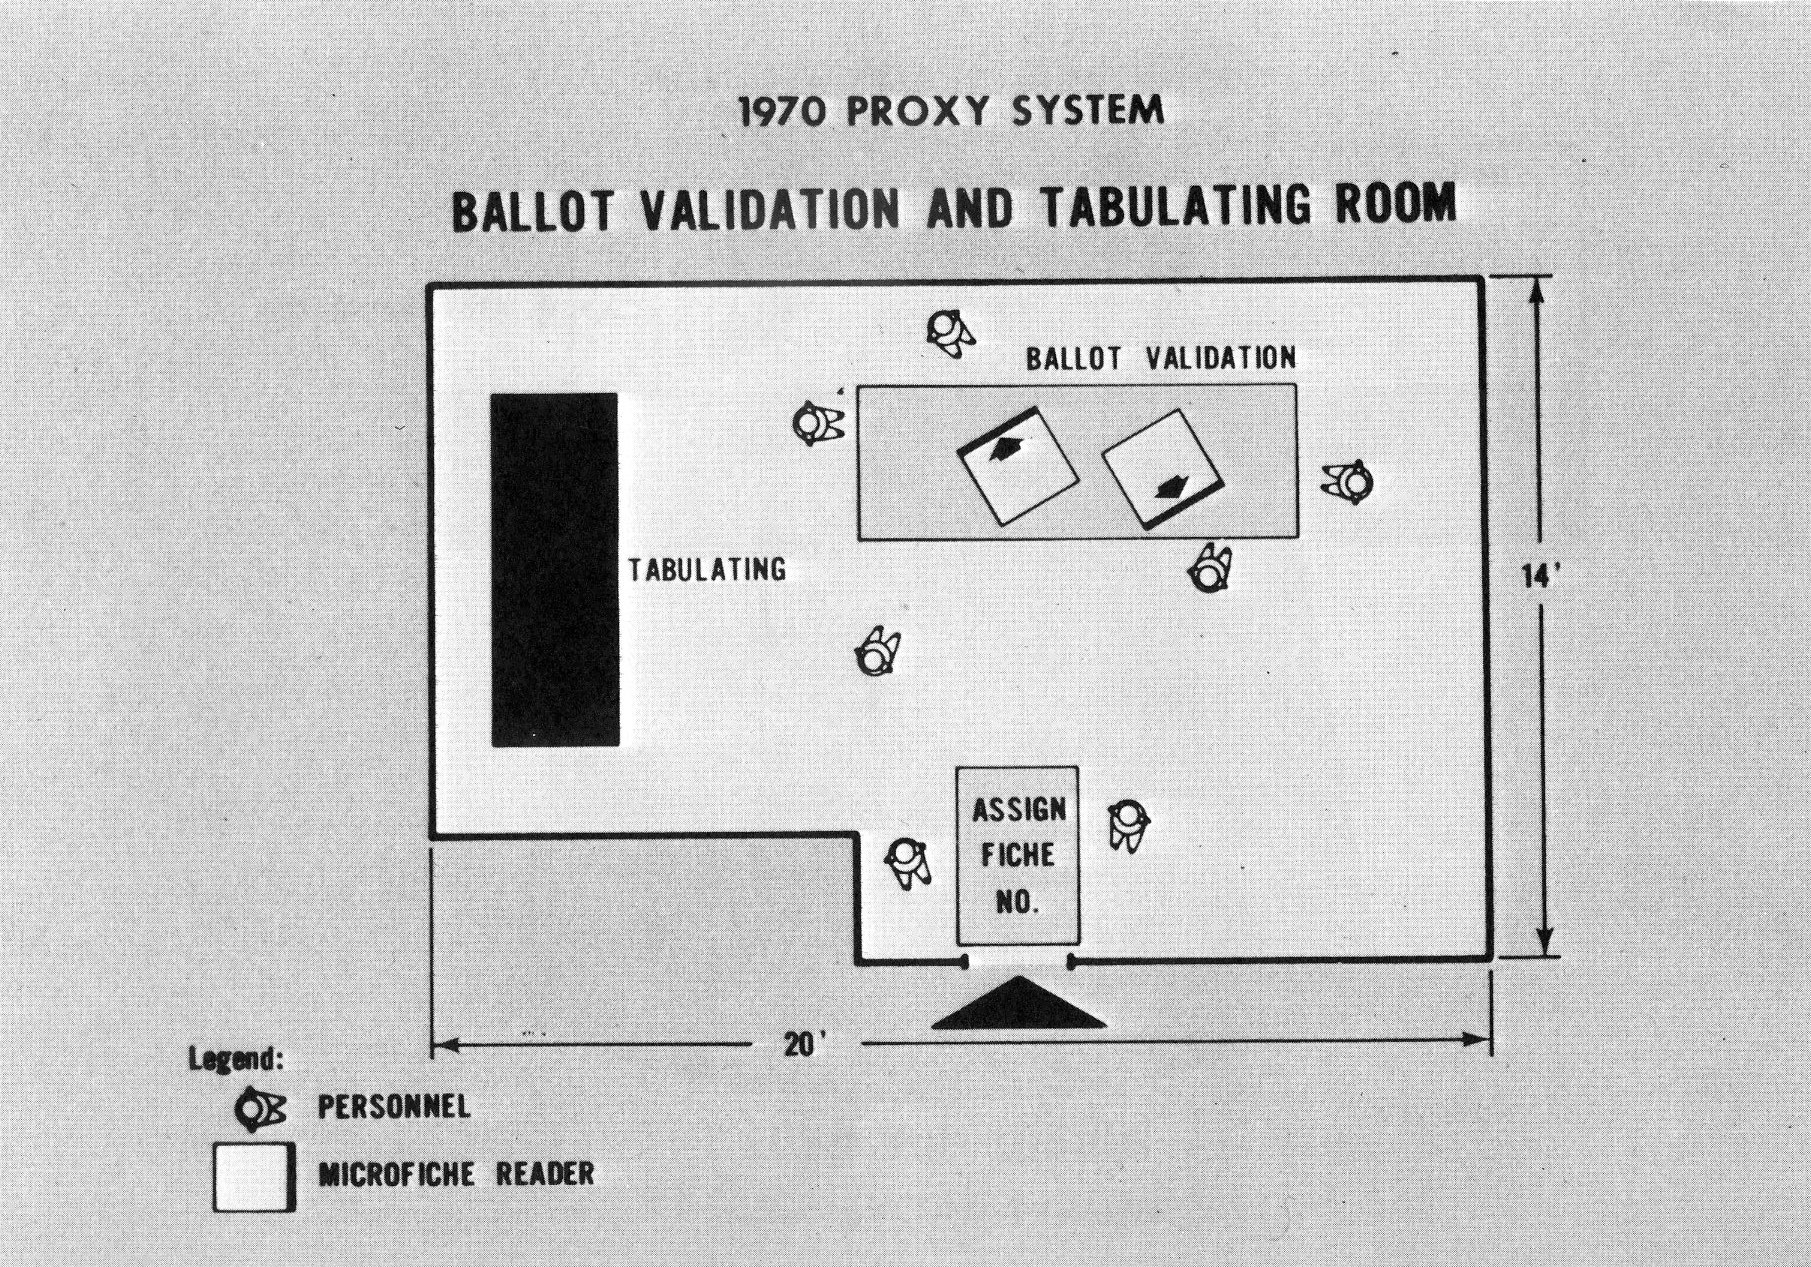
Since the Annual Meeting was to be held in the morning, we shipped our readers and tabulating equipment to the auditorium the day before the meeting. We placed one reader containing the Proxy Register on a cart behind a row of tables in the outer lobby of the auditorium. This reader would serve to screen those persons wishing to attend the meeting who came without their invitations. The other readers, together with the tabulating equipment, were located in a 14 × 20 foot room adjacent to the outer lobby. These readers contained both the Proxy Register and the Final Voting List (Fig. 10).
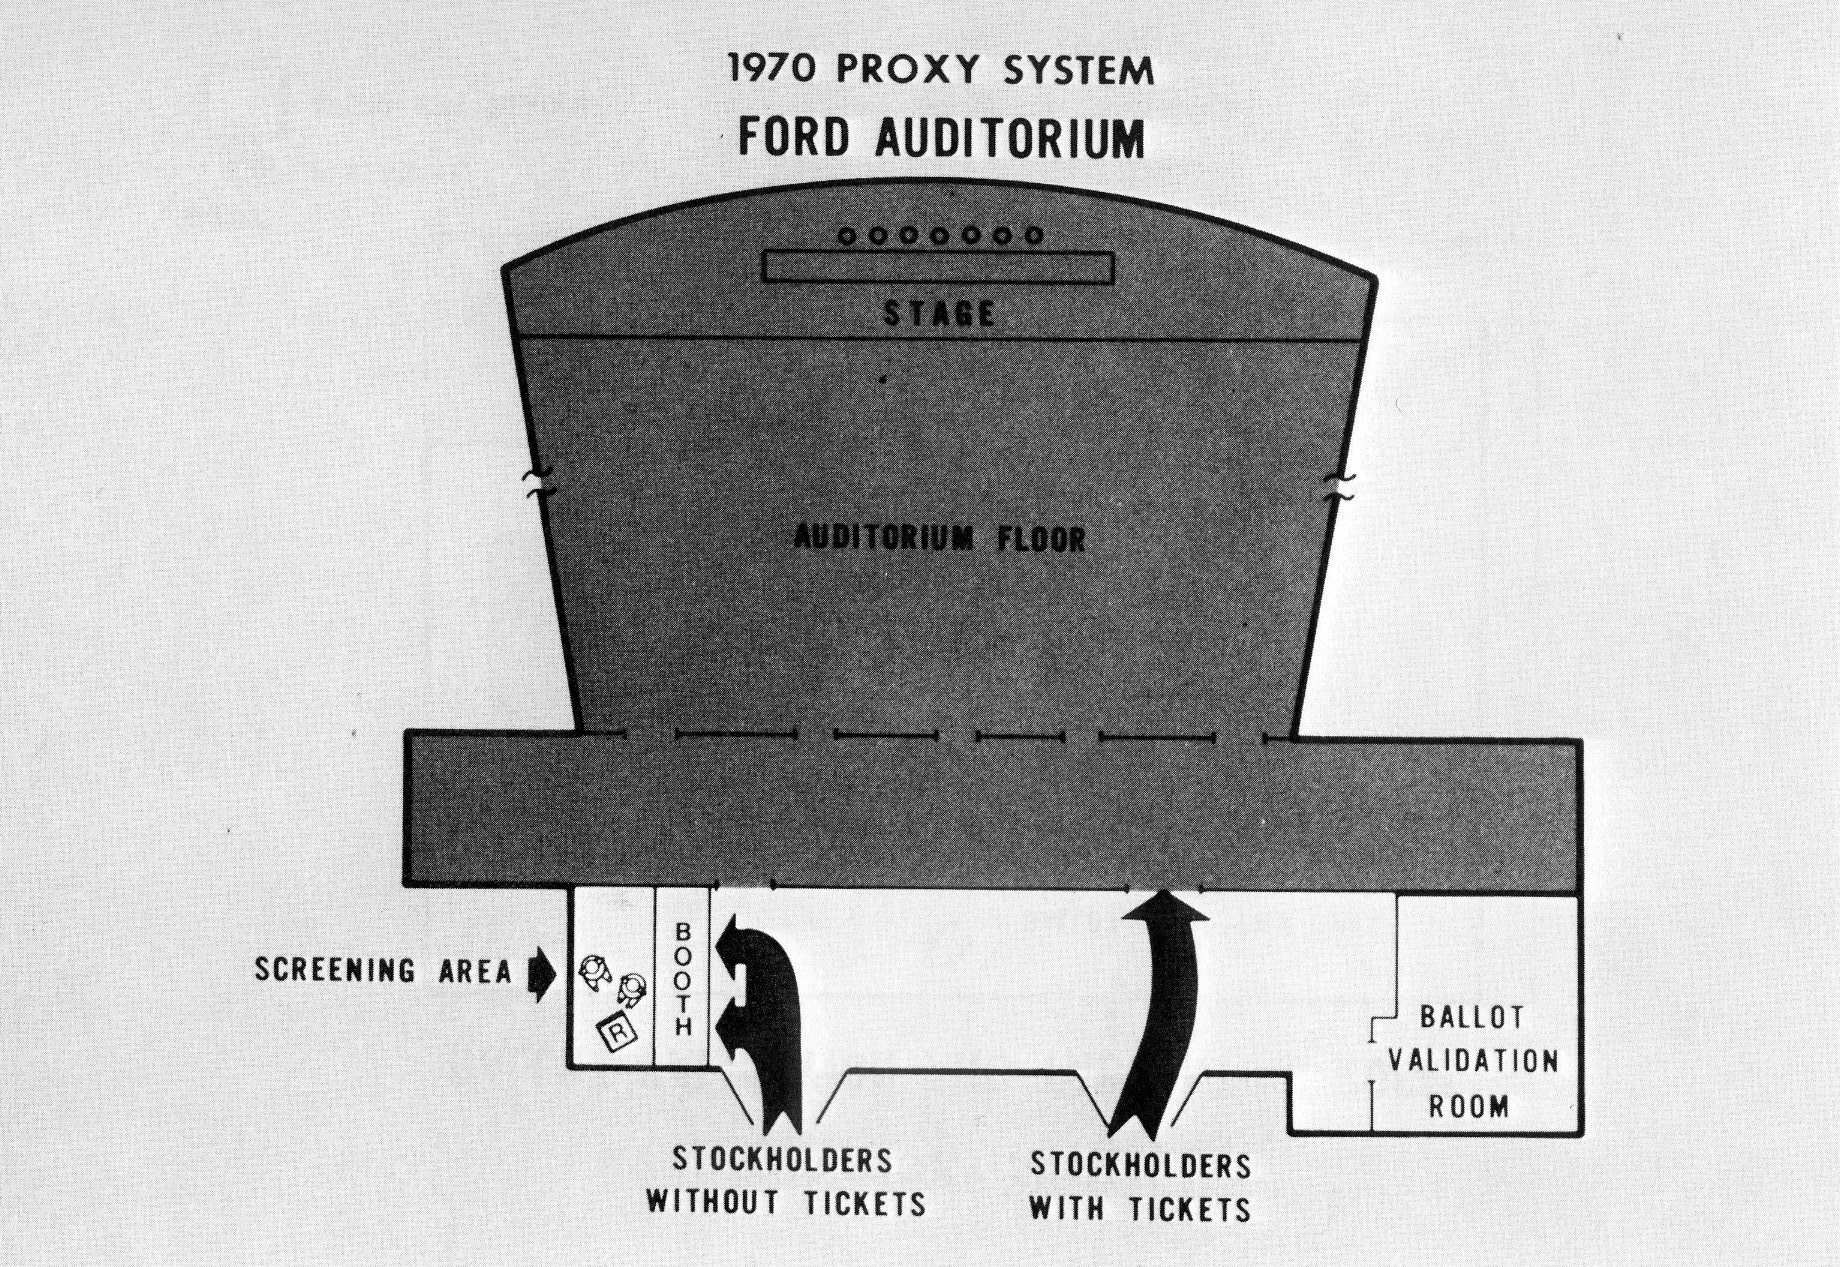
At 9.00 a.m. the doors of the auditorium were opened to admit the stockholders. Signs were posted to direct those persons having their invitations directly into the meeting. Persons without invitations were ushered to the registration area. There they were asked to fill out a registration form with their name and address. As each form was completed, it was passed to the people handling the reader. Two people were stationed by the reader. One member of the two-girl team would write the appropriate fiche number for the name appearing on the registration form from a hard copy of the Proxy Register fiche index and hand it to the other member of the team for look-up. When the person was found on the Proxy Register, he was admitted to the meeting. Approximately 100 persons were screened by the system in an elapsed time of about 35 minutes. The entire operation never experienced a queueing problem.
When the time came for the stockholders to cast their ballots, instead of having to negotiate the long maze of corridors and stairs as in previous years, they merely walked out of the auditorium and to the tabulating room adjacent to the outer lobby. There, they handed the ballots to one of two people stationed at the door (Fig. 11).
These people assigned the proper fiche number on the ballot from the hard copy of the Final Voting List Fiche Index (Fig. 12). Once numbered, the ballots were then passed back to a team of validation clerks who performed the look-up and marked the appropriate information on the ballots. Total elapsed time to validate each ballot - 28 seconds. Under the old system, ballot look-up took two minutes. The entire operation was accomplished in under eleven minutes using a total complement of seven persons.
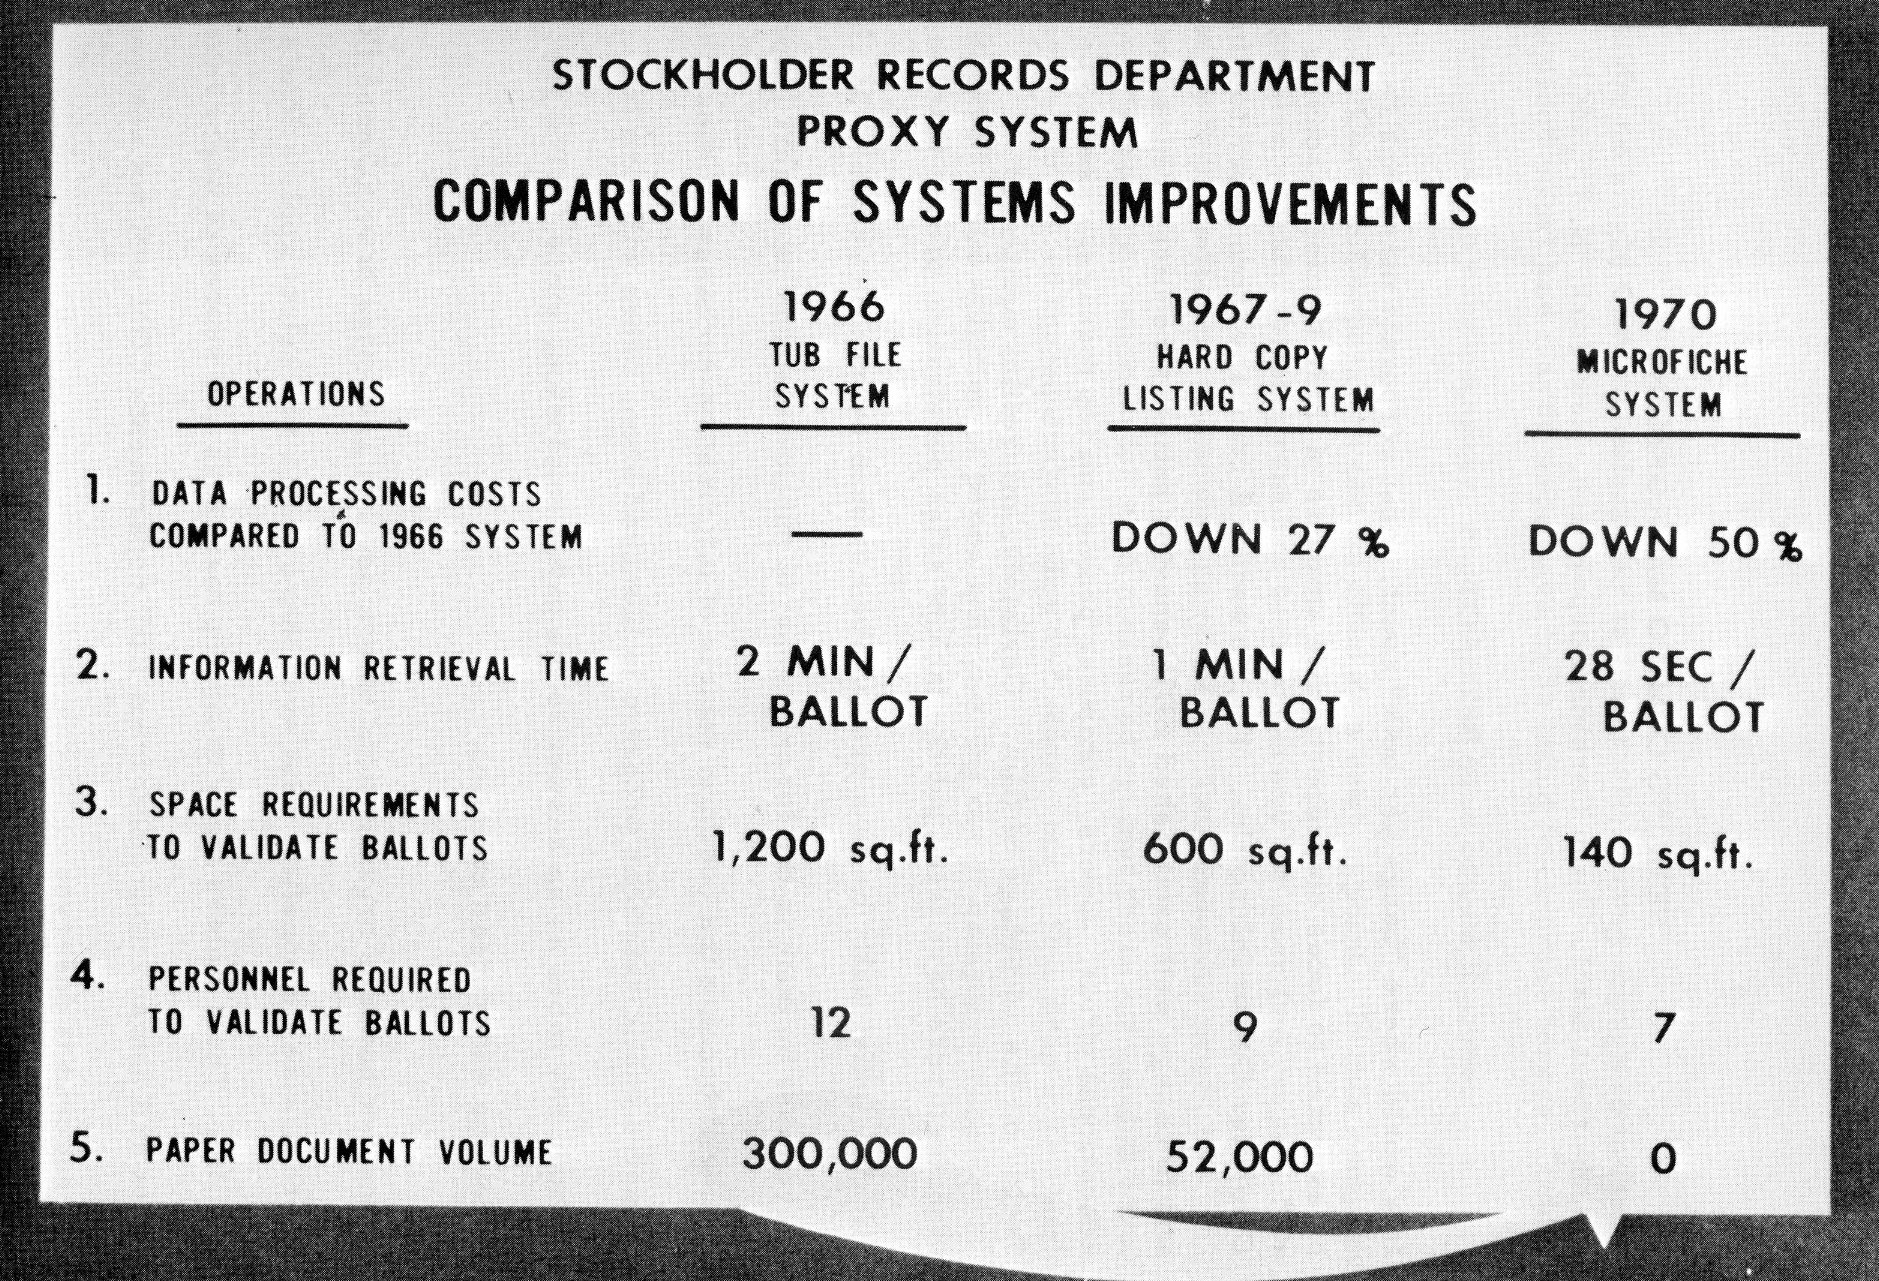
I've just described to you three different systems, all designed to accomplish the same end result. Fig. 13 shows a comparison of the three systems and illustrates how technological improvements made in microfilm and microfilm retrieval techniques have enabled us in this application to lower data processing costs by 50%; decrease information retrieval time to 28 seconds from 2 minutes, or about 77%; compress space requirements to 140 square feet from 1,200 square feet, or 88%; reduce clerical personnel by 5 persons, or 41%; and cut the need for paper by 100%.
In summary, this application is but one of several microfilm applications installed at Ford - and is but one example of how microfilm, as a dynamic tool, can be used in today's modern and demanding business environment.
In a world where bangs per buck count, most corporate managers cannot be expected to focus disproportionate amounts of their limited resources on Computer Output Microfilm. Yet, to switch a company from paper to film and to change well established EDP behavior pattern requires a massive educational effort. Users, computer people and top managers need to be sold on the advantage of film. Certainly microfilm equipment manufacturers have tried but the lack of sales penetration proves that these efforts, individually or as a group, have not been overly successful. Much more must be done in the form of generic public relations programs before film will become the common vehicle of information exchange. Unless the massive public relations program is launched soon, users will turn to cathode ray tubes as an answer to the paper implosion, since CRT's are receiving widespread attention.
In the few hundred organizations where devoted advocates have adopted COM, users praise its benefits. But even there only a few select applications are on film. Thus, unless many more top managers and scores of users learn about and demand microfilm from EDP departments COM will not achieve the success it deserves.
Maybe no single COM manufacturer is financially strong enough to mount the required effort and maybe ways have to be found to combine forces. One thing is clear - no user company, regardless of size, can do it alone.
Union Carbide Corporation can be cited as a case in point. In this company an intensive educational program has been underway for over two years. Now, nearly thirty different printouts are on film. This endeavor might be considered highly successful when measured against those companies which have not invested the equivalent time and effort, but it is a drop in the bucket compared to the volumes of paper still pouring out of computer rooms.
Computerized microfilm devices have not caused much of a ripple in the business world and there is little indication that the picture will dramatically change in the future. It's a sad fact of life that the COM industry has not succeeded in making COM sexy, exciting and worthwhile. And, unless something dramatic is done about it, printers will continue to spew out tons of paper and people will get increasingly more steamed up about on-line systems and cathode ray tubes.
Let's face it, COM leaves EDP people cold, and the rest of the world really doesn't know too much about it. EDP people see microfilm as an old technology containing many pitfalls and problems which they neither understand nor see the necessity to learn about.
As they see it COM offers little glory or personal rewards. In fact, the opposite may be true. Evidence seems to indicate that most men who were responsible for the introduction of microfilm in their company find themselves behind the eightball. They become specialists and their personal growth in their company levels off: The reason for this seems to be that they are held responsible for the creation of one additional set of headaches by a management that already has inherited many more than it can handle.
Top managers must become convinced that COM will bring about real and tangible improvements and users must become sold on the potentials of film. Obviously, this type of sales effort is exceedingly costly but it seems necessary if COM is to gain wide acceptance. It becomes even more costly when it is recognized that a continued company by company liaison is required. It must be continuous since no manager stays in a same slot for very long and yesterday's manager cannot help - in fact his association with COM may hurt - today's effort.
If COM manufacturers want to reverse this trend they must find ways to tune in top managers as well as users. Today, most marketing efforts seem to be concentrated on the EDP personnel and this type of marketing approach alone will not work. This is not to say that EDP people ought to be ignored, but the emphasis must be on two levels.
So, the one-shot sales efforts can actually hurt a COM sale. Yet this is what is frequently done. A manufacturer or service bureau will spend a concentrated amount of time trying to line up a contract. After a while, successful or not, he will disappear only to be followed by others who will follow the same pattern.
One thing is certain, unless ways are found to maintain the interest level for COM in an organization, this technique will not gain the hoped for acceptance; and if a single organization can not afford to stay with a potential or real client for too long, then other ways should be found to accomplish this. Presentations at conventions and workshop sessions are a beginning, but they will never replace the personal contacts at high levels or the hand holding at the user level which seems to be required to introduce COM into a company and to assure its continued acceptance.
Having drawn this rather glum picture, let me cite an example of how one company took the initiative to switch some of its computer output to microfilm.
Ironically, the first application and the one that set the pace for the future acceptance of microfilming in Union Carbide Corporation did not involve computer output. Some customers and stockholders complained to our top management about the way we handled phone inquiries about our products, personnel, and services. As a result of these complaints, a task force was established to find a solution.
Soon thereafter information centers were established in New York, Chicago, San Francisco, and Houston. At each of these centers microfiche CARD Image Systems were installed containing identical information on a variety of subjects. These units stopped all complaints, since anyone desiring information can normally receive accurate answers within ten seconds. Now when you call the Union Carbide Information Center, a well trained young lady will direct you to the proper salesman, head of a department, or committee, give you the name of a product, or tell you where you can buy it.
Success of this action oriented application caused top management to initiate an effort aimed at discovering other opportunities for filming. A two man team was formed to identify other areas for improvement. This task force produced a report which quantified the film potential estimated cost saving potentials and outlined a course of action. This report was approved and one man was assigned to initiate the use of COM. To launch the program, a slide presentation was prepared for prospective users, who manipulated large amounts of computer produced paper and thus could realize the largest benefits through COM. In addition, each of these applications was typical of a number of others throughout the Corporation.
This effort is now complete and nearly 1/8 of the total COM potential initially identified has been realized. The point I am trying to make is that this success would not have happened without the moral and financial support of top management at the start of this program.. For example, the first few slide presentations were preceded by discussions at top levels which obviously helped. Additionally, a special budget was established which absorbed most of the initial costs for the development of computer programs, the computer processing time, the filming of the dozens of conversions, as well as the purchase of a number of microfilm readers.
The presentation was put together by combining visuals of pertinent in-house facts with slides obtained from some of the manufacturers. It was shown to many potential users, their managers, and EDP personnel.
At each of the initial sessions we stated that Union Carbide Corporations' top management had approved this presentation and that it recognizes that the active use of microfilm offers tangible opportunities and that it was the purpose to show what advantages can be achieved through the use of sophisticated film-based retrieval techniques.
The Corporation had utilized microfilm for over 20 years as an archival medium as well as for the storage and retrieval of engineering drawings, but the active use of film - where information is required to perform work - is new to us. Essentially, we explained some of the reasons why microfilm for active use is better than paper, showed the different microfilm formats and their specific benefits, cited some of the retrieval techniques, mentioned some of the applications already on film and some others which ought to be considered. A summary of the presentation follows:
Before the turn of the century entries were made manually into ledgers. As business became more complex, forms were devised which made the recording as well as storage and retrieval of information somewhat easier. With the advent of computers, information could be manipulated quickly and made available quite readily.
However, as the demand for information increased, it soon became apparent that high speed printers were the bottlenecks which inhibited the ready access to the wealth of data available in the computer. They were not only slow, their product was bulky, heavy, hard to read and costly.
Some of the problems with paper are that:
A relatively new technology overcomes the drawbacks of the printer by producing computer output on film instead of paper. Now printing is done with light instead, of ink, one page at a time instead of a line by line and it is approximately 10 times faster. These machines take computer output either from magnetic tape or directly from the central processor and expose it on cathode ray tubes which are linked with high speed cameras.
Special forms can be created simply by projecting a transparency onto the film as the data is generated which makes it possible to use special forms for every computer output at practically no cost at all. In addition, there is no limit to the number of clear and legible film copies which can be made.
These computer output microfilm devices can be utilized to make charts and graphs, in black and white or in color. They can create three dimensional effects and animation. Some can even produce letters in upper and lower case, in regular, italics and bold and in a large variety of fonts.
The animation capability can be used to create inexpensive movies, display simulations of queuing problems as might be found at airports or warehouse loading docks, or to show changes in density patterns of populations or markets. Some people have even created prize winning movie cartoons.
Thus COM offers not only a great deal of flexibility in the display of information, it does it faster and cheaper than line prints. On the average, these machines use approximately l/8th of computer time, l/10th of print time, and the film costs 1/8th that of paper.
In addition microfilm saves up to 90% on space, and mailing. Also, images on film can be retrieved 50% faster than paper and in most cases require almost no time to file. (In fact, film can be said to be an inviolate file).
Costs are also very favorable when microfilm viewers are compared with time-sharing system, as shown in the chart below:
| MICROFILM VIEWERS | Typical Monthly Rental ($) | Time to Display Full Page (8000 characters) (secs) |
|---|---|---|
| HF Image Card System | 160.00 | 4-6 |
| Stromberg DatagraphiX 1700 (Automatic Magazine) | 42.00 | 4-15 |
| Kodak PVM (Manual Roll) | 21,00 | 8-20 |
| Micro Design COM 200 (Fiche Reader) | 8.50 | 20-30 |
| COMPUTER TERMINALS | In all cases plus transmission cost and time. | |
| Sanders 720 (Video) | 468.00 | 0.2 |
| IBM2265 Video (Plus Control) | 478.00 | 3.1 |
| IBM Selectric | 130.00 | 533.0 |
| Teletype KSR 33 | 90.00 | 800.0 |
There are many reasons why micro-photography is gaining acceptance in Union Carbide. Users have adopted microfilm for the following reasons:
| PAST | PRESENT |
|---|---|
| Many people searched for identical information available only at one location. | Microfilm is disseminated to them eliminating the waiting time heretofore required to obtain the information. |
| Bulky heavy earmarked reports were used. | Compact microfilm is being used. |
| Work is performed at one location while the bulk of the information is at a different place. | Information is available at the people's desk. |
| Large volumes were mailed overseas. | Microfiche can be mailed by air mail. |
| Bulky reports were disseminated widely. | Microfilm is disseminated at a much lower cost. |
| Quick access of information was required by management. | Microfilm in automated readers makes information available in seconds. |
| Fifth to sixth hard to read copies were used. | Regardless of the number of copies, each is as clearly legible as the original |
| Information had to be frequently updated. | Microfilm makes it faster, easier and cheaper to update information. |
| Information was crammed into over-stuffed file cabinets which had to be retrieved frequently. | Microfilm makes it possible to retain the information in a desk drawer. |
The feasibility study indicated that many applications for microfilm exist throughout Union Carbide such as: Accounting, Accounts Payable, Accounts Receivable, Adjustment Sections, Advertising, Banking, Business and Technical Libraries, Corporate Secretary, Credit, Distribution, Engineering, Finance, In-Process Control Locations, Insurance, Inventory Centers, Maintenance, Manufacturing, Market Analysis, Medical Departments, Order Processing, Payroll, Personnel, Public Relations. Purchasing, Realty, Research and Development, Sales Analysis, Stock Transactions, Systems and Computer Work Areas, Traffic, Travel and Work Scheduling.
The applications selected for conversion reoccurred throughout the Corporation and shared the following conditions:
The conditions described above, prevailed in the Adjustment Departments of all of our various businesses. The largest of these was operated by Consumer Products and we, therefore, started our COM program by assisting this user with his conversion. Here approximately 80,000 additional invoices and adjustments were added monthly to the files, frequent retrievals were made, larger and larger file space and more and more clerks were required to keep up with our growth and misfiling began to hurt our business as the requests for documents increased.
These documents are produced on 16 mm film from magnetic tape. At the same time a number of indexes are created which contain sufficient detail to answer a great many questions alleviating the need to go any further.
Basically two types of indexes are created. Each week as approximately 20,000 new documents are added to the file, an index describing the content of each roll of film as well as cumulative year-to-date are created.
When a copy of an invoice or adjustment memo is required, Image Control or Page Search machines facilitate retrieval. Normally, an inquiry is answered in less than one minute. The Adjuster makes his own look ups. Clerks are no longer required to file, search, and re-file. No documents can be misfiled, lost, or rendered unreasonable. Storage has ceased to be a problem.
Today, most of our Adjustment Departments utilize film instead of paper. The systems employed by Linde, Chemicals and Plastics, as well as Carbon Products are very similar to the one described for Consumer Products. This makes it possible for the Corporate Credit Department to receive a copy of every roll of film produced by the divisions eliminating one additional time loss and expense. They frequently send a copy of an invoice to the customer. Before, they had to contact the division, now they make their own copy.
Another set of reports used throughout the Corporation are reports concerning the market, customer, product and sales penetration. These analysis are usually arranged geographically and widely disseminated. Most of our businesses utilize microfiche to distribute the information to its regions.
Users of these reports prefer it over paper. They find that fiche are cheaper, can be mailed, stored, and handled easier and are cleaner to handle. The one drawback in this set of applications is the unavailability of inexpensive and light portable readers for use by salesmen. But when these readers become available, our salesmen will be freed from the stacks of paper, reports, and catalogues they must handle.
Payroll references can be cited as another example. For instance, the Corporation's central payroll register shows all pertinent information with regard to each employees pay record such as employees name, number, gross, net, tax deductions, etc.
This Payroll Department is responsible for paying 22,000 people in the New York area. Before the introduction of microfilm, the payroll register was a monthly computer printout consisting of approximately 5,000 pages which had to be broken into sub-sets before it could be handled. Even when broken down the size of the report precluded desk side accessibility. As a result of a girl receiving a telephone or written question she had to scurry to a cabinet to find and carry back to her desk a book of more than 400, 11" × 17" computer printout pages.
After she found the answer she has to retrace the steps to the cabinet. Because of the size of these books, it was possible to keep only 2 months reports easily accessible to payroll clerks, All other reports were removed to a secondary storage area and reference to them was physically time consuming In addition to the inconvenience of each look-up, either in the nearby cabinet or in the secondary storage area, there was significant time loss.
Now the payroll department gets a complete set of microfiche for each of four teams of four girls. Each team has its own reader Any payroll clerk can answer questions quickly and without trouble by simply pulling out appropriate fiche cards from a file next to the reader and inserting it. Each file situated in front of the reader contains twelve complete payroll registers thus even questions relating to earlier pay periods can be dealt with while the caller is still on the phone.
Union Carbide does its own stock transferring and all the records pertaining to a stock transfer activity are maintained on microfiche. Here again bulky reports were eliminated, costs were reduced and far faster retrieval resulted.
Corporate Accounting uses microfiche for all of its research. Such reports as Paid Files, Vendor Code Lists, Trial Balances, Invoice Registers, Customer References aid them to make their operation more efficient.
A secondary benefit of the use of microfiche has been the low cost distribution of copies of the Corporation's monthly Trial Balance to Divisional Accounting Departments. Timely access to this source of information has helped improve their operation.
Generally speaking we have standardized on two film formats: 16 mm and microfiche. All our 16 mm have opaque marks (image control or page search) below the image area which makes possible fast retrieval through the use of keyboards. We use Eastman Kodak and 3M Retrieval Stations.
16mm film is selected where large files are centrally maintained and where prints have to be created for use outside the company. In all other cases we utilize microfiche consisting of 84 pages or data frames for fast retrieval. The computer produces an index for all of our COM output.
In the 16 mm film applications an index is provided summarizing the contents of a particular roll. Also, a cumulative year-to-date index tape is maintained and reproduced on film periodically. For microfiche we show an index on the 84th page of each fiche. There is also an eye legible area on the fiche which gives the name and date of the report, category of the report, key name or number of the first and last image areas and a sequential fiche number. The eye visible area is color coded with a different color for each of the month of the year. This color coding has been standardized throughout the Corporation.
Microfilm may offer compactness, availability, control, accessibility, security, low cost, ease of reproduction, high quality, and speed, but what really matters is the enthusiastic responses users have to film.
Girls like to use film because they do not have to lug 12 pound books anymore. Their managers like it because the information flow doesn't get bogged down for days because a document has been misplaced. They also prefer film since any clerk can address a whole fiche file instead of only a segment. People who acquire information like it because they can get the data immediately instead of having to wait for 15 minutes or even 15 days. In fact, in most instances, users can get the information themselves.
Over and over again, people who use film state that they prefer it over paper. One analyst recently said: "It's just a matter of finding the right image and recording the information that is on it." Responses such as this obviously are exceedingly important since it makes it possible to refer potential users to those who have adopted film with assurance that they will have nothing but unhesitating accolades for their system.
Union Carbide Corporation uses today well over thirty different COM outputs which are produced regularly and the users are well satisfied with the results. But I am convinced that very few of these printouts would have been converted without the approval of top management. I am equally certain that a change in attitudes even a loss of interest by top management would immediately cause a slowdown in the acceptance of COM by new users.
Thus it is imperative that microfilm equipment manufacturers as well as service organization seek ways to keep top management informed and interested in this medium.
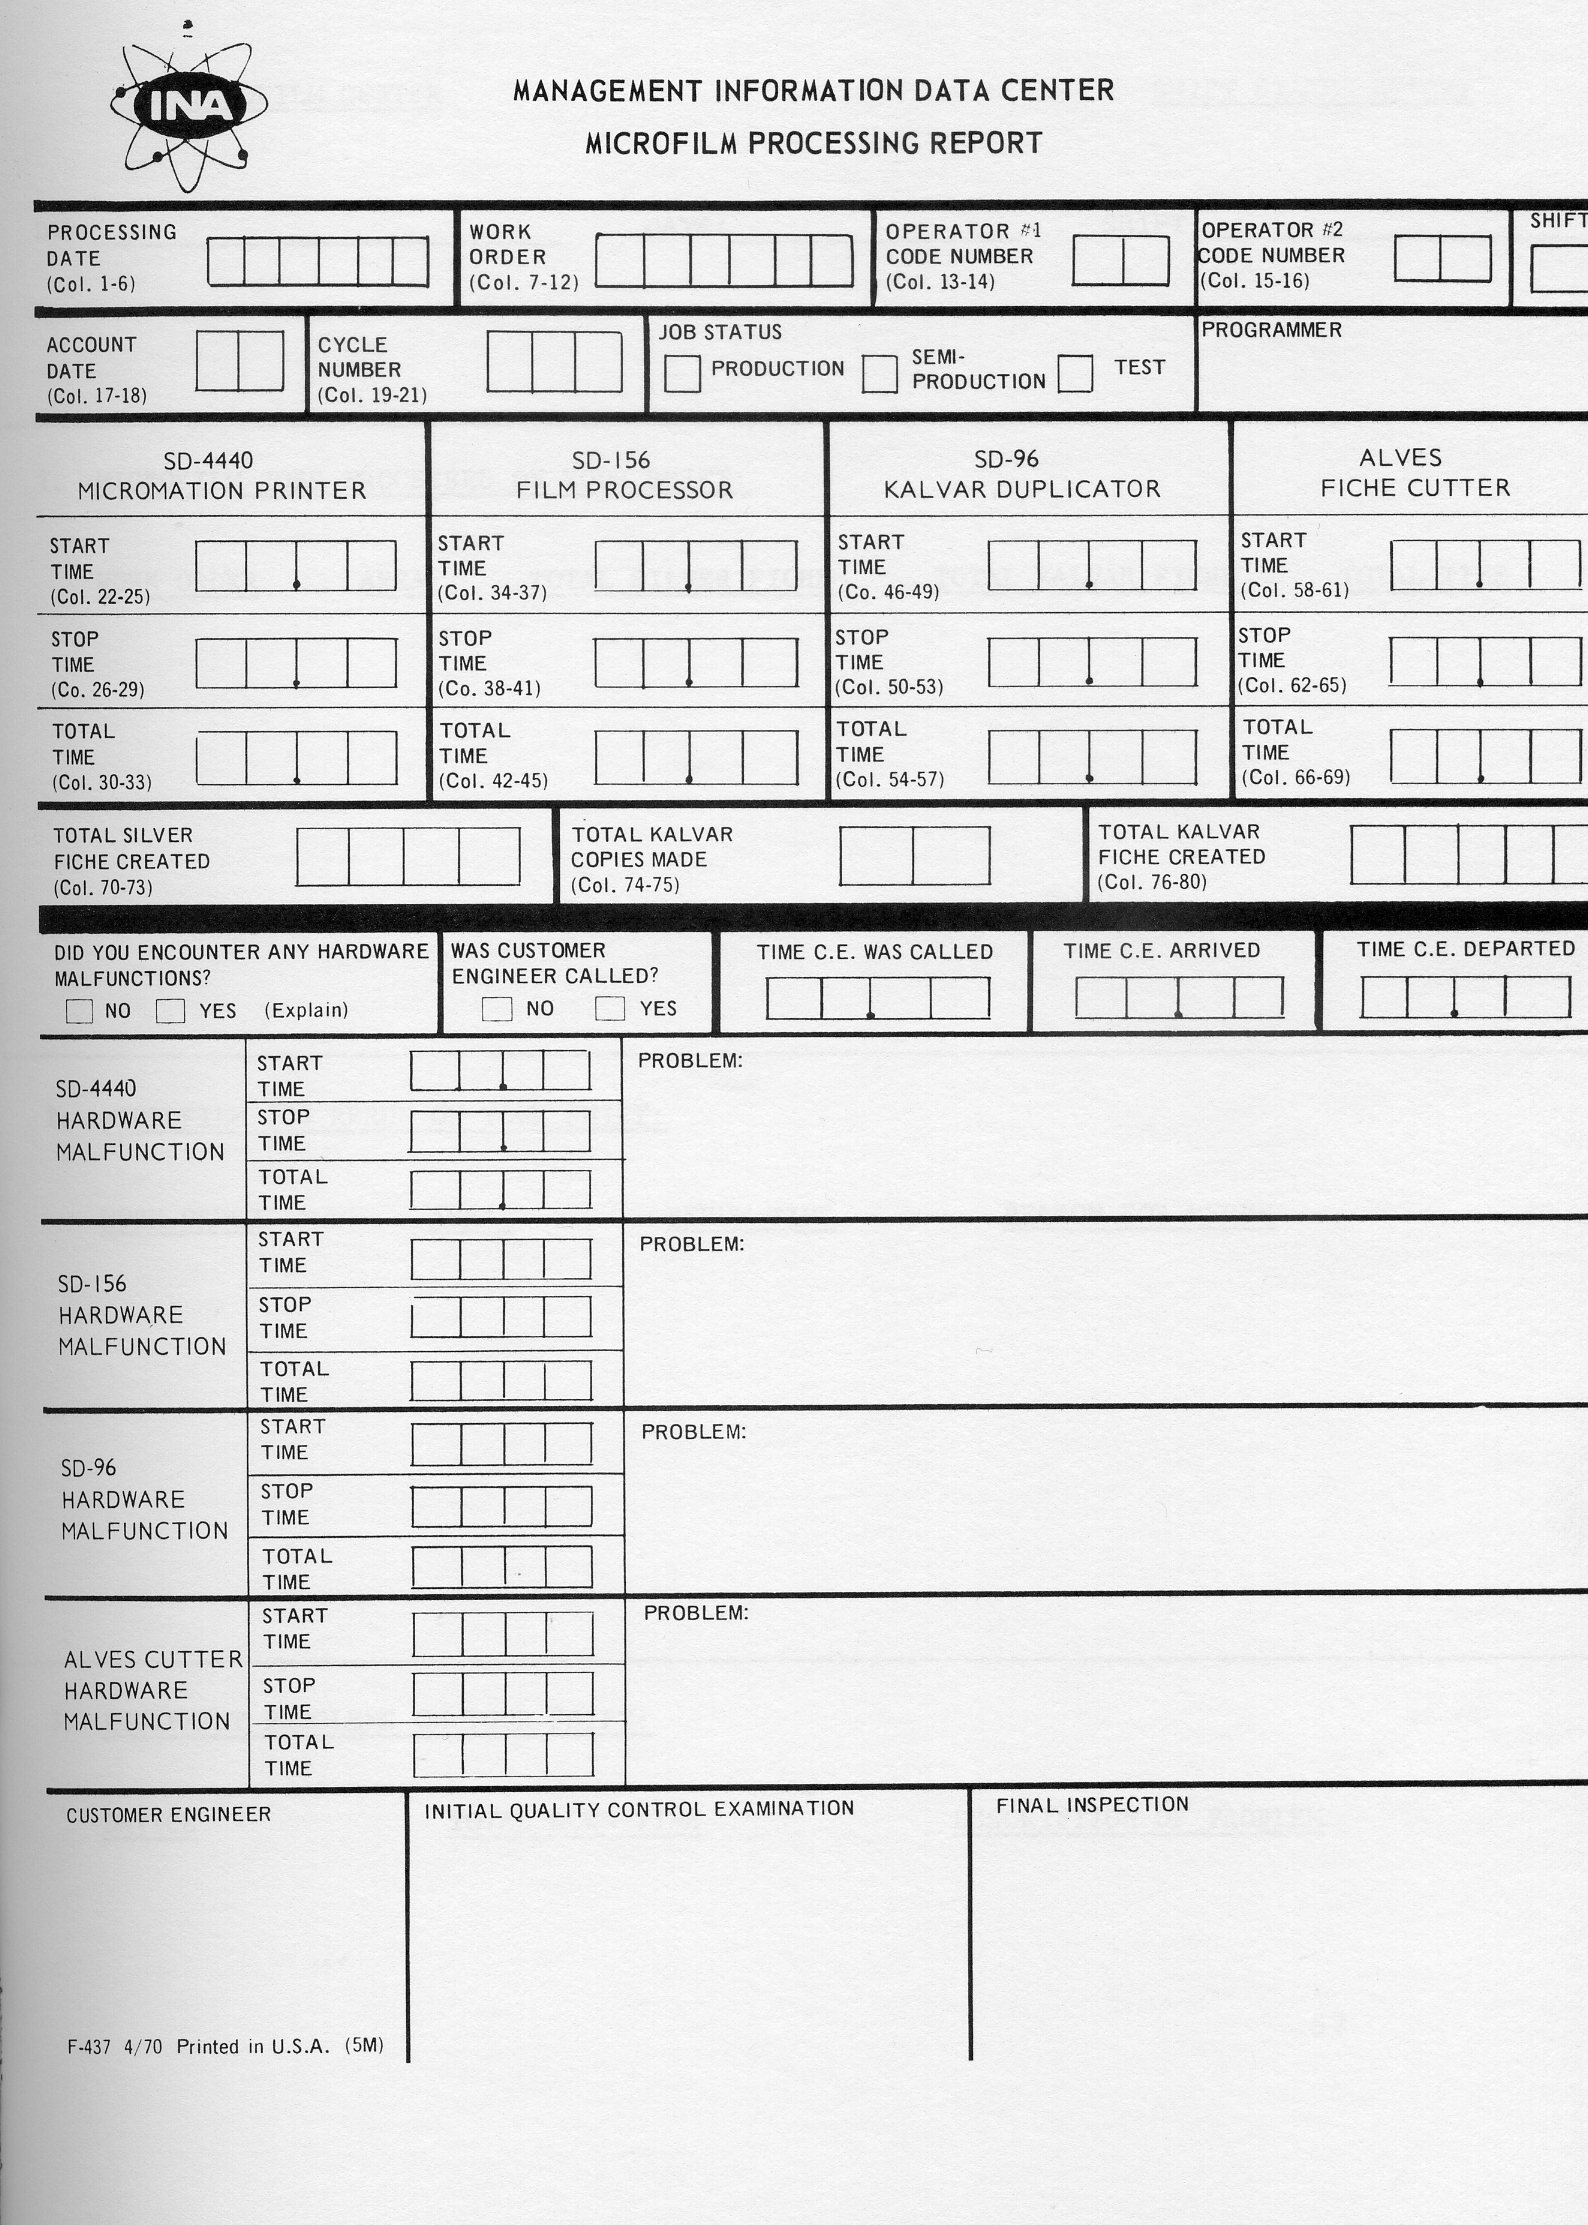
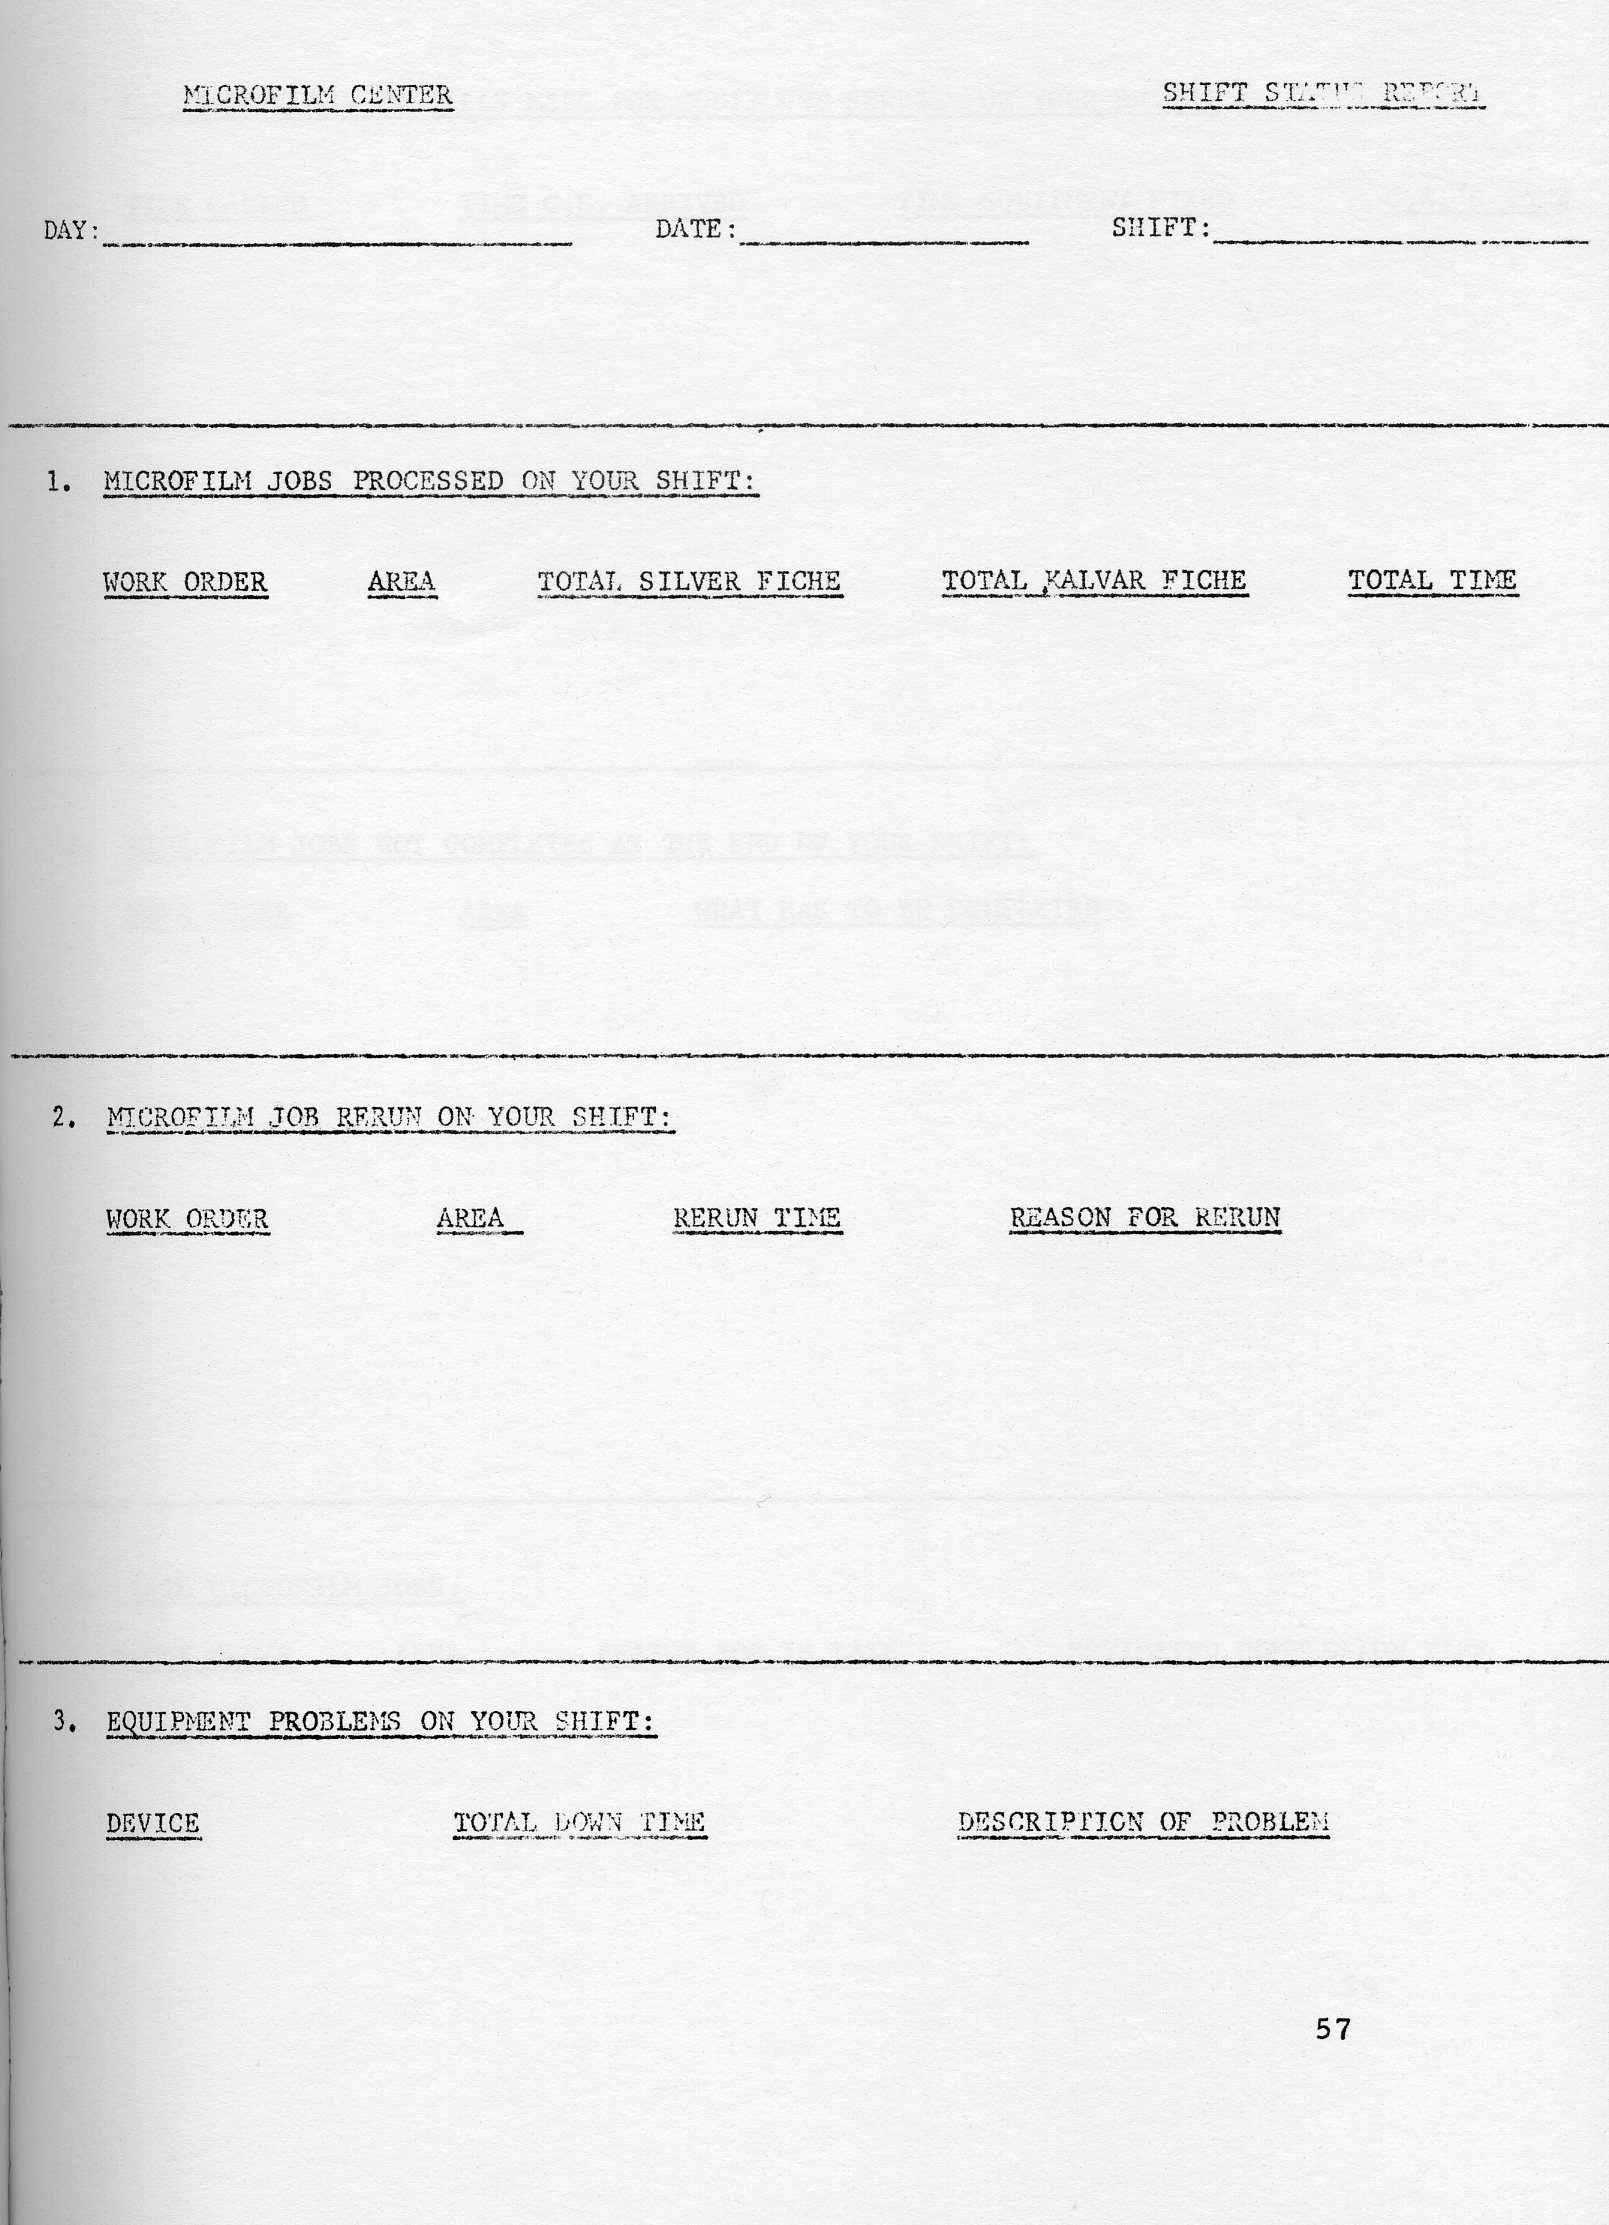
This paper discusses the replacement of a card file and roll film records containing sketchy beneficiary and Medicare data maintained in the 825 local Social Security Administration offices, with a microfiche system which provides more comprehensive and current data used to answer questions asked by beneficiaries. The 105mm microfiche are prepared on the D-4440 micromation system at a 25 to 1 reduction. Duplicate fiche are prepared on the Kalvar Model 96 duplicator. The Kalvar fiche, in sets alphabetically by names of beneficiaries within each state, are updated biannually. In the field, the fiche are filed in Acme Visible files and referenced on Realist and/or Bell and Howell reader-printers. The project has been operating successfully for 14 months. The primary results are better public service, cost reduction in the elimination of the card and roll film records, and a decrease in the use of the Administration's telecommunications system.
The Social Security Administration is currently providing cash benefits to 28 million beneficiaries. It also provides Medicare coverage to 20 million people 65 years of age or over. As a result, local social security offices are visited frequently and asked questions (30 million yearly queries) by beneficiaries relating to the Medicare claim numbers etc.
Although the local offices have kept card files containing major events pertaining to beneficiaries, they have not been able to provide immediate answers to a large number of questions. In many cases, the questions were sent to the headquarters in Baltimore via a telecommunications network. Beneficiaries at times had to wait 3 to 5 days for answers which were taken from magnetic tape files. Requests for Medicare numbers were provided at the local office from roll microfilm. Because of the deterioration of public service. the local offices finally requested that they be given more complete and up-to-date from the master tape files kept in Baltimore. NOTE: (SSA would prefer to have a real-time system; however, it may not be feasible for another 7 to 10 years.)
Serious thought was given to providing additional beneficiary data from magnetic tapes on 16mm roll film. However, microfiche was favored and selected because the look-up time was shorter, less file space would be required, (no need for film boxes and file cabinets), and fiche was more easily handled. SSA had experience with micromation equipment producing 16mm roll film since 1958. However, we had no experience with, the use of 105mm roll film.
The fiche we decided on to carry frames of beneficiary data transferred from master magnetic tapes is 4" × 6" in size. Using the DatagraphiX 4440 and the Universal camera (25 to 1 reduction), we are printing 100 characters to a data line, 76 lines to a frame and placing 73 frames on a fiche (72 frames of data and 1 frame of indexing information). One column of the fiche is used to print a programmed eye-visible header. A cut mark is recorded on each fiche to activate the automatic fiche cutter in a later operation. Although we are using the 25 to 1 reduction feature on the D-4440 we have not eliminated the future possible use of the 42 to 1 feature.
An average frame of data contains nine summarized beneficiary records, and a fiche contains an average of 600 records. In addition, the Medicare claim numbers and name information are now carried on the microfiche, eliminating the need for roll film in the field.
The master file is divided generally into alphabetical segments by names of beneficiaries in each state. Actually, there are 56 sets of master fiche for the entire country. Large states such as New York and California have subdivided sets. One-sixth of the total file is updated each month and written on 5,000 silver master fiche using the D-4440. The silver fiche in roll form is processed by the Eastman Kodak Company. After processing has been completed, the film is edited for obvious photographic imperfections or camera malfunctions. Edited films are next cleaned on a Lipsner-Smith ultrasonic film cleaner. The cleaned films are duplicated on Kalvar 105mm roll film using the Kelvar Model 96 film duplicator. An average month's production of duplicates totals 300,000 fiche. The fiche are placed on an Alves automatic cutter which cuts each set into a stack of 4" × 6" fiche ready for editing. Ten percent of each set is randomly edited on a Realist fiche reader as a quality control. Approximately three stacks of 600 fiche are placed in a heavy-duty envelope for flat mailing to the appropriate offices.
A single fiche duplicating operation was added for the purpose of making one Kalvar copy fiche from the silver film in roll form. This, we found, was the least expensive way of reprinting one bad fiche out of a set. For this purpose, we use a Kalfile printer for timed exposure and a Kalvar Model M-160 for developing. A set of 105mm rewinds were added to the operation to create a unitized system.
In the local offices, the sets of fiche are filed in vertical fan-fold Acme Visible files. Realist readers and Bell and Howell reader-printers with 21X lenses are used for referencing fiche. An estimated 20 million prints are made from fiche yearly.
The project has satisfactorily met all of the anticipated requirements. Public service has been improved, and some savings have resulted from the elimination of the card file formerly used for reference. There have been minor problems with almost every machine in the system, particularly in the early months of operations, such as curled fiche copies, missing cut marks, blurred copy fiche, silver processing flaws, and overprints on the D-1440. Time, experience, manufacturers' cooperation, and ingenuity have helped to provide improvements which have made this project one of SSA's most successful film operations.
Before I talk about COM at Eastern Airlines, let me give you some background information about the company. Eastern is the second largest airline in the free world. Our fleet numbers more than 150 planes comprised of six different types of aircraft. We maintain repair facilities in more than 300 separate locations throughout Eastern's system. Each facility must have maintenance manuals describing precisely how to remove, repair, and replace every nut, bolt, cam, switch, wire, pulley, gauge, relay, valve, and rivet for each type of aircraft that we fly. We produce about one million pages of revisions to these maintenance manuals per month. Prior to 1956, one revision page in four was never inserted in a manual. It ended up lost in the mail, on someone's desk, or accidentally discarded. This meant that each year Eastern's maintenance manuals were three million pages in arrears. The Federal Aviation Authority periodically audits these maintenance manuals for completeness and accuracy. Eastern was continually being cited by the FAA for these discrepancies. Our analysts determined that a microfilming installation would be justified by the elimination of the labor required to insert new pages into the maintenance manuals, to say nothing of the reduced materials, distribution and storage costs. The simplest way to handle this problem was to maintain one master manual. Each month this manual would be filmed and new copies of the complete book distributed to the maintenance locations in which viewers have been installed. Eastern initially began with two Bell and Howell Rotary Cameras which were subsequently replaced by a Kodak Planetary unit. The manuals are on 16mm roll film at a 24-to-l reduction ratio, negative polarity. Actually, all of Eastern's microfilm is negative polarity. We find negative images easier on eyes. Furthermore, negative images screen out most impurities in the film and lens of the viewer.
Meanwhile our reservations group determined that our reservations agents needed a quick and easy access to a wealth of information related to air travel. For example, it might be necessary for a reservations agent in Woodbridge, New Jersey, to explain in detail to a caller how to get to the Atlanta airport from downtown Atlanta, even though the agent had never been there herself. In addition, she needed fast access to information on hotel rates, rental cars, limousine service, ticket office hours, calculation of fares, interrelated to air travel. After several false starts with other companies, the Houston-Fearless Company developed a unit specifically for Eastern. This unit contains microfiche in a revolving carousel and places more than 72 thousand pages of information at the agent's fingertips. Maximum access time for any one page is less than four seconds. Eastern now employs about 1,800 of these units.
With this exposure to microfilm, COM was a natural for Eastern from the introduction of the concept. However, like many other companies in a tight money situation, coming up with a hard-dollar justification for equipment was difficult. The COM concept was too new and, at the time Eastern began considering it, it was relatively untried for commercial applications.
Eastern's big break came from our PNR {Passenger Name Record) system. This is a system through which Eastern maintains its available aircraft seat inventory. One of the major spin-offs of this system is a daily file of who flew on what flight and when. This information is required for fielding inquiries from the FBI, the CAB, and other enforcement and regulatory agencies. This file requires nine reels of magnetic tape per day. To search it by computer required two and a half hours of search time. Because Eastern flies people such as myself whose last name no two other people spell the same way, we were only getting 40 percent hits on our inquiries. John Voltmer, J. Voltmer, and Mr. Voltmer are three different people to a computer. One possible alternative was to have someone sit at a console and manually scan the tape, record by record. This was even slower.
To further complicate the matter, the FBI and CAB require that this information be retained for 90 days. To keep this information on magnetic tape would require 810 reels. If we maintained the file on paper it would require a stack 450 feet high. There had to be a better way, and of course there was. By placing this information on microfilm we store one day's printout on two four-inch plastic cartridges. This information is produced at 42-to-1 reduction on 16mm negative roll film, comic mode, with images two-up. Inquiry time now is immediate. And as the process is now visual we are assured virtually 100 percent hits on our inquiries. The cost of producing this information has been reduced by more than 75 percent to say nothing of the improved handling, storage, etc. The FBI is clearly amazed and delighted at our ability to respond so quickly to their inquiries.
Currently Eastern Airlines has what we believe is the largest commercial data processing installation in the country. We employ three model IBM 360/65's driving nine 1403 printers. We also have two 360/30's which are used mainly as input/output slaves. Our COM equipment consists of a Stromberg DatagraphiX 4360 with an 800 BPI tape drive and a Universal Camera. Processing gear includes a Stromberg DatagraphiX 156, an Extek 1050, a CBS 1500, and an NB 404. Our retrieval gear includes Micro-Design 200's, Stromberg 1325's, 1700's, 3500's, Dioptrix, Kodak and Bell and Howell equipment.
Raw silver halide film from the COM unit is developed on the Stromberg 156. The developed film is then copied on the Extek 1050 to reverse polarity. The Extek 1050 produces a silver print film which is then developed on the Stromberg 156. From here microfiche are copied on the NB 404 and roll film is copied on the CBS 1500.
As mentioned before our PNR file is still our bread and butter application, as it provided initial justification for acquisition of the COM equipment. In addition to the PNR work we do have several COM applications. From our systems documentation and from our campaign against unnecessary paperwork, we had forms detailing the usage, distribution, and retention of each of the two thousand reports produced by our commercial computer systems. We determined that the average report is about three hundred pages long and is printed on three copies. For reports such as these, roll microfilm was prohibitively expensive, because of the cartridge required for each report and the high cost of retrieval equipment.
For these commercial reports, we determined that microfiche would be most economical. These reports are produced on 42-to-l negative 105mm microfiche. Our fiche are in the form of a matrix 14 frames vertically and 16 frames horizontally. Across the top of each fiche is a quarter-inch high title visible to the naked eye. The lower right-hand corner of each microfiche contains an index listing selected data entries from each frame thereon with their corresponding location coordinates on the fiche.
To date, Eastern has converted about 40 reports at an estimated annual savings in excess of $35,000. Most of these are financial reports. We decided to concentrate on the finance area of the company and make this a showcase of microfilm to encourage other user departments to follow suite. We chose finance because of the limited secondary distribution of reports. Most reports produced for finance do not leave that area of the company.
Eastern is also doing microfilm service bureau work for other companies. We have done work for Dade Metropolitan Government, South Carolina Gas and Electric Company, and National Airlines.
The most significant finding in our experience is that microfilm is no faster than paper from the user standpoint. By the time data is converted, filmed, processed and duplicated, we are unable to get the report to our user any more quickly than paper. Microfilm does not eliminate the computer output bottleneck but rather spreads it around a larger and more complex processing chain. Our second finding was that the COM support software was inadequate for our purposes. The software did not live up to its advertised capabilities. Even if it had, it would still have been inadequate for our needs. We had to divert nearly one man-year of programming effort to sophisticate and refine the software and extend its capabilities to meet our needs.
Next, we became somewhat disillusioned at the state-of-the-art of microfilm retrieval devices. Most viewers, for example, are too big, too heavy, too delicate, and too expensive. Microfilm-to-hardcopy printers are all of the above and only a limited selection is available.
We determined that several ground rules would be necessary if we were to get the most from our COM equipment.
In spite of Eastern's teething problems with microfilm, management is quite happy with the results and profitability of our COM equipment. As a matter of fact, we hope to expand this capability in the near future. Perhaps our first effort in this direction will be a tape drive with a 1600 BPI capability. We are also already looking at backup equipment. Hopefully, any backup COM device will have a graphic capability as well as alphanumeric. Furthermore, we hope to eliminate the intermediate processing steps currently required to reverse polarity of our final images. To do this we will use either a reversing processor or a reversing film.
Eastern Airlines is already looking down line for the ideal COM equipment. This equipment will include a COM unit that does not need leaders or trailers of wasted film. (This cost may be negligible for 16mm roll film but with 105mm film at 24 cents per foot, leaders and trailers get expensive.) Our ideal COM unit will produce reader-ready film like the electron beam recorder produced by the 3M Company. Perhaps we will be able to put 10,000 frames on one microfiche like PCMI ultra-fiche. Our COM unit may perhaps give us a retrieval capability comparable to Kodak's Miracode. While we are talking about Kodak, our ideal machine may also include a punched card setup. Finally, our ideal COM unit must have a Universal Camera such as the 4360.
To go with our ideal COM unit we will need an ideal reader. This reader should weigh 20 pounds or less like the Dioptrix unit. It should hold its focus as well as the Micro-Design microfiche reader. If we are lucky, it will be no bigger than the Micro-Design 210 unit which is only one square foot at the base. It must also have a film-to-hardcopy capability as good as the Stromberg 3500 Microfilm Printer. Last of all, perhaps it will be in the same price range as the Recordak reader which is under $150.
In summary, let me say that Eastern is still a relative newcomer to the COM business. We have had some disappointments, some surprises, and some fun. The most important thing is that we are also saving some money. As our own experience and sophistication grows we are certain that we will find more and diversified applications for this new media. If developers of COM equipment can keep pace with the needs of today's progressive companies, COM may have the same impact on business that computers had 15 years ago.
The information system as narrated in this report is in operation at the Department of Health, Education and Welfare, Washington, D.C. The inability of the Department and its Agencies to respond on a timely basis to DHEW Management, Congress, White House and the public on specific financial data requests led to the establishment of a financial data information bank. Through the establishment of this data bank, the Department not only has resolved the response problem but has also eliminated costly duplications in Agency reporting.
The Department has in recent years diversified their mission oriented federal assistance programs into the Planning, Programming and Budgeting (PPBS) concepts. These concepts are presented to the Agency program managers through the data bank management report.
To set the stage for the source and size of the data bank technical data, it is necessary to furnish a few statistics relative to this area as background material.
The Department of Health, Education and Welfare is responsible for 80% of the total grants funded from the federal government to recipients. These grants are on an accelerated rise and have grown in dollar value from a budget of $40 billion in 1965 to over $51 billion in 1970.
The data that is being accumulated in the data bank consists of a higher level at present than is desired due to the lack of secondary recipient information being reported by all of the Agencies. Even with a higher level of data being reported, the file consists of 40 million characters representing 125,000 master records by recipient, individual program line item and geopolitical location.
Due to this file size any resultant computer print-out of the total file or even selected summary reports results in an unmanageable size report due to its numerous pages and bulk size. This condition forced the issue of micromation and as a result of this dilemma the following prototype system has been installed.
The data that is input into the data bank is all coded data that requires translation in addition to verification and edit. This data is processed through an IBM 360/65 operating system with MVT. Immediately after all of the data is generated into a data bank environment, the micromation process takes over. This process is to furnish magnetic tape input to a local service center which then processes the tape through a DatagraphiX 4360. The resultant microfilm in cartridge form is then furnished back to our operations group which views the master records that are formatted on film for possible correction action. This action has at this point eliminated all computer print outs of the computerized magnetic tape. Corrections of erroneous data, incomplete fields, etc., are accomplished directly from the microfilm by utilization of a reader/printer in our operations. The printer serves to provide hard copy in a format conducive to key punching for corrections that are annotated.
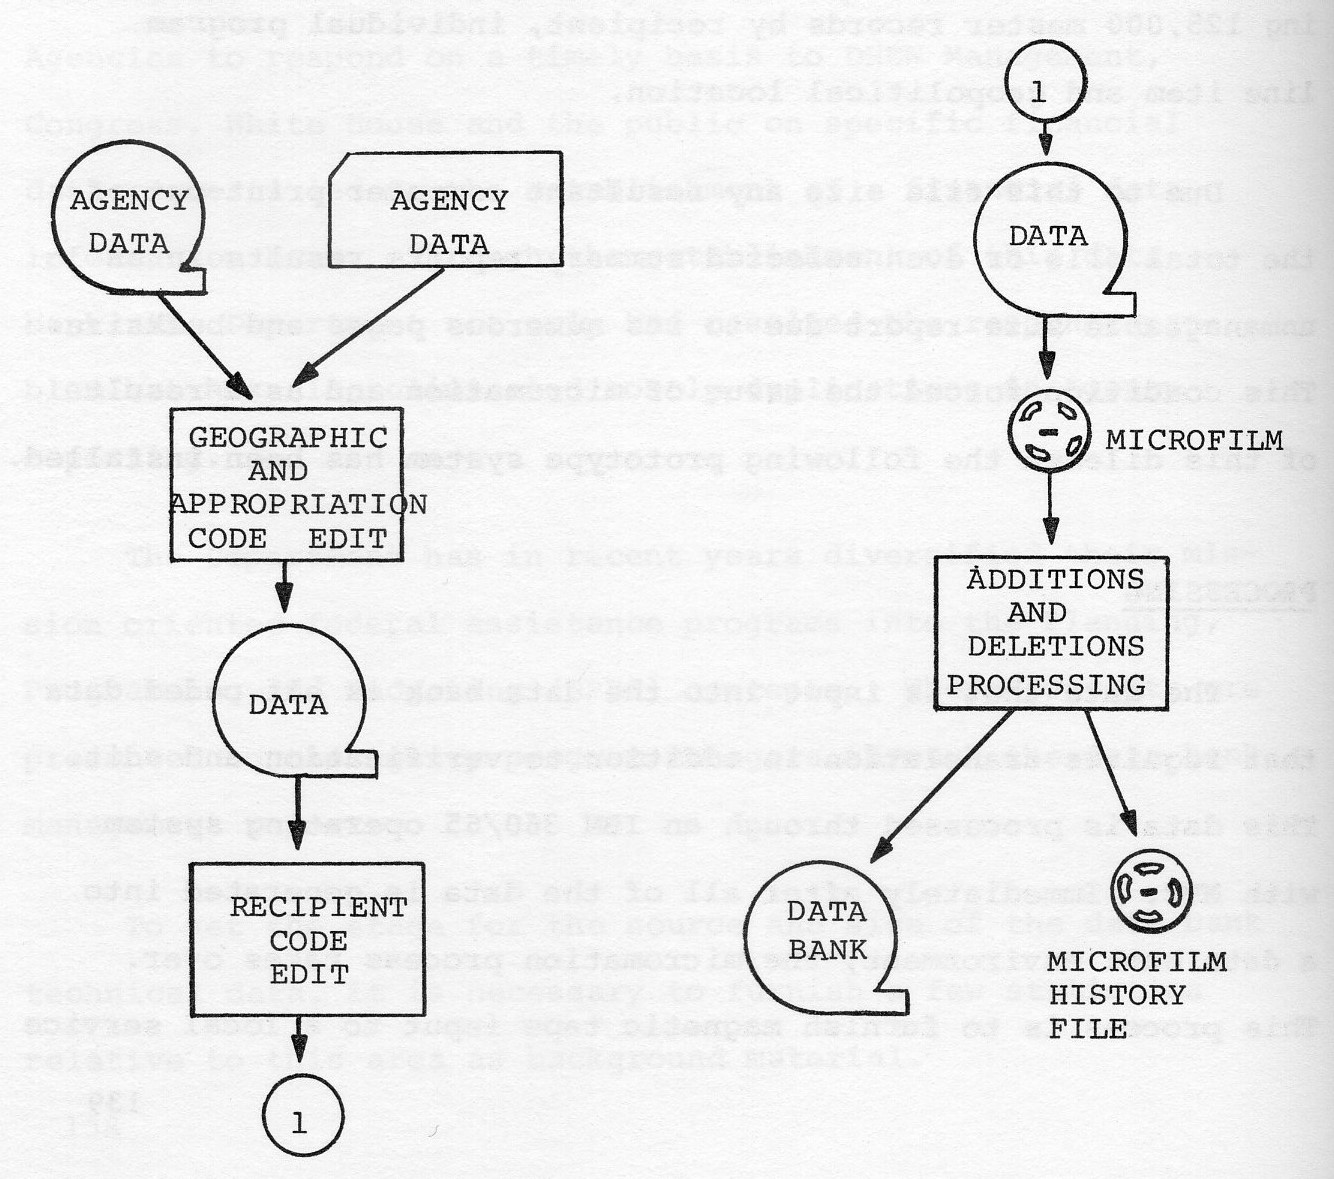
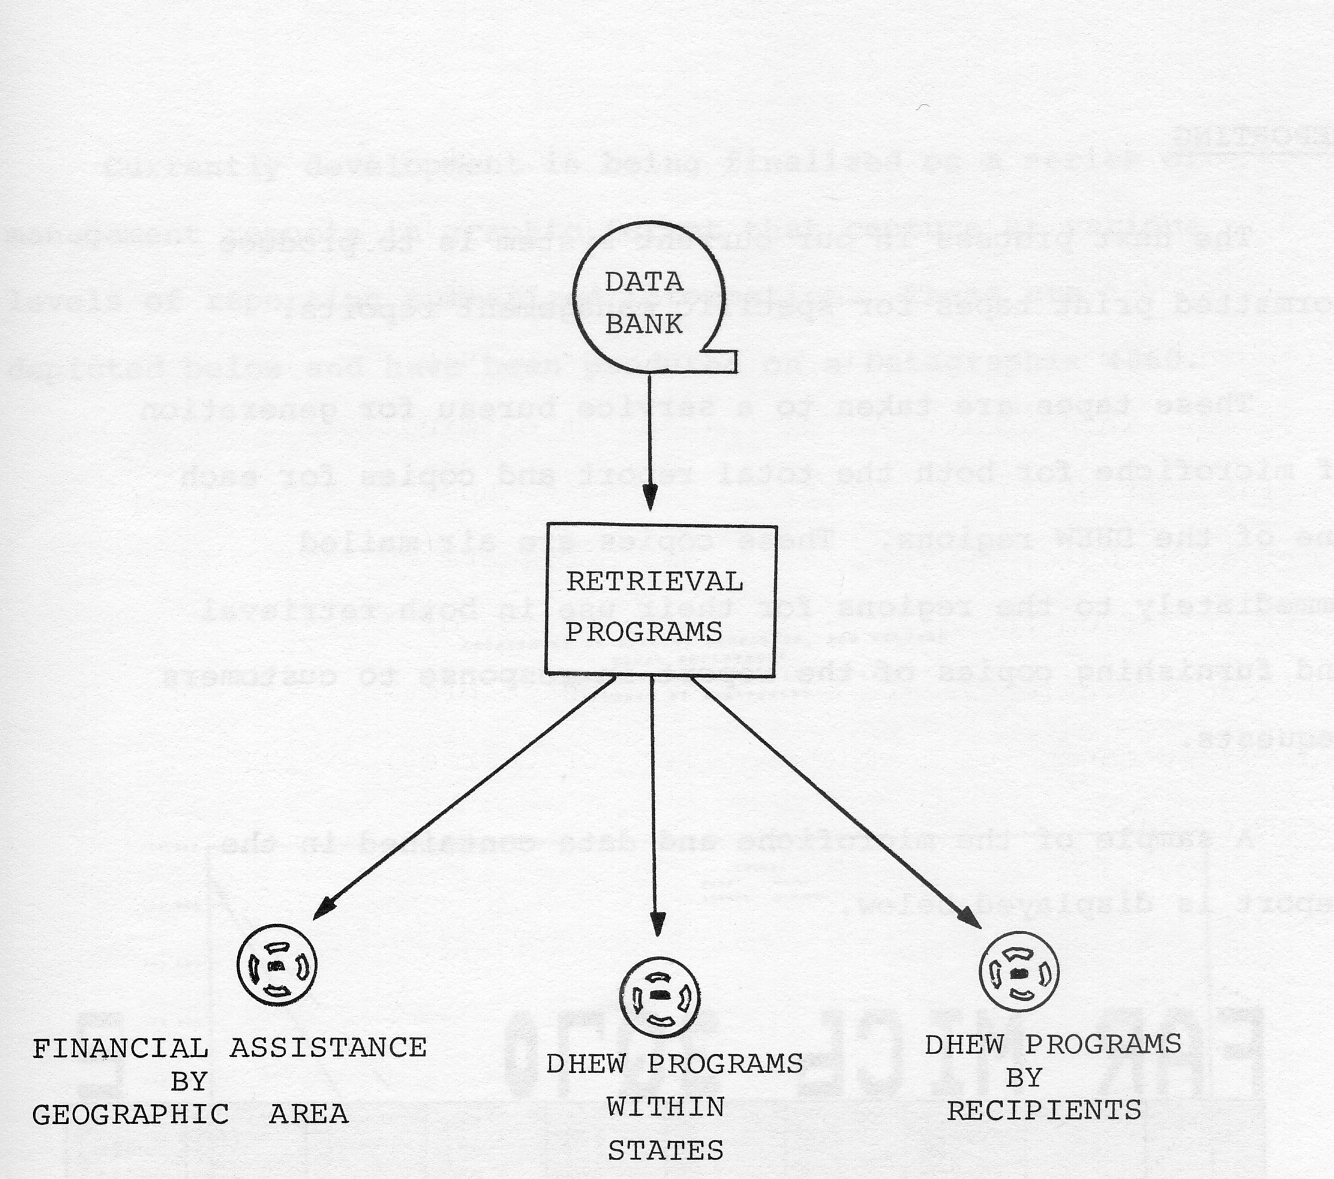
The next process in our current system is to produce formatted print tapes for specific management reports.
These tapes are taken to a service bureau for generation of microfiche for both the total report and copies for each one of the DHEW regions. These copies are air mailed immediately to the regions for their use in both retrieval and furnishing copies of the report in response to customers requests.
A sample of the microfiche and data contained in the report is displayed below.
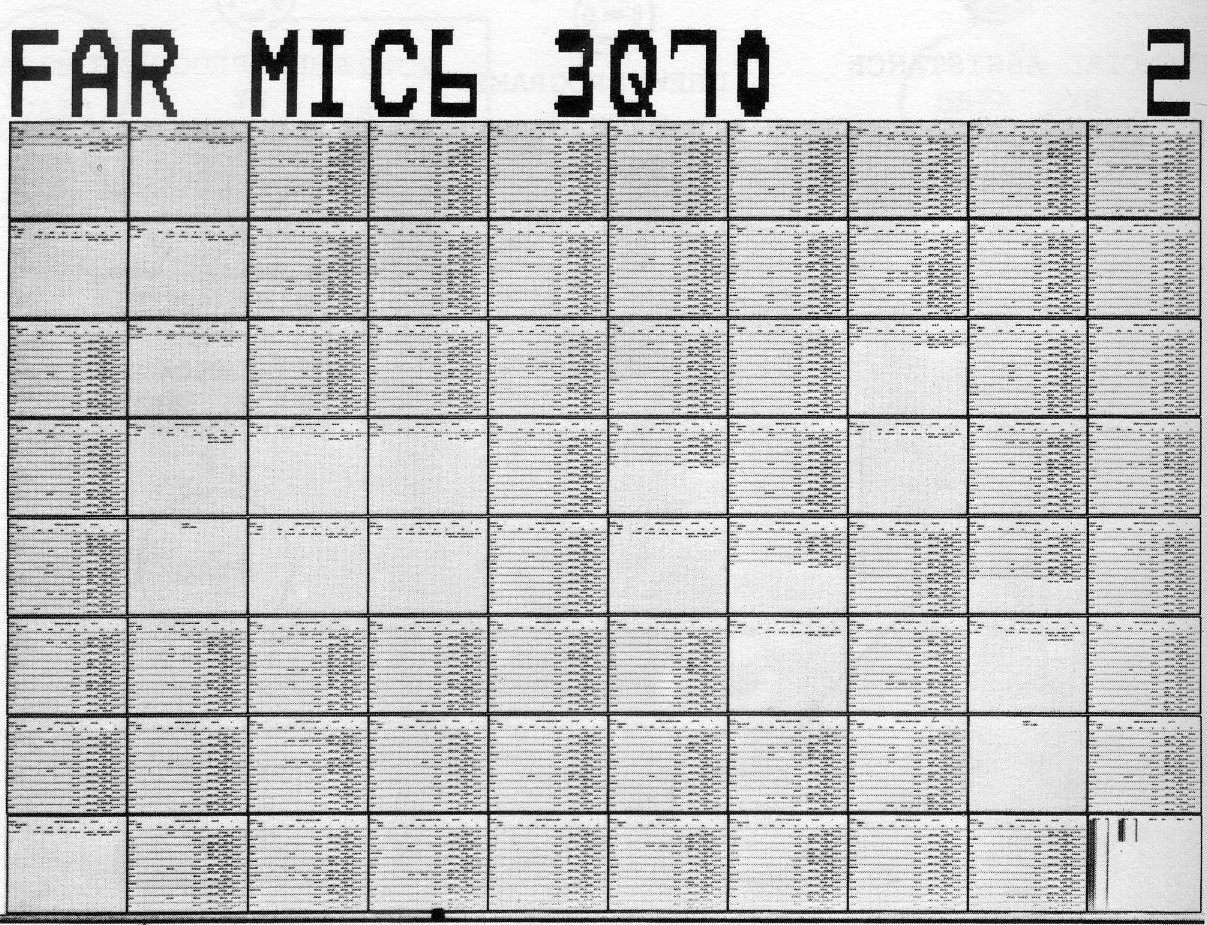
Currently development is being finalized on a series of management reports in graphic format that capture at various levels of reporting summarized information. These are depicted below and have been produced on a DatagraphiX 4060.
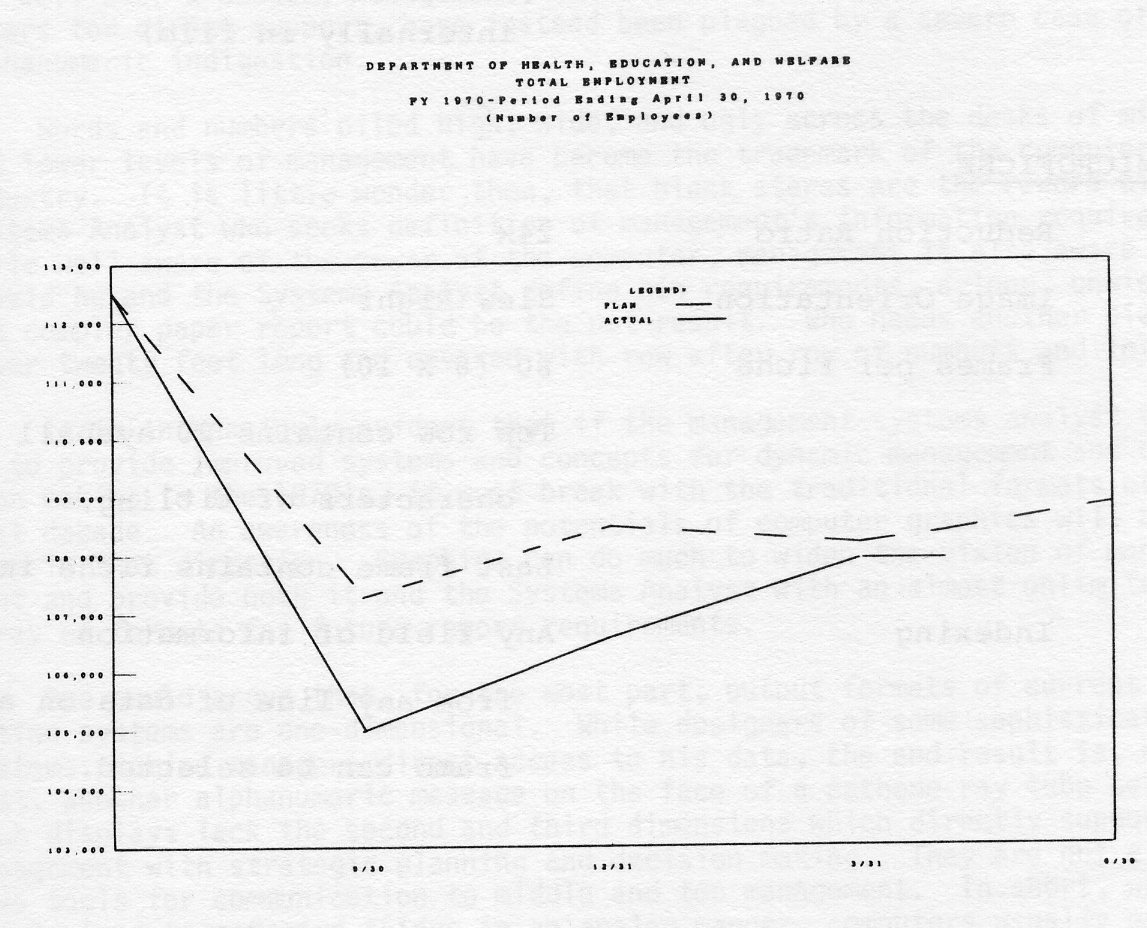
   CARTRIDGE FILM
            Reduction Ratio          24X
            Image Orientation        CINE
            Frames per Cartridge     2800
            Indexing                 Odometer (Index log stored internally in film)
   MICROFICHE
            Reduction Ratio          24X
            Image Orientation        Slew Right
            Frames per Fiche         80 (8 × 10)
                                     Top Row contains 20 eyeball characters of titling
                                     Last frame contains fiche index
            Indexing                 Any field of information from any line of data
                                     can be selected
Along with third generation computers, one could assume, would come third generation Management Information Systems. Unfortunately, however, this is not the case. For the most part, the characteristics of Management Information Systems of today are very similar to those of several years ago. For well over a decade, management, while waiting for the wonders of computers for direct support, have instead been plagued by a severe case of alphanumeric indigestion.
Words and numbers piled high, wide, and ugly across the desks of middle and lower levels of management have become the trademark of the computer industry. It is little wonder then, that blank stares are the reward of the Systems Analyst who seeks definition of management's information requirements. While well aware of the power of the computer, management is also aware that, should he and the Systems Analyst define his requirements, a long, unwieldy, and complex paper report could be the net result. Who needs another piece of paper twenty feet long and covered with row after row of numbers and letters?
It is increasingly evident that if the management-systems analyst team is to provide improved systems and concepts for dynamic management and decision making in the 1970's, it must break with the traditional formats of the past decade. An awareness of the potentials of computer graphics will be a step in that direction. Graphics can do much to widen the vision of management and provide both it and the Systems Analyst with an almost unlimited array of formats for future report requirements.
One could argue that, for the most part, output formats of current information systems are one-dimensional. While designers of some sophisticated systems promise managers direct access to his data, the end result is, at best, another alphanumeric message on the face of a cathode ray tube terminal. Such displays lack the second and third dimensions which directly support management with strategic planning and decision making. They are not effective tools for communication to middle and top management. In short, while people tend to perceive things in an analog manner, computers usually present their output in alphanumeric form, a form difficult to analyze and assimilate.
Late in 1966, system designers of the Army Materiel Command (AMC) initiated efforts aimed at improving the flow of computer information to the operational levels of the Command and to the Army in the field. Concurrent with that effort, research commenced on various computer techniques which could support improved information displays for all levels of management. Subsequently, in early 1967, the Department of the Army approved a three-phase project known as the AMC Non-Impact Printer Project (NIPP). The objective of phases one and two of the project was to determine, by prototype tests, the feasibility of operating high speed Computer Output Microfilming (COM) and film processing centers within an Automatic Data Processing (ADP) environment. In early 1968, the Department of the Army agreed that results of the test supported expansion of COM to other Army facilities were warranted by print volumes.
One of the major aspects which weighed heavily in this decision, was the enthusiastic acceptance of microfilmed data at both the operational level of AMC and the Army in the field. Eight COM systems are now in operation within AMC, with others planned for the future. The COM systems have effectively stemmed the avalanche of paper into the operational level of the Command. Collectively, during the twelve months preceding September 1969, a staggering total exceeding 100 million pages of computer paper were eliminated from the functional areas of AMC. Advantages were not confined to just the customers of ADP services; by diverting computer printing to their off-line COM system, hard pressed ADP managers were able to free up over 20,000 hours of computer time.
The third phase of NIPP was devoted to the development of ADP techniques required to produce management reports in graphic format. Through the use of computer records, a special graphic software package, and a Cathode Ray Tube (CRT) Printer/Plotter, a new dimension has now been added to displays of management information. The technique, now operational and known as Micro-Graphic Reporting (MGR), owes its success to a small group of business and scientific computer programmers and systems analysts of the U.S. Army Missile Command (MICOM), a Major Subordinate Command of AMC. Working from nothing more than a concept paper, the scientific programmers of MICOM supplied the hands-on programming experience required to drive the CRT Printer/Plotter, while their business programmers supplied the data base and display requirements needed to support the many facets of a management information system.
The final product derived from the effort is a highly versatile, graphic software package which will now accept statistics and quantitative factors from any information system such as logistics, personnel, finance, etc., and plot them into a variety of time phased graphic displays. While CRT Printer/ Plotters have been in use for over a decade, their use has, in general, been confined to scientific and engineering recording applications such as flight trajectories, oil logging, and atomic recording. Why designers of business information systems have done little to exploit plotters, on even a moderate scale, can probably be attributed to a lack of awareness fostered by an equally uninformed trade press which, until recently, boomed impact printers as the easy way out of computers. The myth that plotters were difficult to program, was no doubt, a constraining factor, also. In the MICOM exercise, however, the business type programmers have handled the programming problem with little if no difficulty.
Briefly stated, the MGR concept is designed to provide middle and top management with the information they need in a format conducive to quick understanding, and most important, in a time frame conducive to effective management decisions. The MGR concept, using 16mm microfilm output from a CRT Printer/Plotter, encompasses the display of three segments of business system data. First, operational line item data required for day-to-day clerical needs is provided. For example, status of procurement contracts and work orders (AMC monitors approximately 1.5 million per year) would be displayed in tabular form. The second segment, appropriate to mid management, displays in graphic format the highlights of the completed cycle, pin-pointing workloads, problem areas, number of slippages, etc. Again, relating to procurement, the displays might reflect the collective amounts of obligations relating to contracts awarded during the month in various categories such as small business, cost-plus-fixed-fee, competitive, etc. The third and final segment of the MGR report is designed to provide top management with displays which reflect performance and trends against objectives over a wide time frame. For example, a Director of Procurement may establish objectives to award five percent of his overall FY Contract Funds to small business and thirty percent through competitive procurement. Accordingly, the MGR software plots the annual objectives to scaled displays, one display being produced for each procurement category. Against each display, actual performance for each month is plotted in the form of a continuous and variable trend line. Normally, twelve months of actual performance is accommodated in each display. By producing all three levels of information from a common data base, coincident with the same computer cycle, several advantages are accrued. First, all levels of management have access, should they desire, to the bits and pieces which make up the complete picture. Second, the MGR's are produced automatically, thereby greatly reducing the possibility of management acting on filtered information. Third, by using the full resources of a visual language, assimilation of information is greatly enhanced, while conversely, the possibility of misinterpretation is greatly reduced. As the old adage puts it - one picture is worth a thousand words. Finally, by having access to information undeteriorated by the effect of extensive time delays management has a chance to act and make timely adjustments which will improve the likelihood of their meeting objectives. The use of graphics as a management tool is not new; what is new, is that management can now expect and can now get from his information system, a new dimension to analyze his problems and support his decisions.
In April 1969 the Director of Management Information Systems for AMC, directed that the MGR concept be moved from the drawing board into operation. Almost coincident with that decision, he gave the Logistic Systems Support Agency at the Letterkenny Army Depot, Chambersburg, Pa., the mission to act as the consolidating point for an AMC Headquarter Management Information Systems. One of the Agency's initial tasks was to implement the Micro-Graphic Reporting concept.
The initial MGR products go directly to the heart of AMC's vast operations, depicting performance related to the many facets of a logistic system. Graphically portrayed in time phased displays, for example, are performance in stock availability (ability to fill a requisition from stock), percentage and number of backorders vs. requisitions, etc., at each Army National Inventory Control Point (NICP). Likewise, performance indicators from Army Depots are also displayed, as for example, number of receipts, number of shipments, tons of material in storage, etc. Each group of MGR displays, reflecting performance at the NICP's and Depots, is preceded by a MGR display which depicts the consolidated AMC performance, providing management thereby with the overall picture as well as bits and pieces which make up the picture.
Distribution of the MGR products is made to Command Group levels of Headquarters, AMC, major subordinate commands, and depots of AMC. The MGR displays, currently viewed in microfilm readers, are also adaptable to large screen displays and group conference discussions. To assure a high degree of uniform interpretation, each group of MGR products is accompanied by an information brochure which describes each display and defines the data elements used in its make up.
Branching out from the areas of supply, inventory, and transportation, MGR's are now produced in the areas of Procurement, Quality Assurance, Maintenance, and Research and Development. Other areas are under development and will be added as data flow networks are established. As the statistical data base for each functional area is structured, it becomes a segment of a Micro-master File stored in random access storage. In a later phase, exception reporting and selective correlation techniques will be applied. By use of these techniques-, all important facets, such as the inventory, procurement schedule, and maintenance program of an in trouble major item or weapon system will be graphically displayed, side-by-side for review by top management. Use of the interleaved graphic concept with a large screen, random access display system, will allow managers to sit together and view the MGR's while interacting with each other on obvious relationships of men, money and material problems. In many cases presentation of the correlated picture will provide management with enough information for immediate adjustments and decisions. Perhaps even more important, it may provide the basis for decisions on what not to attempt. Having enough information to avoid costly mistakes is a very high must when it comes to the management of huge blocks of our national resources. The same exception reporting techniques would, of course, apply to systems and programs where exceptionally good performance is noted as well. In this manner top management who has neither the time or inclination to look at each and every static display produced by the MGR system, can both appreciate the successes of his operation while applying corrective action to his problem areas. Responsibility for overall review of each functional area's MGR's lies in the respective Directorate or mid-management level of the Command.
By taking these basic steps to establish a sound statistical data base, and deal with the real world problems of making its supporting data flow network operational, AMC is preparing itself for even more dynamic concepts of management support. The Micro-Graphic Reporting Technique and its static display concept will probably continue as a requirement for many years to come. To place all statistical data associated with a Command Information System in a real time computer available to many remote stations would prove extremely costly. The next natural step, however, is to develop computer techniques which will support scheduled interactive exercises between operations research analysts or executives and various modules of the statistical data base. The link between the 0/R analyst or executive will be an on-line graphic display device. At scheduled intervals the analyst will call for certain files to be placed on-line to a computer which may be many miles from his display device. For example, should he desire to determine the optimum workload and cost requirements for a series of new maintenance/overhaul programs, the analyst would load known production rates, cost factors, and resources parameters into the computer, and by using a light pen and appropriate computer routines, he will manipulate the data until he arrives at a series of alternative plans or programs. The resultant graphic displays could project charts which reflect various workload units and related costs of each maintenance/overhaul program. While the analyst won't solve all problems, he will provide management with measured alternatives which, with sound intuitive judgment, will be the basis for effective management decisions.
The future of computer graphics holds many additional surprises, some of which are not too far away. Already several successful experiments have been completed using color for a third dimension of understanding. Programmable color for filmed graphics, geographical displays, movies, etc., produced on high resolution CRT Printer/Plotters is but months away. The same can be said for on-line color CRT display terminals. At first blush, programmable color may sound like just so much frosting on the cake, but results of early film tests have opened up a virtual mother lode of exciting applications in management, engineering, and publications areas. Probably the best exercise for appreciation of color graphics is to look at two drawings of a circuit layout, one in black and white and one in color; it leaves little doubt as to what color does for improved understanding.
Within the management environment, the use of Micro-Graphic Reporting and dynamic on-line graphic techniques, will do much in the 1970's to make the computer a closer ally in the decision making processes. The speed up and simplification of reports by graphic techniques will support long range planning and hopefully reduce much of the tension currently associated with third generation management. It will provide management with an opportunity to be more relaxed because it will be better informed and more confident in command and control of its mission.
The decision to go from on-line to on-time was not made quickly nor was it unopposed. The multiple merchant credit card authorization center faces problems not encountered by the Inter-Store credit system. An error in authorizing can affect not only the relations with the card holder, but with other card issuing companies and with the merchants who accept your card. Since the merchant pays a percent of the sales price and the card holder pays a carrying charge, both must be treated as customers. As a result, speed and accuracy are vitally important. The on-line system has three major factors in its favor.
To some of you, this last might seem a minor point. Having been in Micromation sales for over three years, I can assure you, it often plays a big part in the decision making process as to what type of information system will be used. To the small and medium size credit card centers, the on-line system has one major disadvantage which is, of course, cost. Since a great number of credit card issuing organizations are currently not making a profit from their card operation, more and more of these companies are looking for a system that can offer the advantages of on-line but bring the cost of each authorization down to a reasonable level. I believe the situation described in this paper is fairly common and have tried to objectively present all sides for your consideration. In order to do this, I have divided this presentation into four parts; (1) the application, (2) the on-line system, (3) the on-time system, and (4) the factors which shape the resulting on-time system.
The purpose of an authorization system is to protect the card holder, in that it keeps lost and stolen cards from being fraudulently used, and the credit card company as it allows them to control the limits of credit and stop potential credit problems. In order to do this with fairness to all, the system must be fast, for while the credit is being checked, both the credit card holder and the merchant are delayed; and accurate, as an error in authorizing will probably lead to a loss of money for the center and/or bad will from the card holder and embarrassment for the merchant who requested the authorization. The company being studied is in the small to medium class. It has approximately 200,000 accounts. Of these, 60 to 70,000 are considered active. To be active, a charge must have been made on the card in the past 12 months. The number of authorization calls, that is a request by a merchant to accept a credit card in payment for an item over a certain established floor price will be between 300 and 350 on a normal day. During the peak buying periods, which are Christmas and Easter, this will increase to 800 to 900. Of these calls, approximately 90% are made between the hours of 10:00 AM and 6:00 PM and approximately 8% of these calls must be referred to the credit area for a final decision. The other type of call received by the center is a customer service call. Most of these are made by the card holder and relate the name and address changes, balance checks, or questions about charges on a past statement. Occasionally a merchant will call to get a card number he forgot to imprint when the card holder was there. There are, of course, many other functions which take place in a credit card center, but only the authorization area is involved in this application.
The equipment required for the on-line system was:
In the case of the on-line system, two methods of authorizing charges must be described because of their requirement to have a backup system for the terminals. Twice a week an authorization journal of active accounts is printed on paper, and it is this report that is depended on as backup. In this particular case, this paper system is used not only when the system is down, which is approximately 10% of the time, but between the hours of 8:00 AM and 10:00 AM and 6:00 PM to 10:00 PM. The latter use of the paper system was an attempt to lower costs, since as stated only 10% of the calls were received during these off hours. The dual system was the second major drawback to the on-line system since it meant that authorizers had to learn, maintain, and operate two data banks. When the terminals were in operation, authorizers took the following action as a result of an authorization call. They entered the account number, merchant number, and the amount on their 2260's and in 5 to 8 seconds received backs (a) a positive response which gave the authorizer the account number, the name, and an authorization number, and the amount. The authorization number is then given to the merchant. This number is coded and used if there is a question as to whether or not the merchant had a particular charge authorized before granting credit. Or (b) a negative response which results in several things:
A member of the credit department using this information then makes the final decision as to whether or not credit will be granted. Calls received under the paper backup system are presently handled by three authorizers and one costing clerk. As each call is received, the authorizer calls out to the clerk, the account number and the amount. The clerk looks up the number in the journal and either gives an authorization number and posts the entry while the authorizer fills out an authorization card for a later update to the on-line system or the authorizer turns the account over to a credit personnel who handles the decision in the same way that was mentioned earlier. The journal in this case, of course, is used to replace the information supplied by the 1053. The main problem encountered aside from the lack of speed with the paper system is that any update, authorization, etc. made on the on-line system since the last time the paper system was printed out will not appear in the journal. This results from the fact that postings made to the on-line system are not made to the paper system. The paper system is only updated on a bi-weekly basis. As mentioned, the other call received by the center is a customer service call. Any updates that result from this kind of call are entered on the system via written form and keypunched. Another handicap under the on-line approach is only the active file is kept on-line and any references that have to be made to other than active accounts means going to the master authorization journal which is printed only once a month. The result of this is that information is posted and retrieved from three sources, the terminals, the active journal, and the master journal file.
The system requires the following equipment:
When a call is received by an authorizer the following takes place: the card number is recorded on an authorization card, the account is then located on the viewer, and if everything is in order, the merchant receives an authorization number. To complete the authorization card, the authorization number, the remaining available credit, the date, and the authorizer's initials are entered on the card. The last step is to enter the page number and whether that account can be found on the left or the right hand side of the page. This card is then passed on so that the other stations can annotate their film. When each station has annotated its file and indicated so on the authorization card, it is placed in the update file. If the account was flagged, a member of credit is notified. The credit personnel then pulls the jacket containing credit information and checked the authorizer's screen for the account information. At that point a decision is made and the card enters the update cycle. The physical location of the authorization and credit departments are doubly important under this system, because of the requirement for credit and authorization to have availability to the update information. The credit personnel will also have the responsibility of jumping into help the authorizers if they get flooded. In order to facilitate this, the credit personnel have been interdispersed among the authorizers. It is not expected, however, that they will annotate their film, since with little exception, they will make reference to the authorizers screen for credit information. This saves not only the annotating of two films, but it saves double lookup of an account at the time of a call. Credit will depend on two things when they have to help on the overload situation.
The card file or update file that I have referred to is a converted check sorter which is located on a lazy-susan in the middle of the authorization section. It is divided into approximately 100 cycles so that each section represents approximately 20 pages of account numbers. The second type of update is the status change. That is a major change made to an account during the day. These are of extreme importance and to make them stand out the cards will be pink as opposed to white for the authorization cards. The three most common changes of this type are:-
These cards are filled out and passed along for stations to annotate as were the authorization cards. This brings us to the two major drawbacks of the system:
As a result of the lack of space and the expense, the first system will probably be used.
The second drawback is a result of scheduling. Because of the demands on the computer, our cut-off each day for updates must be at 4:30 PM. As a result, the first thing each morning each station will have to go through and annotate their film for those authorizations and changes made between 4:30 PM and 10:00 PM when the center closes. The major advantages to this system are:
Now, as to why Micromation was selected to replace the on-line system and to discuss the selection of the various elements that do compose our Micromation system.
Once it was determined that a change must be made in order to lower the authorization costs, four alternative systems were studied:
The first of the decisions was whether to go onto fiche or to roll film. Three factors were considered to be critical:
The initial reaction was in favor of setting up a fiche system. Studies indicated that fiche was successfully being used for both DDA applications in banks and by a number of large retailers in their credit authorization centers. After much consideration, two factors motivated us to direct our efforts to installing a roll system instead.
The next step was to decide the best way to use the viewer and the annotate feature. Our first step was to see how much of an area we could mark on the film and how much flexibility we had. In the beginning we plan to run in a Cine mode since operators tend to find this a little less fatiguing and are easier to work with. We were stopped by two things:
After several attempts, using home made form slides, we determined that we could print this report two-up and still accurately annotate it, if we ran in a Comic mode. This means that we are annotating to within sixty accounts of our target. As with any Micromation application, forms design is very important. The authorizations journal, two-up requires sixty-one character positions per side of the page. These are divided into seventeen fields which are to be separated by vertical lines of various weights. Working as consultants to our Art Department, we accomplish two objectives:
Another attempt in making the form more readable is currently in the mill. Working with Photographic Sciences Corporation in New York, we have used our horizontal gain to spread our characters to their maximum position. Photographic Sciences Corporation is now trying to make a form slide which will properly overlay this information in its spread format. If this proves successful without being too costly, it will be another method of improving readability.
I would like to point out at this time that because we are a Service Bureau and charge by the page, it is hard for us to convince some of our customers that some formatting techniques used successfully in an in-house operation are the best way for them to go.
The use of a 25X lens in the viewer is an additional factor we feel can be used to improve readability and in many cases we recommended that the lens blow back be much higher. Using larger blow back for improved readability and decreased blow back for use with more personal viewers has increased both the flexibility and exceptability of Micromation within all our accounts. Unfortunately, we have not completed conversion of our system to date so I cannot render a final opinion but we believe the steps that have been taken to date in both overall system design and in personnel training will insure a successful system.
Insurance Company of North America is one of the nation's largest all-lines insurance companies, writing practically all lines of property, casualty, group and life insurance. Founded in 1792 in Philadelphia at Independence Hall as the nation's first capital stock insurance company, it sold the first marine insurance policy written by an American firm. INA underwrites insurance in the United States and Canada through independent agents and brokers. INA markets insurance in more than 110 countries on six continents through its own offices, agency representatives, or through working arrangements.
Insurance Company of North America is a wholly-owned subsidiary of INA Corporation, incorporated in May, 1968. In 1969, the company wrote over $859,000,000 in property and casualty insurance. Two major subsidiaries of INA are Life Insurance Company of North American, headquartered in Philadelphia, and Pacific Employers Group in Los Angeles. With a company of this size, efficient data handling as well as information processing, becomes a major objective of our data processing department. As with most organizations, our data processing unit acts as an internal service bureau to all other departments. EDP staff numbers about 500 including 200 programmers.
Tools supporting the needs of INA are:
Since early 1967, INA has had an on-line display system, which up to a few months ago included 3 IBM/2321 data cells and 25 IBM/2260 CRT display terminals in 4 different operating departments. These are Life Insurance, Customer-Billed Automobile Insurance, Loss Coding, and Personnel Departments. Data was displayed on the CRT after keying in the policy number, file information, and format code. Response time was excellent, but reliability often was poor -operating system, data cells, 2260's not always up. Service was suffering and costs were increasing to the tune of $500,000 per year - for just hardware. More costs were anticipated due to expected increases in business volume which demanded more and more 2260's and supporting hardware.
Since 1968, our Advanced Research department in the person of Mr. G Holzbaur, has been gathering and analyzing facts on Micromation. In the summer of 1969 this matured into a proposal to management to bring microfilm into INA.
We did some heavy research prior to the leasing of our Stromberg DatagraphiX equipment in the areas of applications and manufacturers. We had several built-in reasons for our decision to go DatagraphiX:
We installed the following hardware in November 4, 1969:
The equipment is housed in a separate room of its own adjoining the computer area. It is a separate unit from computer operations with its own specialist. It is a 2 shift operation now with 2 operators per shift and 1 supervisor who oversees quality control of film output.
The camera is run for a maximum of 1 hour then the processor is started, then the duplicator, the cutter, so that at some point all 4 machines are running simultaneously to get a stepped gant chart effect. This is very significant when you consider some jobs take 20 hours of camera time.
The application question was a bit more difficult to evaluate. Establishing an immediate pay back as the major criterion, we have attempted to replace an on-line information retrieval system with a microfiche system. Total cost of the on-line system runs about $500,000/year. Microfilm was projected to save INA approximately $250,000/year - hardware cost only. The microfiche system by definition should provide a higher reliability factor. Reliability was only one of the intangible benefits we foresaw in using microfiche to replace the 2260 display system. Others included:
Our first application was in Personnel, Employee History Records that were on-line and being referenced; 2260 terminals were put into microfilm format so that 42,000 records, the entire employee file, is contained on 70 microfiche. The microfiche are generated 64 lines per page in zig-zag mode. Each employee's record occupies a page and records are located from a separate index fiche. The entire file is updated every two weeks.
One 2260 was replaced with two DatagraphiX 1325's and two complete fiche files. The fiche system was readily accepted by the users and no problems have been detected or reported even though some users require occasional usage of the equipment.
In Life Insurance Administration we have over 155,000 policy records in our Master History File. Activity with the file involves processing of premiums, checks, new business and answering questions from service offices: the file is now on 250 microfiche with through policy records per page and indexed by policy number.
The file is updated twice weekly and completely redone each month.
Six DatagraphiX 1325's replaced five 2260's in this system initially, but after a month of operation four more were added so that each clerk would have her own viewer.
Master History Personal Lives Insurance files have been converted to microfiche. Records are formatted three to a page and the file contains 600 data fiche and 8 index fiche. One index is produced in policy number sequence and another in name and address alpha sequence.
The usage of the file is for processing premium checks, error corrections, answering customer inquiries, balancing accounts and for general informational purposes.
Indexing is the key to a practical system especially when dealing with a file of this magnitude and the indexes provided in this system were vital for user acceptance and workability.
This file is updated twice weekly and completely redone every two months. Turnaround is extremely important and the updating must be accomplished by the start of the working day following the cycle's file maintenance run.
Currently we are in the parallel test and conversion stage and are using about 20 DatagraphiX 1325's and will expand this to about 80 viewers when the system is fully implemented.
Microfiche was chosen because of frequency of updating in most applications (twice weekly); each cycle the updates are added to the base fiche file and new index fiche are created.
The 4" × 7" size at 42 times reduction was selected so we could get 280 (20 × 14) pages and keep the physical size of the file as small as possible.
The top 20 pages of each fiche is titled leaving 260 pages on each fiche for data.
If we would have selected the old 24 times reduction standard each file would be 3 times larger.
We record in zig-zag mode to attain maximum speed from the DatagraphiX 4440.
All present applications use a 3-way lookup.
Silver to Kalvar duplication was selected due to availability and that the 105mm duplicator is still the only dry-process fiche duplicator.
Purpose. The purpose of the fiche control package is to enforce INA microfiche standards and provide a consistent interface between the IBM 7080 hardware, IBM 7080 IOCS as modified by INA, the programmer, the DatagraphiX 4440 and the microfilm operators. The primary emphasis was placed on the operational aspects in the microfilm operation due to lack of experience within INA.
Restrictions. Restrictions of the IBM 7080 system are as follows:
The restrictions of the DatagraphiX 4440 are as follows:
Implementation {IBM 7080) is as follows:
Implementation of the DatagraphiX 4440 is as follows:
Standard operator setup. Only deviations are sequence mode.
The future depends on today. With the applications currently in use, there is a need for written acceptance from all users. Some of the complaints we have are:
Project request system -
DatagraphiX 4440 (DTL). Make the backspace key a true backspace; the present working mode is useless for any fiche or indexed recording mode;
Expand the dump option to 135 characters and print the record mark at the end of each record; replace the periscope with a small viewing screen; support of tab card width film; convert octal thumb switches to decimal where applicable; change decimal fractions based on the inch for dimensions to metric millimeters; international microfilm standards are in the metric system. There are limited business graphics through special characters or vector generation; one or two character sizes; allow switch settings for external switches to be brought in on tape; provide for positive checks that proper lens is installed, proper film loaded, proper tube rotation, etc.; possible small computer (mini-computer) interface such as a POP 8 or the equivalent to ease tape formatting requirements; allow for tape label checking, interface with a system typewriter.
Duplicating. For DatagraphiX 96 a cover to eliminate dust and shield the mounted Kalvar from fluorescent light; a 105mm manual roll to card duplicator (social security); a 105mm splicing station.
Cutter. A reliable 105mm fiche cutter.
Viewers. Automatic focus; true zoom lens; 50X blow back where viewers are used 8 hours a day; 105mm continuous roll viewer.
As the term COM (Computer Output Microfilm) implies, there exists a tie between the technologies of computers and microfilm. This relationship is not merely lateral. Both technologies are equal members in a hierarchy of information systems. Therefore, it can be implied that both technologies share a number of similar data management characteristics and concepts, but also are subject to many dissimilarities. This paper is intended as a contribution toward the understanding of COM produced, large-sized and volatile microfiche reference files. Volatility refers to the percentage of additions, deletions and changes of records in a file (volatility is the opposite of static). Reference implies that only one specific record out of many is to be retrieved (such as a specific telephone number from a telephone book). For the purpose of this paper an excess of ten thousand pages may be considered a large file. For illustration purposes and actual application at INA the outstanding loss file will be discussed.
Similarities between microfilm and computer based data files exist in their data access methods. Sequential files are visually scanned by an operator in case of microfilm and the computer does its scanning by programmed logic. For large data bases or random files, microfilm requires indices in a hierarchical structure; the same applies to the computer. In one case we may speak of fiche and page indices, in the other of cylinder and track indices. For certain applications list processing techniques may be employed. Of course microfilm based files must be much simpler in their data management schemes than computer based files.
Microfilm - at the present state of the art - is a final machine output product - like paper produced on an impact printer - intended for use by human beings only. Once the raw material has been used it cannot be reused. Microfilm properties are unlike the properties of magnetic computer storage forms (such as core, certain semi-conductor devices, magnetic tape, strips, disks, drums, etc.) which may be used over and over in total or part, but have their counterparts as Read Only Storage (ROS) in computer systems with the same built-in problems of altering small discrete portions of the data, addition or deletion of entire records. The ROS attribute of microfilm has a very pronounced effect on approaches to file organization.
For volatile files it is important to get the output product into the hands of the user as fast as possible. Impeding this goal are problems of sheer volume, failures of recording media (magnetic tape or film), hardware failures (camera, processor, duplicator, cutter, etc.) or plain operator error. These are factors along with the economics which heavily influence strategies of file structures and indexing schemes. At the end of the road, of course, is always the problem of user acceptance.
Records in a file must be logically organized so that they can be retrieved efficiently for processing.
In a sequential file, records are written one after the other in ascending physical locations. The records are usually in key sequence. Records usually cannot be deleted or added unless the entire file is rewritten. Usually magnetic tape files or roll film files are considered prime examples for the sequential file organization. Theoretically a sequential file could be infinitely long. In practice a large file will break up into several or many volumes of storage (tapes or rolls of film). If for each volume the starting or ending or both keys are kept in an index then we enter the next organization.
A partitioned file is one that is divided into several members. Each member has a unique name. Members may be picked for processing. Members may be added or deleted as required. The records within members are organized sequentially and are stored successively according to physical sequence.
An indexed sequential file is similar to a sequential file in that rapid sequential processing is possible. Indexed sequential organization, however, by reference to indexes associated with the file, makes it possible to quickly locate individual records for random processing. Usually there is more than one level of indexing required.
With direct organization, there is a definite relationship between the key of a record and its address. The records will probably be distributed non-sequentially throughout the file. If so, processing the records in key sequence requires a preliminary sort or the use of a finder file.
Strategies for file maintenance are highly hardware dependent. Most direct access storage devices readily allow the reuse of space for changing an entry, the deletion or insertion of records by means of manipulating reference pointers and the maintenance of overflow tracks.
Recording and retrieval is accomplished in sequential or random modes. In the case of magnetic tape for all practical purposes recording and retrieval is in one direction only. The one-directional recording mode does apply to all COM devices. The universal camera for the DatagraphiX units is strictly a sequential device from 16mm through 105mm (see Figure 1). Random recording is available with the Micro Image Systems, Inc CMS 7000 fiche camera but within the confines of one fiche only.
It is not possible to backspace to a previously recorded fiche. Certain retrieval techniques which work nicely on a computer do not lend themselves in the microfilm area (such as binary searches, division/remainder methods, folding, radix transformations, etc.). Retrieval schemes must be simple enough for an average clerk to handle with undue strain. This is accomplished through indexing.
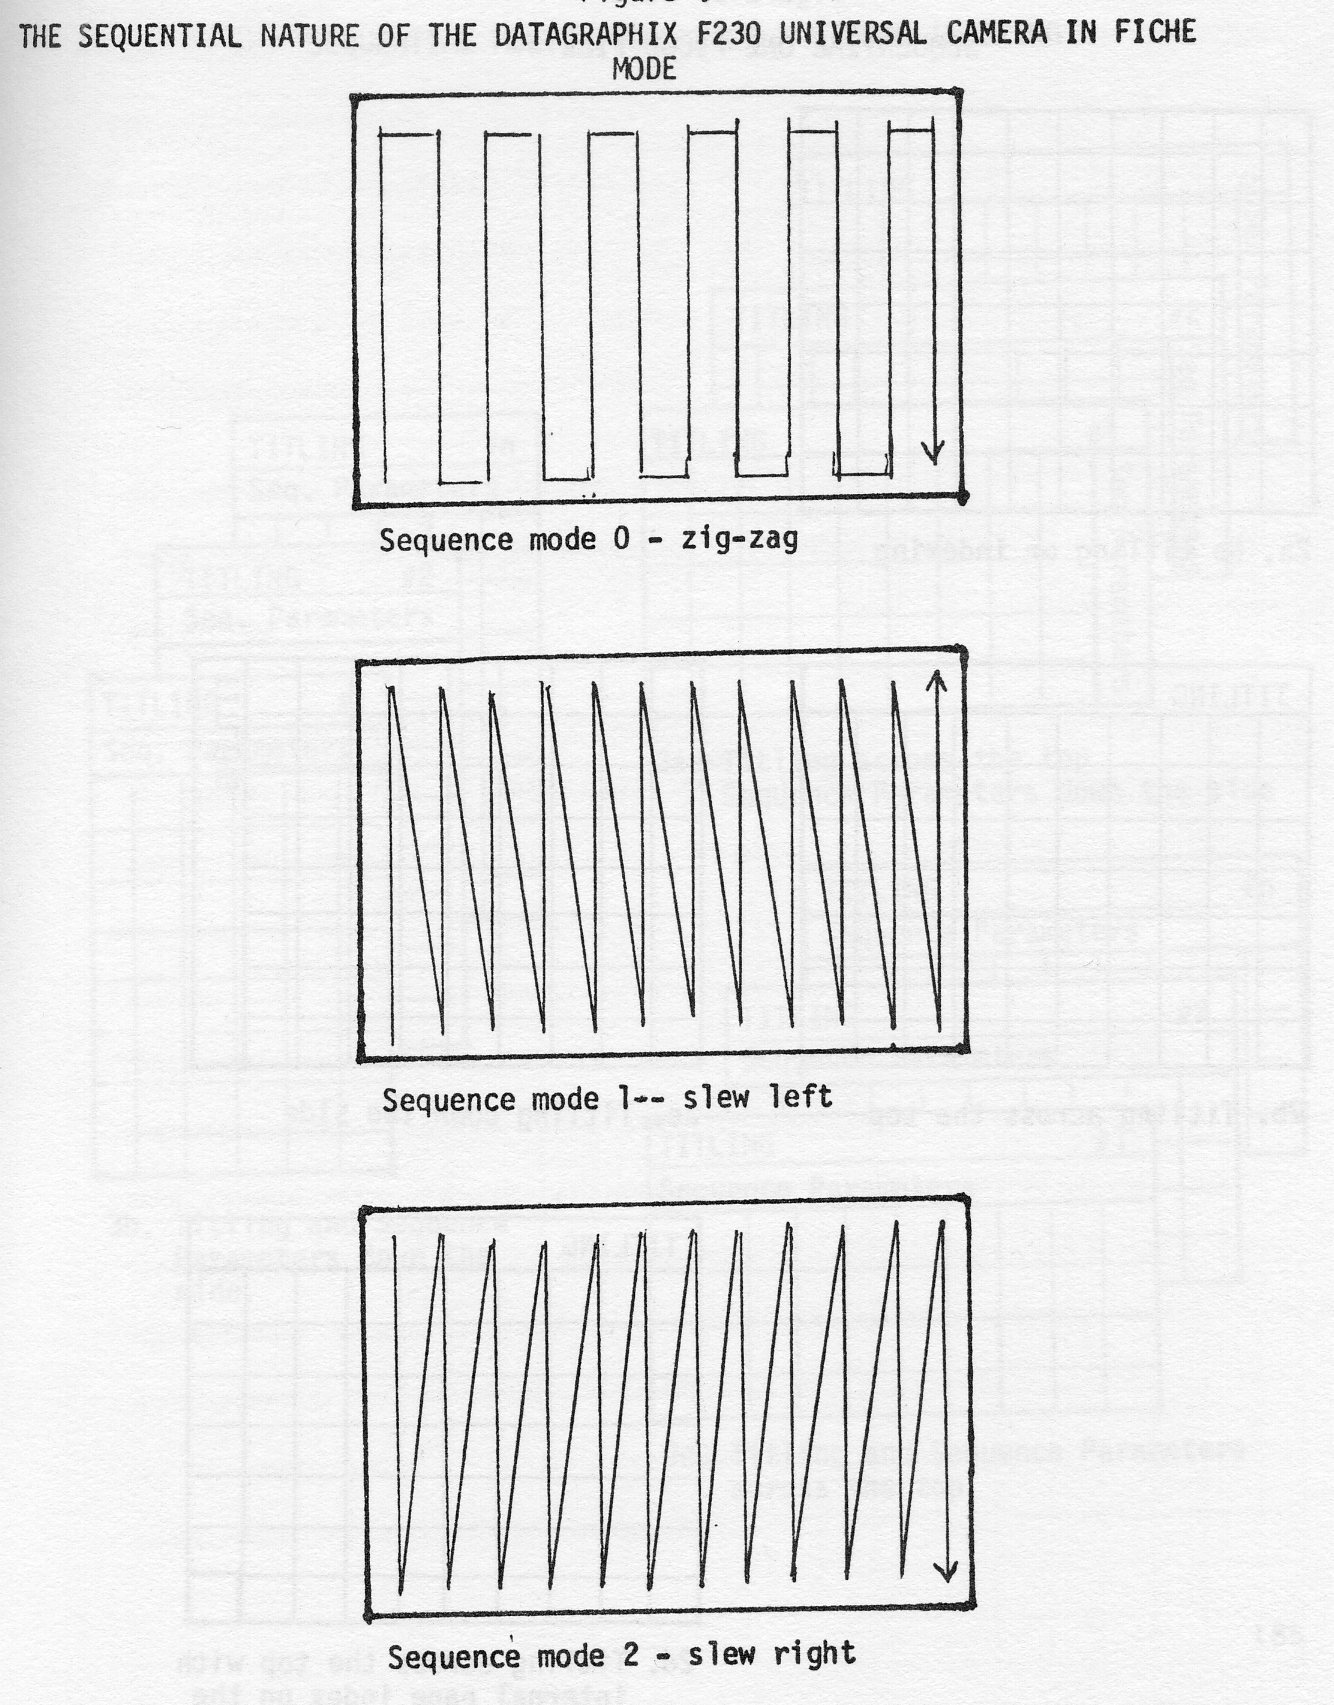
Very rarely is a computer file in a random sequence. To process large files on a computer economically and timely, a non-random organization is mandatory. A rational sequence for a computer file is not necessarily in a human consumable sequence. In the text following the term non-transparent sequence will be used for a file in a sequence that is not in the sequence required by the application. Let us take a look at various methods of accessing a fiche file.
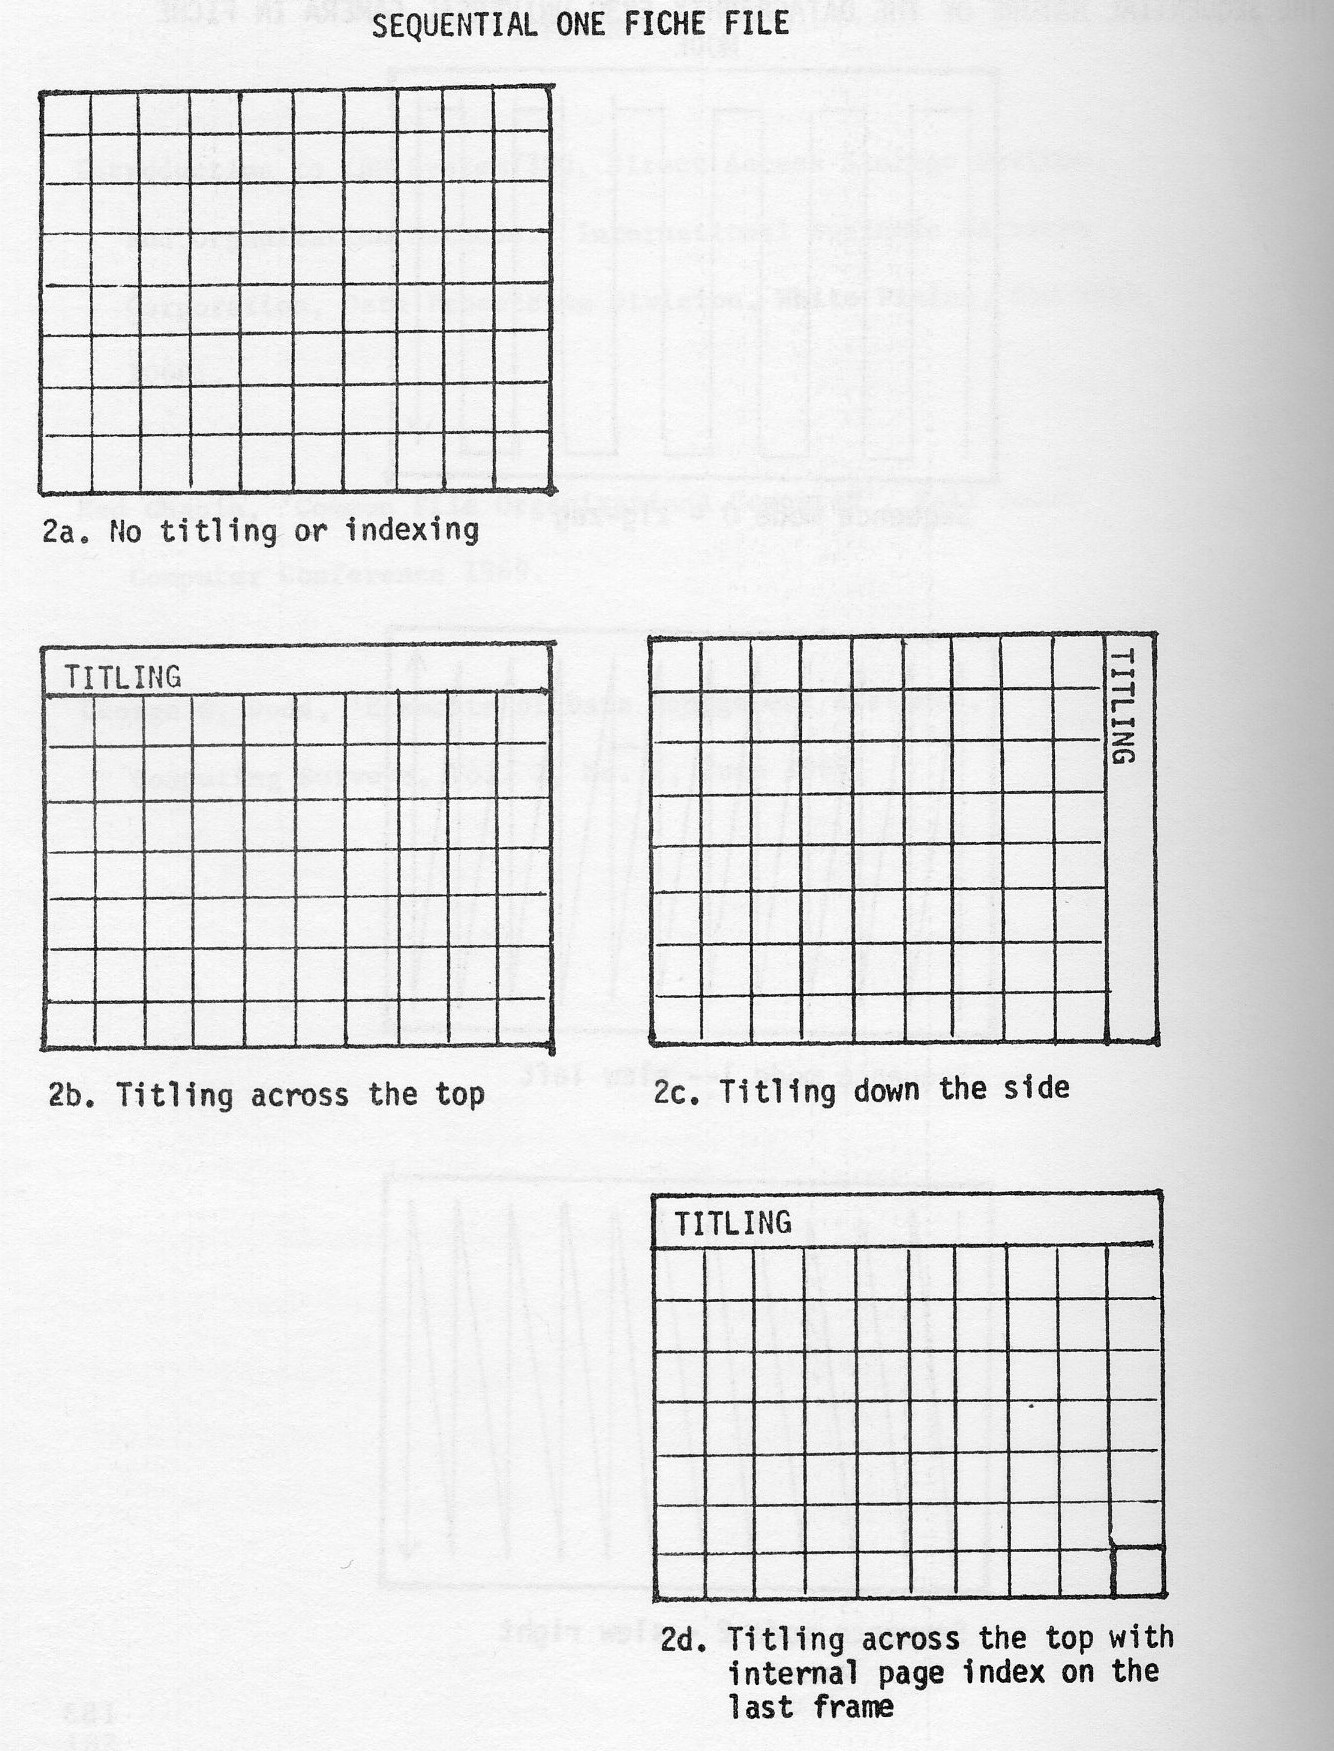
Access to a sequential one fiche file may sound rather simple. However, on a 4" by 6" fiche at 42X there are 224 pages, and at 150X (Ultrafiche) there are 3,200 pages. It can be safely said the more information contained in a volume of information, the more crucial accessing strategies become.
There are only two basic methods available to handle this situation successfully:
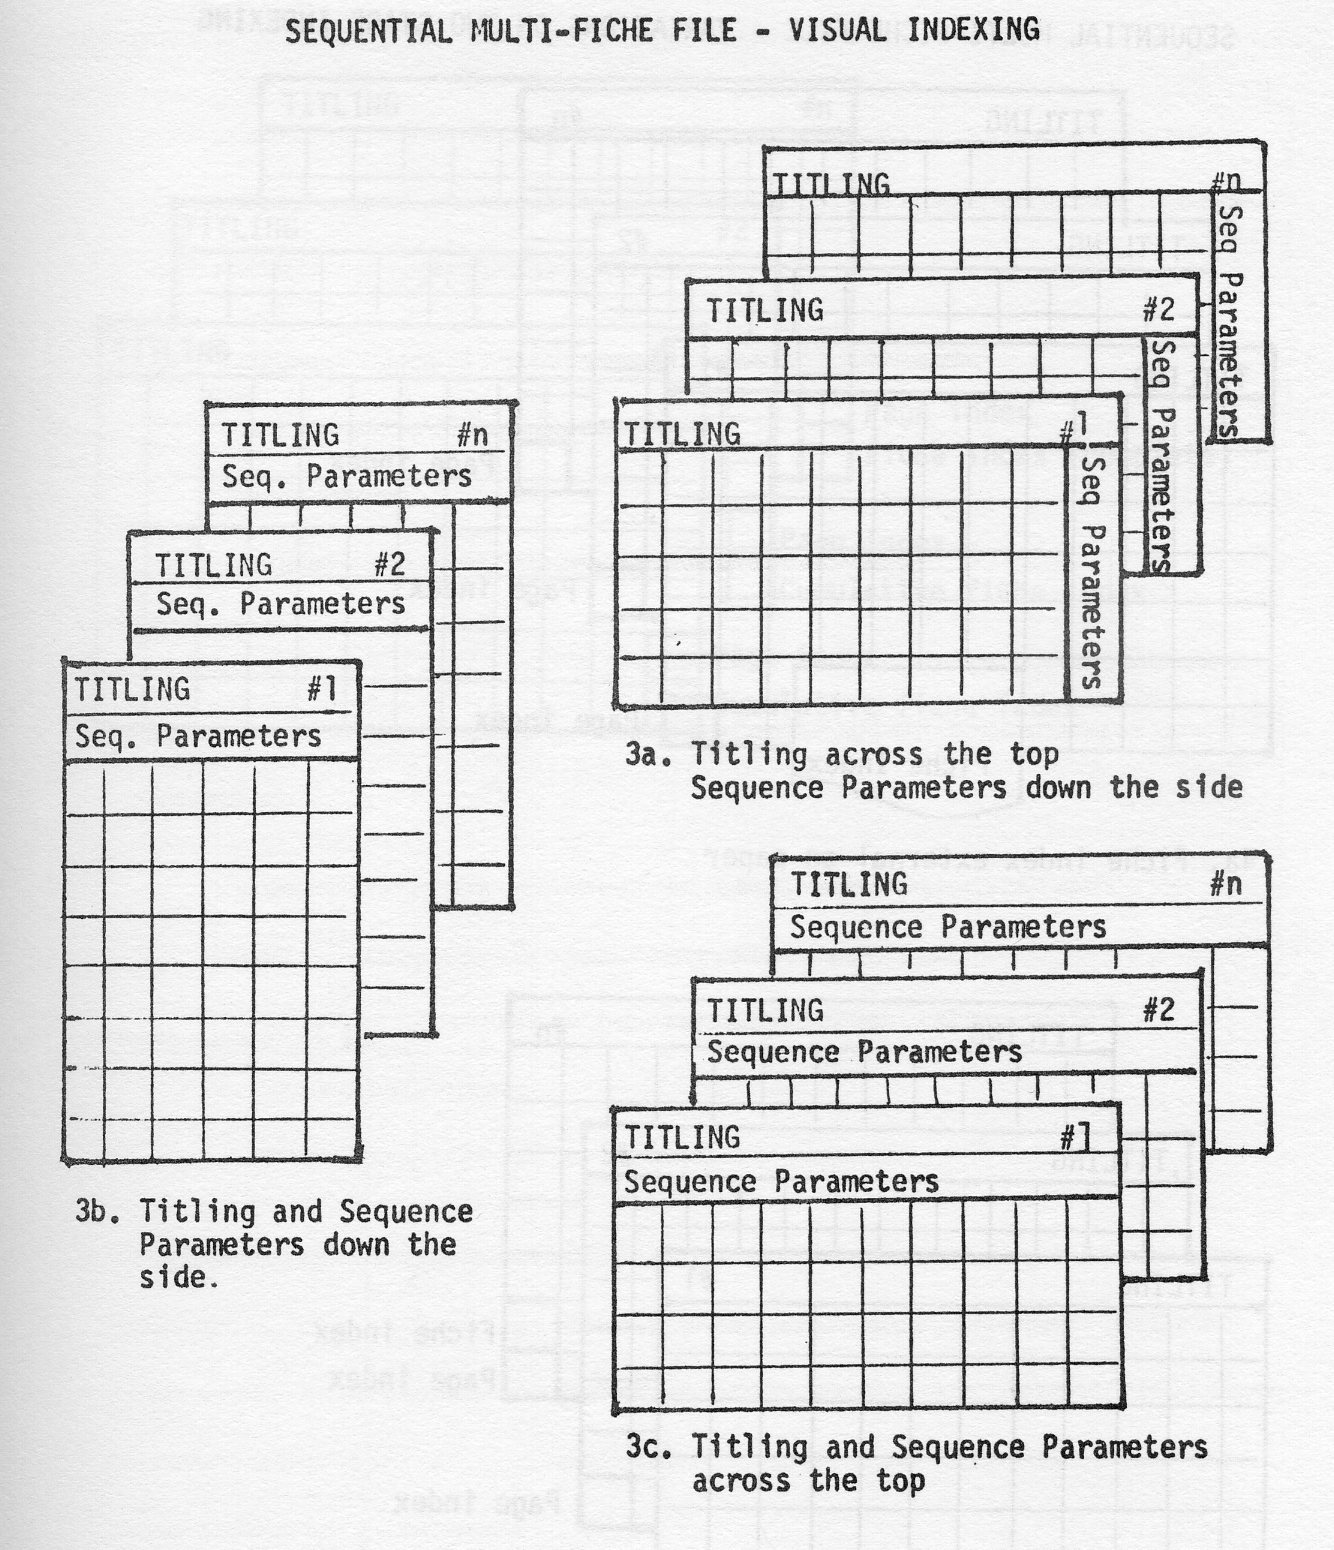
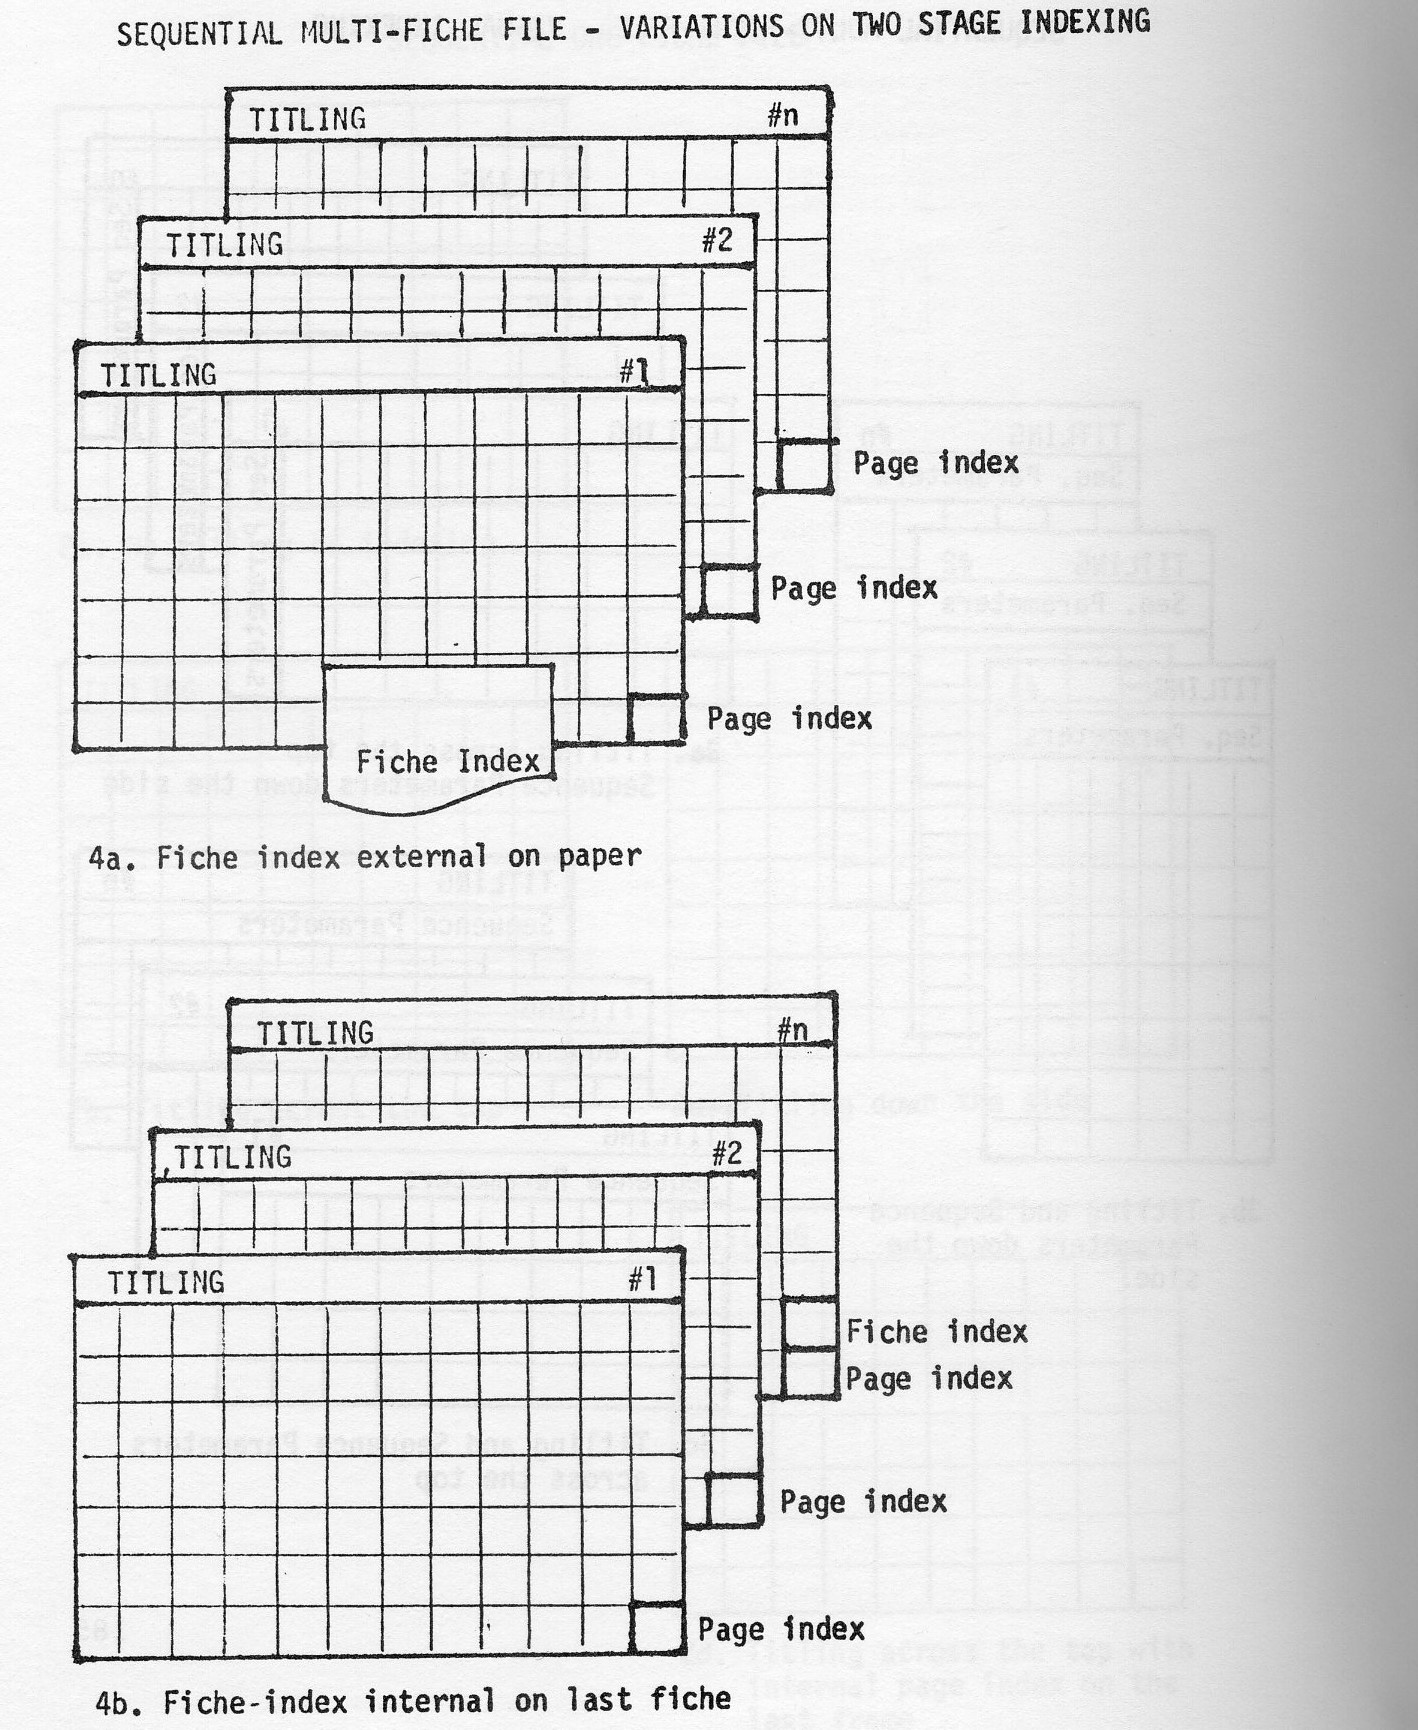
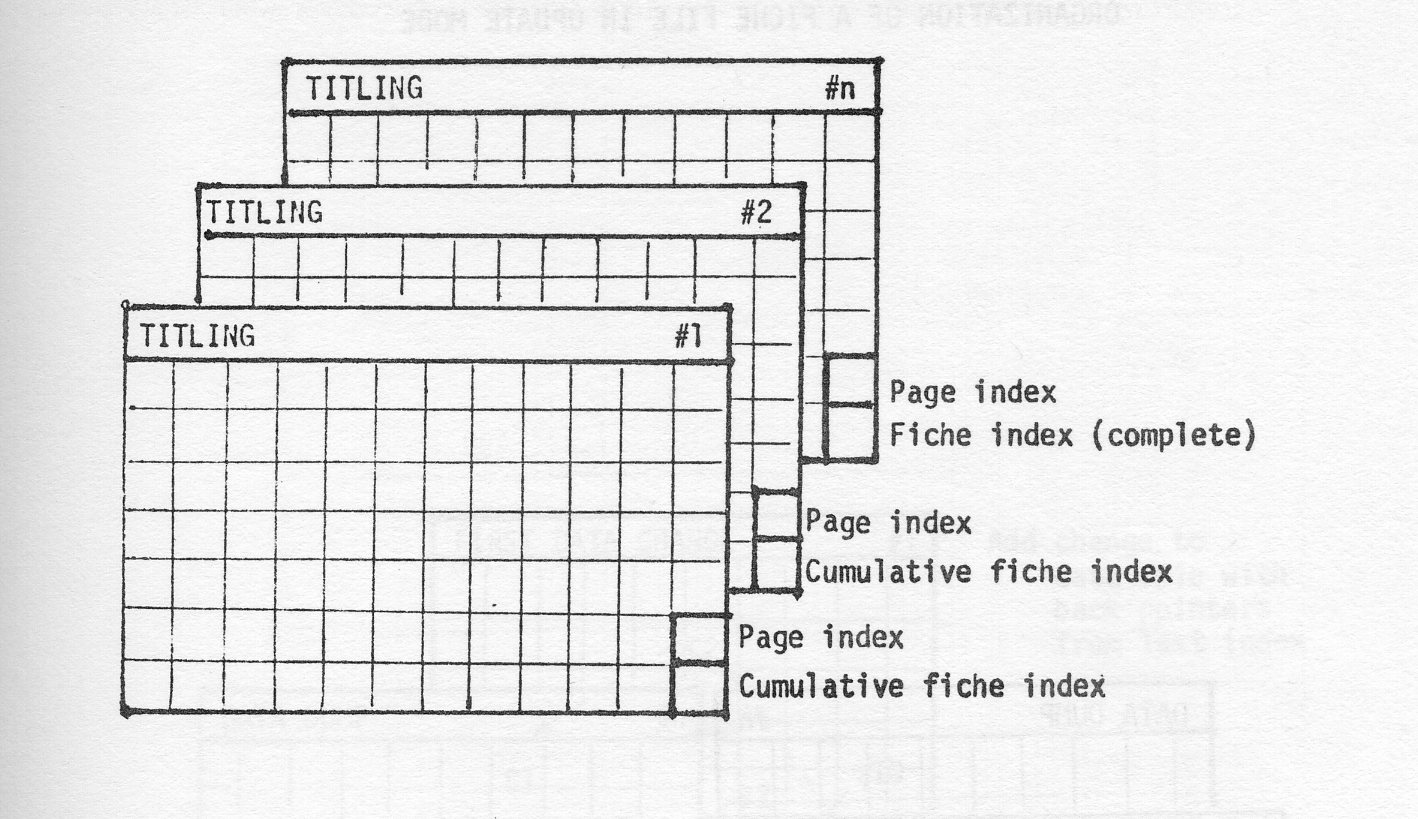
In large volume fiche files that cannot be partitioned, master fiche indices may require considerable space and special alternatives may have to be tailor-made. Indices incorporated with the data or text will be referred to as internal indices. Indices maintained separate from data or text will be referred to as external indices.
For all practical purposes there is only one method of entry into a file of this structure: the maintenance of an external index in any of the sequential organizations described previously. There must be one index entry for every data entry. This is probably the most powerful tool to a large data file. Access can be obtained based on any number of search arguments desired by merely generating sequential index files for each set of arguments. (See figure 5a.)
It must be emphasized that access into any file can only be accomplished by resolving the entry arguments into a sequential file structure regardless of the number of index hierarchies required.
Indexing is used in large microfiche files to obtain access to the function of a given argument. The strategy for indexing is governed by the sequence of the data, the volume of the data and the economics of the maintenance for current status of the data. The indexing strategy may have to be the optimum compromise between ease of access by the user and the coat of producing and maintaining a file. In a large data file the indexing scheme frequently results in a hierarchy of indexes necessitating a multi-step look-up procedure.
Internal Indices are incorporated in the data or text fiche file and may be at predetermined coordinates or not.
External indices are separate files of references into a data or text file.
Page indices are internal indices pointing to the various pages on a given fiche only. A typical page index shows the range of arguments for a given page. A prerequisite is the sequential structure of the data or text.
Fiche indices may be internal or external, pointing to an individual fiche in a multi-fiche file. Sequential organization of the data file is implied.
Range indices may be external or internal to a sequential fiche file showing the pointers of argument ranges only by page or fiche.
Detail indices may be internal or external providing an entry by argument and location for each detail entry in a data file. The use of this method suggests that the data file is in a non-transparent or random sequence.
Cumulative indices are generated for higher than page indices in the index hierarchy at predetermined coordinates to reflect the accumulation of the pointers up to this time.
Back pointers are pointers to the previous activity for the same argument embedded in the present record to provide an audit trail or chain.
Tree structure implies a hierarchy of indices or pointers which may be used for vertical or horizontal file organization.
Reference marker is an entry on every page on a microfiche showing at least the x and y coordinates of the page. Inclusion of the fiche number is desirable. The reference marker is extremely helpful to the user when looking up a page in a file of non-transparent sequence. Automatic fiche cutting and viewer alignments especially in higher reduction ratios frequently are not precise enough to accurately locate a given page. The reference marker is used by the operator to make the necessary adjustments to locate the desired page.
Probably the best approach is the use of internal page and fiche indices at predetermined coordinates. Should the file be of large size - in excess of 300 fiche - then partitioning should be attempted. The partition argument should be shown in the titling row. Index tabs in the fiche tub are used to separate the partitions. The last fiche in a partition will contain the complete fiche index for that partition. If the work load can be presorted in descending sequence, then a very efficient work flow can be maintained by the user.
Should a large sequential file be subject to frequent changes with a relatively low rate of change (under 20%), it may be desirable to merely add to the base file all items that have been changed. There are three basic approaches:
The use of updated (indexed) sequential files in the case of multiple functions for a given argument (such as John Jones in a large name and address file) may be very impractical and the design of an adequate structure and indexing strategy must be considered very carefully.
(See figures 5a-c.) Files in this organization are divided into two parts: The data or text file and the (indexed) sequential external index file. For any changes to the data a complete new index file must be generated. The indices are on a detail level and point to the latest function for a given argument in a file. Back pointers to the previous reference should be included in the new data or text entry for an audit trail rather than retaining this old reference in the index.
Of course, an index must show the search argument or the range of the arguments and the address where an item is located. For files that are heavily used, tight packing is not recommended. Good approaches are single spacing in groups of 5 or 7 with sufficient white space between columns and rows. Double spacing of entries also has been used successfully. For frequently referenced fields within the data or text, it may pay to have an indicator represented in the detail index. For instance, in a credit card file indicators may be shown for cards reported lost or stolen, dead beats, returned or expired, credit limits, etc. An index should be constructed to serve as an easy and efficient tool.
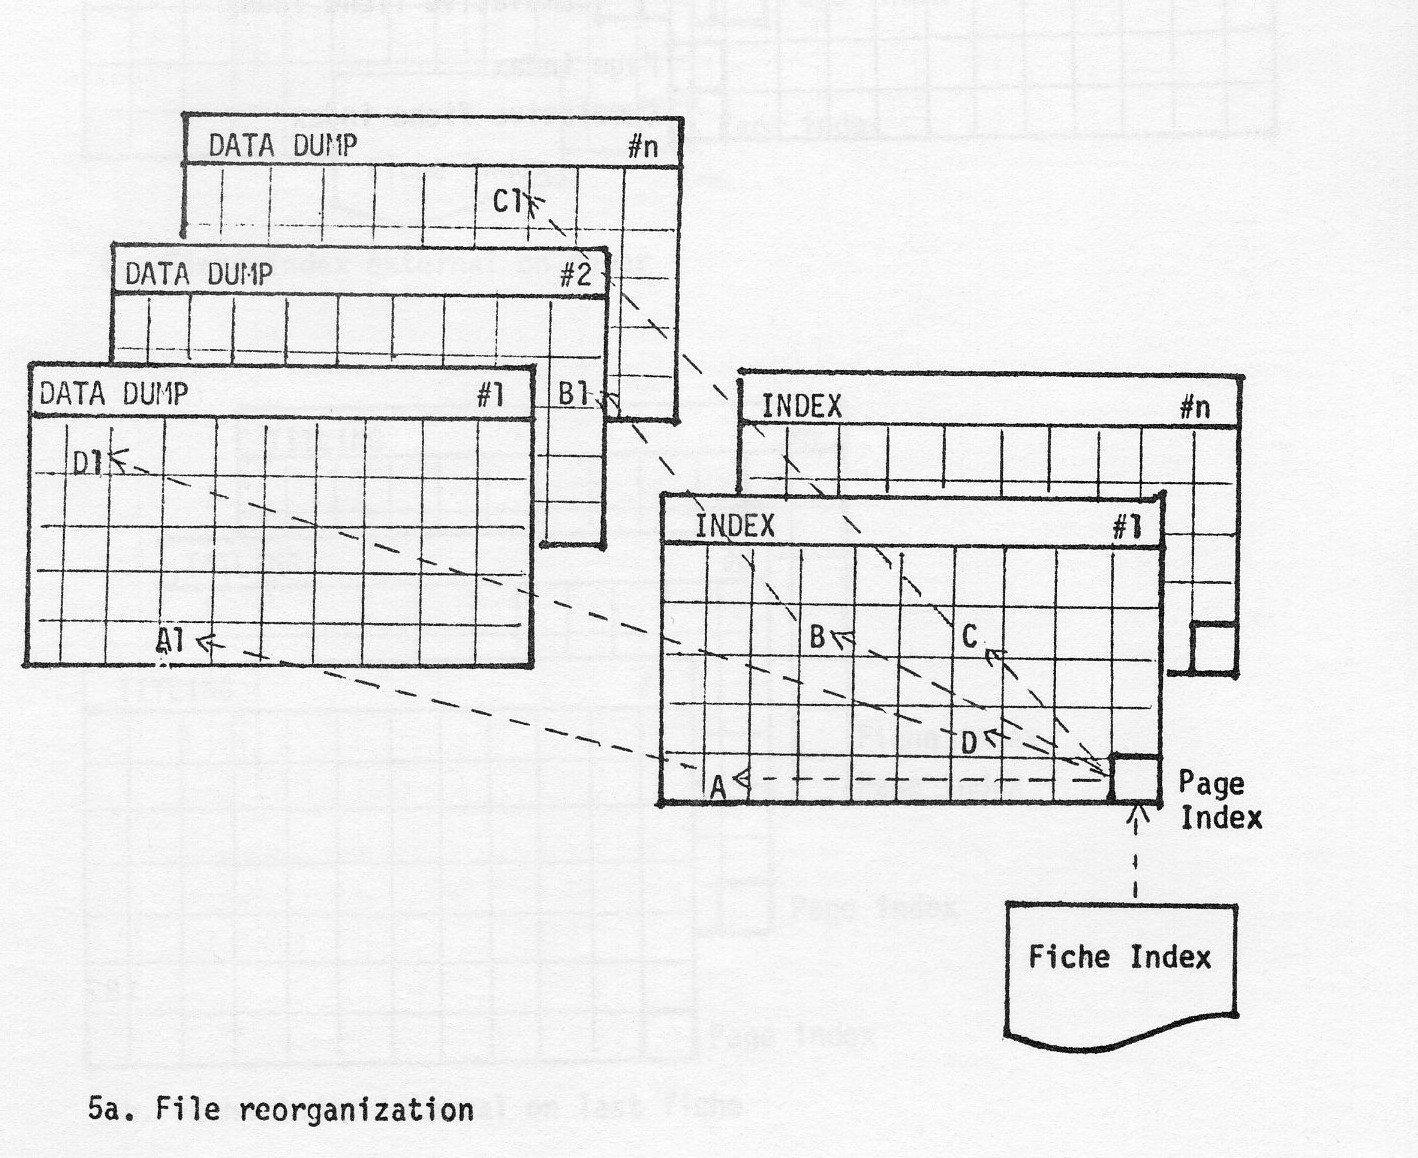
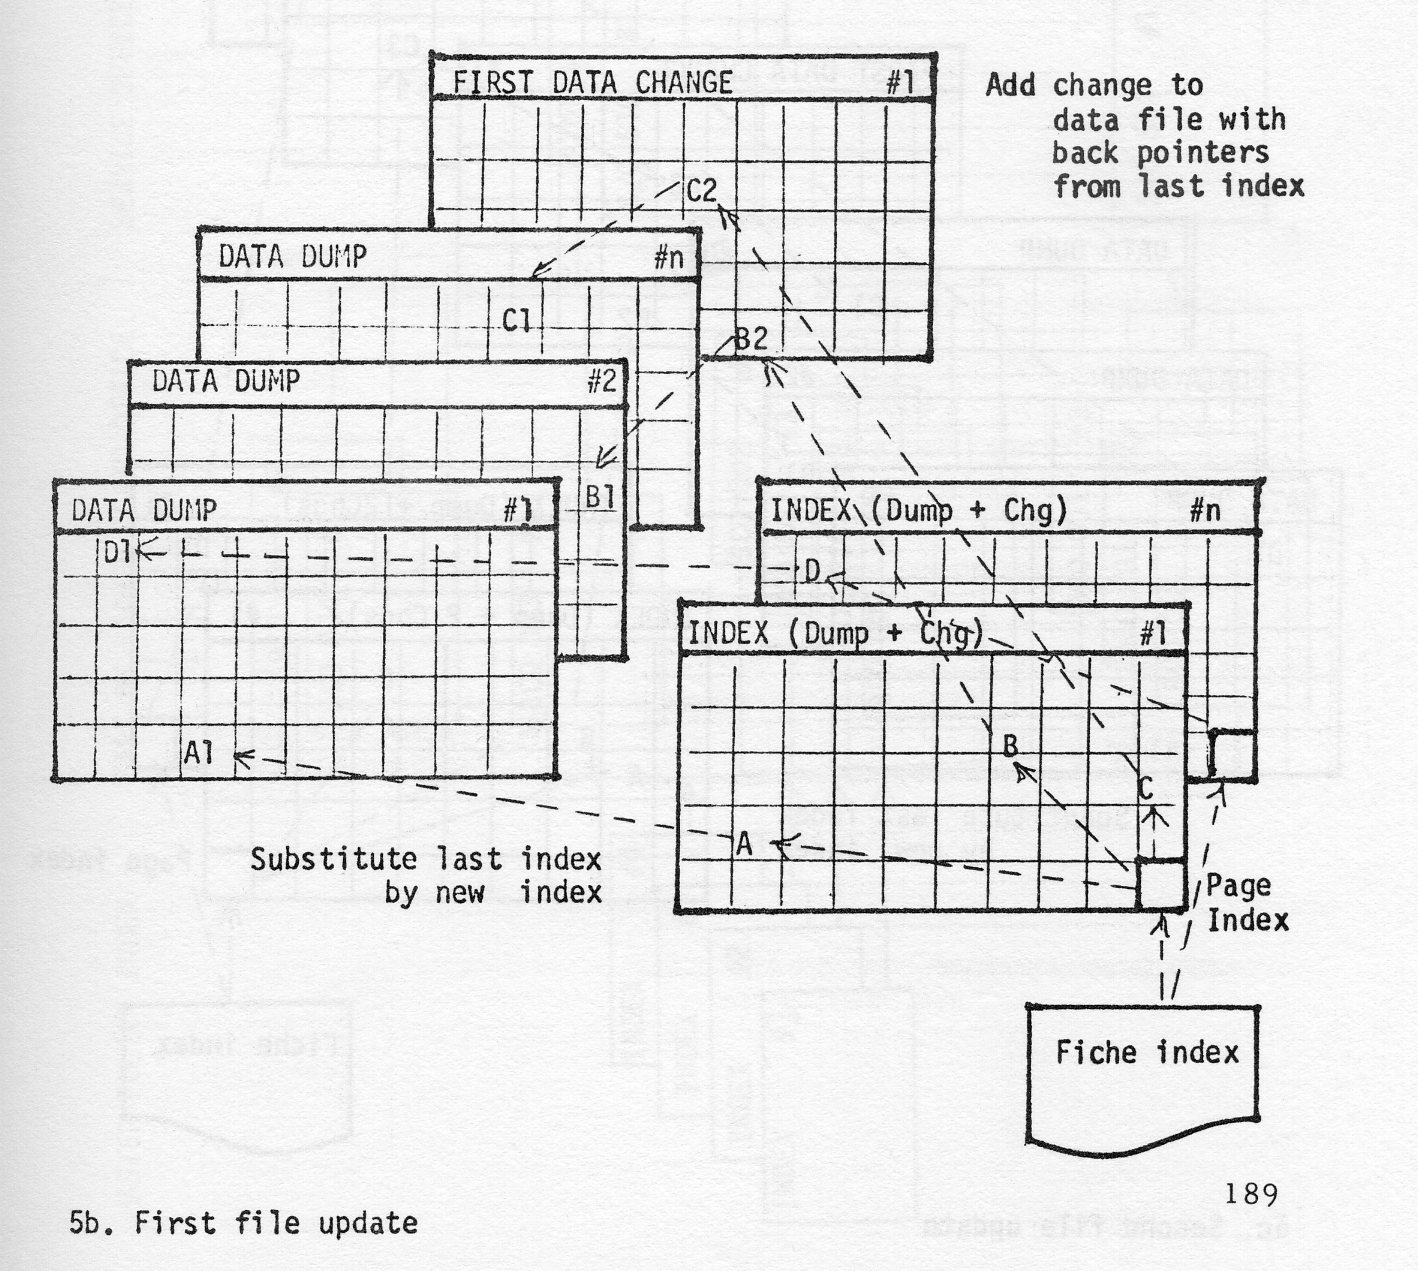
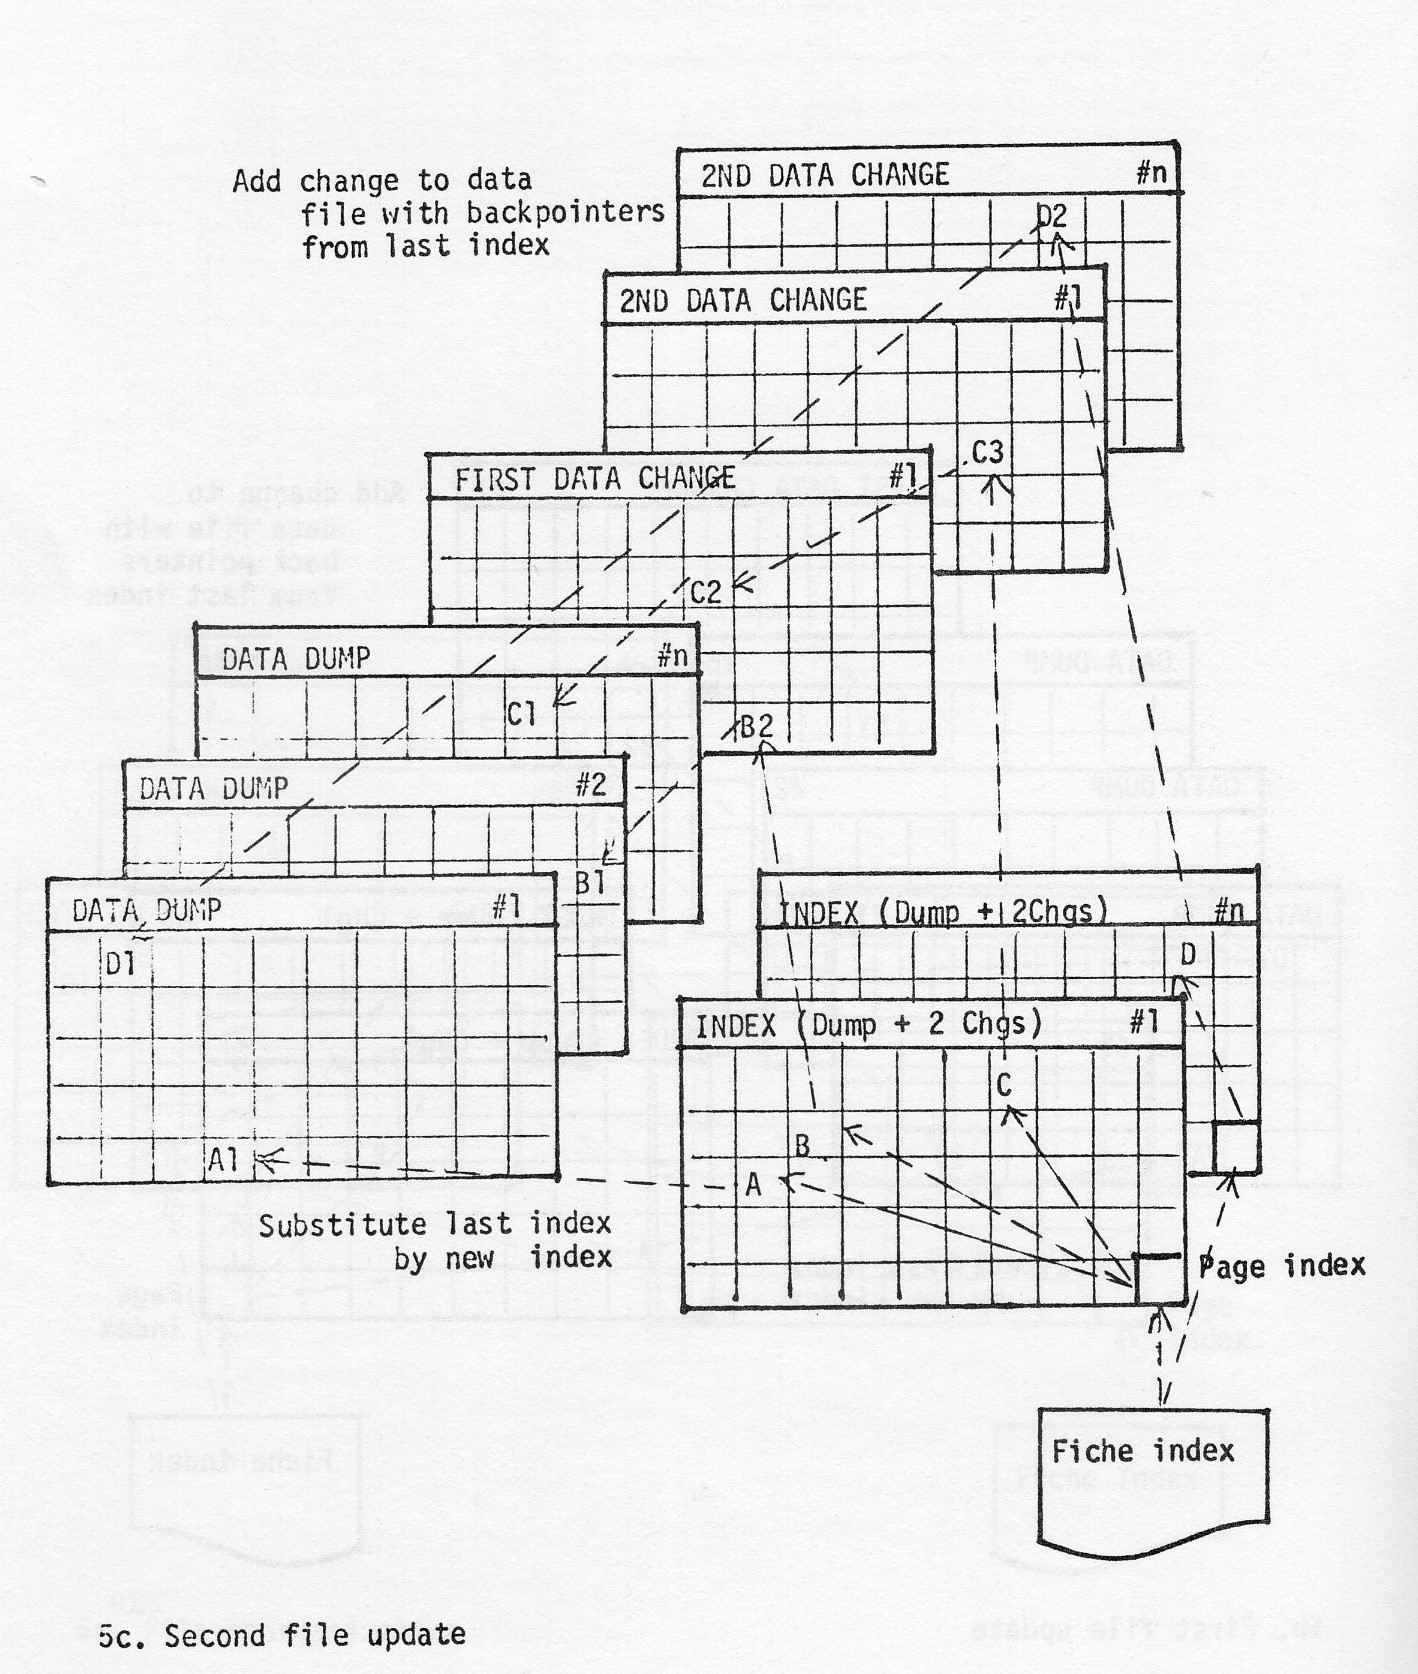
Indexing - especially multi-levels - is a necessary evil and generally distasteful to the ultimate user. Its design must be handled with care and may require experimentation.
Upon receiving a claim in excess of a specified value (which may vary by line of business) a reserve is established by line of business and entered into a computer system where a 500 character master record is created. All subsequent transactions (loss payments, expense payments, court schedules, recoveries, close notices, reopen notices, etc.) are maintained in this file. Since claims are frequently subject to reopening, closed items are retained. Currently, the file is approaching rapidly 1,500,000 entries dating back to October 1967 as far as closed, non-purged items are concerned. Since for a given claim several types of risks and many interested parties may be involved, one to several hundred entries per claim number may exist. Due to data processing considerations the file is in sequence by super category, then by claim number and some minor other categories. The computer system is run weekly and as of the end of a month. From the latter a fiche file is produced.
To produce a fiche file to allow rapid coding to existing losses and the correction of errors.
All entries to a given claim number (3 digit Branch Claim Office and 6 digit file numbers) must be kept together. Therefore, all reels of tape containing more than one super category are split in a distribute run and then merged together into the claim number and minor key sequence. This merged file is then entered into a fiche formatting run.
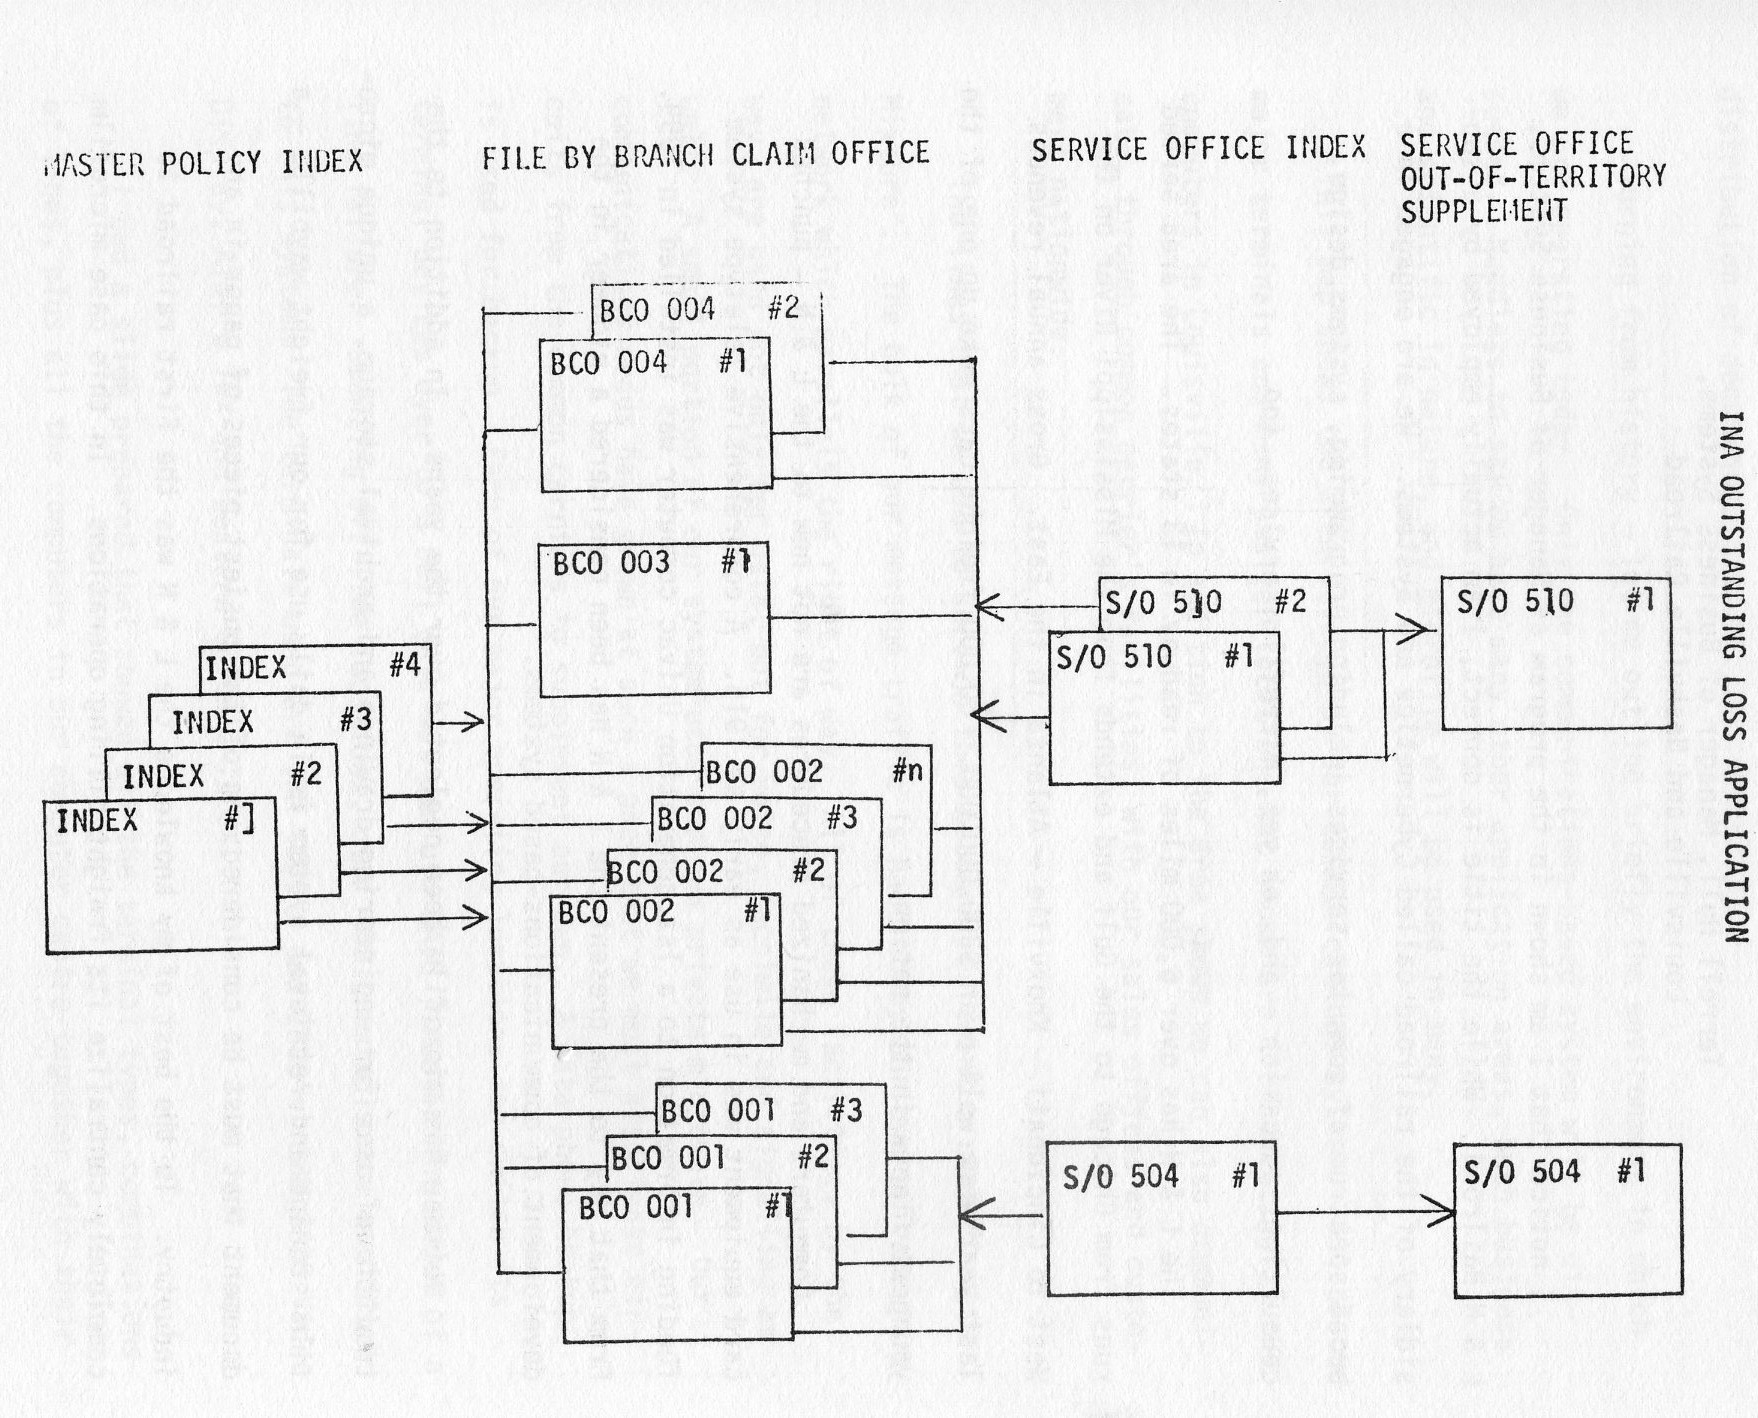
Each fiche is organized into a row of 20 eyeball characters across the top, 258 data pages of 10 entries each, the second last frame is a page index through the fiche, containing the last file number in a page and its fiche coordinates, and the last frame contains a cumulative master index showing the last file number in a given Branch Claim Office with the fiche number and coordinates.
The over 600 fiche (an indexed sequential file) are placed into metal trays next to the viewers segmented by Branch Claim Office through index tab cards.
The prime user of the fiche file requested an additional index - by policy number and symbol - to the file. Routines were added to the fiche formatting run to extract policy and claim identification, indication whether the claim is open or closed and the fiche location of the claim. This work tape is sorted into policy and claim number sequence. The formatting run places at the start of each pair of major terminal digits their value on a page in eye readable form. Each break in the second terminal digit pair will cause a break to a new page. Each major pair of terminal digits is concluded by an index of the second terminal digits pair showing the starting and ending fiche coordinates within the range of the major pair. The last frame on each fiche is a cumulative master index with beginning and ending fiche addresses for the major terminal digits. Since a given policy number may have had any number of claims the policy index - an indexed sequential file of 40 plus fiche - allows access to a file which for this purpose is in a non-transparent sequence.
Upon completion of the preceding two jobs we showed the file to some of our underwriters in the field offices. They said the file could be of great help if it would include the out-of-territory settlements. The latter refers to the settlement of a claim in a Branch Claim Office not located in the area assigned to the Service Office (underwriting function). Checking with the programmer responsible for the file he estimated that the out-of-territory settlements would be only about 5% of the entries. It turned out to be 33%. The first job was modified again. Each record is checked against an externally maintained table and every out-of-territory settlement is extracted, then sorted into Service Office, agency, policy and claim number sequence, re-entered into the slightly modified first job to be formatted for the COM and the extraction of indexing information. The index worktape is sorted into Service Office, agency, policy number and claim number sequence. Indices are formatted by Service Office with internal page and master indices. The index for a given policy will point to the page containing the desired item in the Service Office fiche set comprised of the sections of its native Branch Claim Offices and its out-of-territory settlements.
Introduction to IBM System/360, Direct Access Storage Devices, and Organization Methods. International Business Machines Corporation, Data Processing Division, White Plains, New York, 10601.
Ned Chapin, 'Common File Organizations Compared', Fall Joint Computer Conference 1969.
George G. Dodd, 'Elements of Data Management Systems', Computing Surveys, Vol. 1,No. 2, June 1969.
This paper was presented at the Eastern Regional UAIDE Business Meeting in Washington, D.C. on Friday, May 22, 1970.
I notice that I am shown in the program as Manager of Business Systems, L & N Railroad. While the title is correct, I am actually employed by a subsidiary of the railroad called Cybernetics and Systems. We are engaged in a broad spectrum of computer services including programming, systems design, consulting, education - and, oh yes, microfilm services, too.
The L & N has over 6,000 miles of roadway in 13 states. The area served runs from Chicago to the Gulf and extends from the Mississippi River on the West to Cincinnati - Knoxville - Atlanta in the East. Gross annual revenues last year were well over $300,000,000. 60,000 freight cars make up one of the youngest fleets in the nation.
Computers and mechanized procedures are not new to the L & N - punched card equipment was in use as early as 1915. A comprehensive teletype system feeding information to a 1st generation Univac computer was installed in 1959. From that day to the present the L & N has been considered a pioneer in the development of communications-based systems.
Neither has microfilm been neglected over the years. In addition to the traditional uses for engineering drawings and archival storage, a unique microfilm storage and retrieval system is in daily use for our freight waybills - a document that must be considered one of the busiest pieces of paper in any industry. To the best of my knowledge the L & N was the first railroad to completely centralize its freight billing operations. In this case microfilm was chosen as the ideal medium for high-speed high-volume reproduction and distribution of documents.
Turning from history - let me outline briefly the environment in which we are operating today. Only the communications-based system will be discussed. Needless to say we have many other application areas, both business and scientific in nature, and microfilm will be used in many.
This map shows the area covered by our communications system. All of our major terminals and many smaller locations not shown are tied directly to our computers in Louisville. In addition to the area shown we can also communicate, through common carrier's facilities, with our sales offices and customers nationwide.
The lines that we use to service this network represent a real Dukes Mixture. The bulk of our message traffic is handled by our own private wire network which parallels the right of way. All of these facilities, by the way, are used not only for data, but for voice, facsimile and signaling as well. A small portion of our system uses our own private microwave. Our communications needs have grown at such a pace that we must also lease circuits from the common carriers to supplement our own. A data-phone hookup is used for backup. Each of our major operating locations can switch its terminal devices over to a Bell data set and use WATS lines in the event of a line failure. Counting off-line locations, over 400 terminals are connected to this system. The terminals used are IBM 1050's and 2780's, IBM 2260 Video Display, AT&T's TWX and Western Union's TELEX.
I had a slide prepared that showed all the terminal types, combinations of lines, plus all the computers in our computer centre together with their peripheral I/O devices and the alternate connection paths used as backup. I soon found out I couldn't explain something I didn't understand, so I'll use this over-simplified schematic instead. From left to right it shows the data sets thence through a 1925 switching device which has the ability to switch the lines to either or both of 2 transmission control units. The 2911 switch shown controls the assignment of disc storage and communication I/O to either of two computers, in this case an IBM 360/40 or 50. As you can see we're vary much concerned with backup. The operation of the railroad has become so dependent on this system that we simply cannot tolerate and significant down-time. Fortunately we have not had to.
The function of this system are first and foremost - message switching - all administrative wires are channeled through the computer to our own locations or routed to selected relay stations for forwarding to other carriers. Messages can be sent to multiple addressees at one or more locations or broadcast to all or selected groups of offices. Since most of the data messages represent the movement of trains these too are forwarded by the computer to the next station in the train's itinerary in order to provide advance information for planning purposes.
The second function is data collection. Selected data passing through the system is picked off and used to update on-line files. While there are many on-line files used for various purposes, I will mention only the car file since it is the only one pertinent to today's discussion. The car file contains a wealth of information on every car that is now or has been on the L & N within the last five days. There is some static information about the car itself, its identification number, ownership, type or physical characteristics, weight, assignment and its per diem or rental rate. The dynamic sector shows current location and status, where and when it first came on-line (to aid in returning its home), the last two physical movements and the last two status changes. On loaded cars all the pertinent information about the shipment is stored. Empty cars also retain some information from the previous shipment in order to determine suitability for subsequent loading, i.e., we try to avoid loading foodstuffs in cars that last hauled green hides.
The third function is inquiry - these files are open around the clock to our own personnel as well as selected customers for immediate response inquiries. Many levels and types of inquiry are available with built in security checks to insure that the inquirer receives only the type of information to which he is entitled.
That, in a nutshell, is what we call our Teleprocessing system and its functions. Since this is right in the mainstream of the company's activity it goes without saying that the use of the information doesn't stop here. Data gathered by the system is periodically drained off to provide input to many off-line applications.
By now you should be asking yourselves the question, Did this idiot come to talk about microfilm or sell IBM communications systems? With a system like I've just described who needs microfilm?
I've heard a lot of discussion lately about the economics and relative merits of microfilm systems versus real-time or on-line systems. It all seems to be black or white with no gray areas between. Each approach has its own unique advantages and disadvantages but little has been said about how well they complement each other.
The system I've just described, if not carried a few steps further, would have at least two obvious shortcomings:
At the L & N we met these requirements the only way open to us at the time - by printing and distributing lots of paper.
When we installed our Micromation system these two problem areas drew our immediate attention and were the first two applications implemented.
Let me tell you, before I describe the applications, just what equipment we have installed. We have a DatagraphiX 4360 with a Universal Camera. Since our teleprocessing system was to be relieved of a lot of background printing I borrowed an IBM 2401 Mod I tape drive for input. Outside the computer room we have a 156 processor and a 92 roll film copier. Although most of our output is microfiche we have not yet installed any type of microfiche copier. Our volume doesn't justify a 96 copier, and we are not completely satisfied with the card-to-card copiers currently available. In the meantime we are using a Kalvar K-10 which belongs to a local hospital.
The first application we call our Train consist, however, it is actually a log of all messages received by the system. Each message (other than administrative wires) is printed (on film now) out in detail in the same sequence as received from the field. Since the messages come in at random the computer assigns a sequential reference number to each message header and this information is used later to produce an abbreviated index to the file. This index allows the user to look up a message by train number and date or by interchange and date (an interchange is an exchange of a group of cars between railroads at a junction). It was and still is produced on paper because it also provides a convenient medium for annotations.
This message log formerly required about 2,000 pages of 1 part paper per day. It was printed by the on-line system periodically during the day at the operator's convenience. A slow speed 600 1pm backup printer was used and required about 4 hours per day. Now, the inbound messages queues are dumped on tape three times a day and these tapes are batched and run on the 4360 every other day. The data is recorded on microfiche at 42X. We are able to get 293 pages of data (14 × 21) plus one index page. This last page provides an index to all the other pages on the fiche. Additionally, we are printing an index title at the end of the fiche. This eye-readable index shows the date and the low and high reference numbers on the fiche. This application has been very successful - the film is being used extensively - the using department is pleased with savings in storage and binding time. While this application has produced some economies they are typical and I would rather spend more time on the next application, the Weekly Tracing Record.
This report is basically a weeks accumulation of car movements gathered by our message switching system. Sorted in car initial, number, date and time order it is the most widely distributed active reports in our company and, I am sure, in the railroad industry.
The frequency of the report may differ on other railroads and the terminology varies, but this type of data is necessary to all - for car accounting and for operating and sales people as well.
Let me tell you how we used to do it. Once a week we printed this on multilith masters - 3 up and 8 lines to the inch. It was the most crowded, unreadable report ever. It usually ran about 2,000 pages and took 2½ hours. That's not bad up till now, but here's where the fun starts. These masters were sent to the duplicating department where 44 copies were made. 44 copies of 2,000 masters, try it some time, then of course they had to be collated, boxed and mailed. Due to problems with the masters or our printer ribbon there were constant re-runs. Our duplicating department is not staffed to handle such a job on a crash basis, so it usually took at least a week to get the report in the mail. Many overtime hours were incurred. What did all this cost? Conservatively -
                                        $
Computer print time @ $12.00/hr       30.00
Multilith                             65.70
Bond paper                           135.60
Labor (including boxing)             145.73
Boxes                                 15.84
Est. postage                          50.00
Per week Total                       450.87
Per month Total                     1938.74
When we converted to microfiche we decided to practically double the number of pages to make the data more readable. Each frame has two columns of car movements instead of 3 as before. A 42X lens is used and the format is the same as the message log referred to earlier. 14 pages per column, 22 per row plus index and titling. As in the other application we are recording 293 pages of data plus an index page which shows the last car number and frame number of each of the 293 data pages. Titling is done at the end of the fiche and shows fiche number, low and high car number on the fiche and date. I've brought a number of samples with me if anyone cares to see them.
The job now runs slightly under 4,000 pages - it takes about 30 minutes to run on the 4360 and produces from 13 - 15 fiche each week. We are making 25 copies at a local hospital, usually the same day it's run and mailing the next morning. That's about a 6-day improvement in turnaround time. Retrieval time is good - we provided special grids to all locations - all our people have to do is select the proper fiche and go to the index page - 10 - 20 seconds - (some have devised their own method). Acceptance by the user has been good at those locations where all that's required is occasional reference to 1 car move. For those people who have to use the data for extended periods of time there have been complaints - all of them justified.
In order to economize on readers we chose a 3/4 blow back which might be adequate for low activity files, but is far from satisfactory at some of our locations. Replacement readers have been ordered to alleviate the situation.
For the past 12 months, the graphics group at Logic Data Systems has devoted a considerable amount of time to improving and expanding existing techniques in the production of computer animation at LDS. These efforts have been primarily in three areas:
Two inch video tape is used a great deal as a production medium in the Dallas area, and for this reason we undertook to find out something about the process in order to see what possibilities video tape techniques might have for computer animation.
Through the cooperation of WFAA-TV in Dallas, we found that electronic video processing of a television image, involving video tape recorders and the new video disc recorders, can perform many of the functions of an optical printer such as matting, adding color to black and white images, and production of multiple pass effects, as well as some special effects that can't be readily produced with an optical printer.
Of course, the end product is on video tape. If the production is to be used for television, this is fine. However, if the material is to be delivered on 16mm film, the tape-to-film transfer is a relatively expensive process at the present time. In addition, the tape-to-film methods that we have examined involve the photographing of a television monitor with the inherent limitations of the 525 line television raster to resolution, regardless of the quality of the computer generated original.
There are methods for eliminating the horizontal scanning lines in the television raster, or making them less apparent in some cases, during the tape-to-film process although of course, this does not improve the resolution. We felt that for some applications, some of the better tape-to-film methods would probably be acceptable for 16mm film, provided the cost was not unreasonable.
Production of computer animation for video tape involves generation of black and white 16mm film, using a DatagraphiX 4060 or an FR-80, with color separations if required, just as we would do when using an optical printer. The black and white material is then transferred to two inch video tape, using the film chain at the television studio.
At this point, we have a black and white A roll or video key source on video tape that can be used in several ways. The animated figures on the key can be supered over another image - either live action or animation - from a video tape, film, or television camera source. The images can be colorized as they are supered, with the colors being generated electronically in some studios, or in some cases generated by training a color television camera on a color card to provide a source.
Through the video keying or matting process, the moving black and white image on the A roll acts as a window through which we see the color field, thereby producing a new tape with the moving image in color.
In combining images from the video tape A roll and another source, the black and white A roll acts as a control or key which causes the video signal from the color source to be output from the controller for recording when the equipment is scanning the clear portions of each frame on the A roll. When scanning the black portions of each frame on the A roll, the signal from the alternate source is output from the controller for recording. This electronic matting process is generally referred to as a video overlay, since the image from the A roll appears to be in front of, or on top of, the image from the alternate source.
A similar method involves keying from a portion of a video signal of a particular color and inserting an alternate signal. We have used this method to combine live action and computer animation by shooting the actors in front of a blue background while keying from the blue background to insert the animation. The actors could see the composite image on the studio monitor during the taping. This process is called a video inlay, and in the resulting image, the animation appears to be behind the actors, in place of the blue background.
A number of special effects are possible with video tape equipment. One we have used a great deal involves video feedback, obtained by training a television camera on a studio monitor displaying the computer animation, and taping the result. This produces multiple images or repeats in the composite signal, and by varying the orientation of the camera and the monitor, a great variety of fascinating effects are possible.
These electronic matting processes I have described are used a great deal in larger television studios for supering still art (titles, logos, etc.) over live action material for locally produced television spots, as well as for inlaying 35mm slides - behind a TV news commentator, for instance. However, the use of computer animated film makes possible an economical animated source as a key, and this addition of motion is leading to a fascinating new tool for television production.
A new piece of equipment with which we have done some limited experimentation is a video disc recorder. The disc recorder can store up to 30 seconds of color video, and can be programmed to replay any part of this stored information in fast or slow motion, or to cycle selected frames.
In the demo films I have with me, you will see several black and white segments that were used for television productions. I have available a two inch video tape illustrating the end product after video processing. Copies of the two inch tape are also available on one inch video tape for an IVC recorder format.
The technique of shading or blocking figures has been a useful one. We have used this addition to our IMAGE animation program in almost every job we have delivered since its implementation early this year. The method involves plotting of multiple parallel lines within the boundary of the figure to be shaded. Refinements in ordering of the boundary segments for intersection tests, and methods for limiting the search radius for intersection tests in the shading subroutine have made the process an economical one in terms of computer time.
We have encountered some problems in producing film containing shaded data arrays on the DatagraphiX 4060 and FR-80 plotters from time to time. In two cases when using DatagraphiX 4060's, we have encountered a variation in intensity from vector to vector in a particular figure. This seemed to be related to the lengths of the shading vectors being plotted, and may have been a problem in adjusting the machines.
For the DatagraphiX 4060, we have found that a spacing of five raster coordinates between adjacent shading lines produces a uniformly shaded field without burning or haloing of the image. A limited spacing between shading lines is preferable to an overlap, since haloing is very noticeable, whereas small spaces between shading lines will not be discernable on a 16mm reduction. Uniform spacing and intensity are very important, particularly when producing color separations for an end result on color film.
The six black and white WFAA Production logos you will see in the demo film were produced on an FR-80, and point up a problem we have had occasionally in using this equipment - that is, sometimes the spot diameter or intensity varies over a short period of time. The six variations of the WFAA logo you will see are shown in the order they were plotted on an FR-80, in one run of about 20 minutes duration. The spacing between shading lines is set at 26 raster coordinates in each of the 6 segments and yet the variations in intensity of some of the segments is very noticeable. Since the end product here was to be on video tape, it was possible to adjust the sensitivity to eliminate the halo around the image after the film-to-tape transfer. This problem may be limited to the particular FR-80 we have been using.
I have some CalComp plots obtained during checkout of our CHAP I program (Character Animation Program, version I). This program was developed as a test for an idea relating to character animation - that is, programming character action by selecting key positions from the master list of positions possible, with related timing and scaling information. We believe this approach has merit for several reasons:
The creation of an animated film begins with a storyboard consisting of a series of frames. Between each pair of storyboard frames, the artist must draw many intermediate frames to produce smooth animation. This paper describes an interactive computer graphics program which automatically produces the intermediate frames for review or filming. The program runs on an IBM 1130/2250 with a Sylvania tablet attached to the 1130. The user can draw the storyboard frames on the tablet and ask for animation on the 2250. The intermediate frames are calculated using linear interpolation.
Karma: The forces or motions generated by actions, and their continuous effects on the physical and psychological planes. - Bhagavad-Gita
The creation of an animated film begins with a graphic outline called a storyboard, which consists of a series of frames and looks much like a comic strip. The purpose of the storyboard is to exhibit the story line and continuity of the proposed film. From the storyboard, the artist prepares a series of key frames (extremes), and then draws many frames (inbetweens) intermediate to each pair of extremes to produce the desired animation. The storyboard frames are not used in the animation, but serve only as an outline. Thus conventional methods involve a laborious frame-by-frame construction process. Most computer animation work has either automated the input or display of artist-drawn frames, or developed programming languages and non-interactive systems for artists - turned - programmers.
This paper describes an attempt at the computer generation of film sequences directly from the key frames drawn by the artist. The computer produces the intermediate frames, leaving the creative aspects of animation to the artist. The system, called KARMA, provides an interactive response to the commands of the artist, and permits immediate review of the animation.
The artist draws the key frames of a storyboard on a computer-controlled tablet, and the program automatically produces and consecutively displays the intermediate frames. Facilities are provided for input, storage, modification, and display of the key frames. In addition an animation review facility permits the artist to see the effects of the computer produced animation and also permits direct filming by a camera coupled to the display unit. The user can specify the number of intermediate frames produced between any pair of key frames. The intermediate frames are calculated using a simple linear interpolation which is described in the appendix.
KARMA is implemented on an IBM 1130/2250 system, a small (32K 16 bit words) general purpose computer with an attached display unit. KARMA accepts graphic information from an on-line Sylvania Data Tablet, and immediately reproduces on the display screen whatever is drawn on the tablet. Since the stylus contains a ball point pen, the user can direct his attention either at the paper on which he is drawing (or tracing a pre-drawn figure), or at the screen. The stylus position is indicated on the display by means of a cursor. Bolted to the tablet is a peg bar for registration of standard punched animation paper. The drawing area provided by the tablet is eleven inches square.
The objective of this work is to investigate the methodology and functions needed for a practical and powerful computer-assisted animation facility. A special emphasis has been placed on naturalness and ease of use by an artist, so that a long training period is unnecessary.
Two notable papers have influenced this project. The first by Miura et. al. (1) reported the first use of linear interpolation techniques for computer animation. The system was implemented on hybrid equipment and emphasized the interpolation process itself, rather than its use in a practical system. The pioneering paper by Baecker (2) described a powerful interactive animation system operating on a time-shared computer. In that paper the methodology of computer graphics was the primary topic. The notion of the interactive graphical specification of picture dynamics, developed there, has been used in this work.
Each key frame consists of a number of curves. As the curves are drawn they are stored in the computer and displayed as a sequence of line segments sufficiently short so that the curve appears smooth. This is illustrated in Figure 1. The interpolation process produces the curves intermediate to a curve in frame 1 and a corresponding curve in frame 2. Correspondences are necessary since legs should be interpolated into legs, hands into hands, etc. The KARMA system establishes a correspondence of the first curve drawn in frame 1 to the first curve in frame 2, the second curve to the second, etc. If two key frames have a different number of curves, only those curves which have a correspondent are displayed; the extra curves do not appear in the interpolation process.
A similar correspondence exists between line segments of corresponding curves. Normally two curves will not consist of the same number of line segments, and in this case the curve with fewer line segments is redrawn so that the number of segments agree (see appendix). Then the first line segment of a curve recorded in frame 1 is associated with the first line segment of its corresponding curve in frame 2. The direction in which a curve is drawn is therefore significant.
Figure 2 shows the result of interpolating the input of Figure 1. Another example is shown in Figure 3, where the input was the top and bottom lines and the computer produced the others. The coarseness of transition between adjacent images in both figures is due to the small number of inbetweens requested.
When the user asks to see the computer-generated intermediate frames, each line segment of frame 1 is linearly interpolated into its associated segment in frame 2. The same processes are repeated for multi-frame animation using a sequence of key frames stored on disk. Just as frame 1 is smoothly transformed into frame 2, frame 2 can be transformed into frame 3, etc. This simple interpolation technique has been found extremely satisfactory both in terms of animation technique as well as computation time.
There are two modes of entry and display of the key frames: the first is illustrated in Figure 1, and the animation is performed from the frame specified on the left of the centerline to the one on the right. Each frame is defined relative to its center cross and the animation is performed in the center of the screen.
To maintain the desired correspondences between curves, the artist must draw the curves in the same order and in the same direction in each frame. To lessen the burden imposed by this requirement, the user is prompted automatically. For example, after completing the first frame, the user will move his pen across the centerline to begin the second frame. After the pen has crossed the boundary, the first curve of frame 1 will be repeatedly traced out in the direction it was originally drawn. When the user draws the first curve of frame 2, the second curve of frame 1 will be traced out, and so on.
The artist may draw curves in either frame in any sequence simply by moving his pen from one frame to the other and drawing. The program will always remind the user of the correspondences. There is also a convenient editing facility which permits the modification or erasure of any selected curve.
This mode was our initial experiment with the transformation techniques described. It shortly became obvious that this mode had two disadvantages: only half of the screen can be used for each frame, and registration of two frames is difficult.
The second mode is a tool for the working animator, and was used to prepare the animation for the film accompanying this paper. Two consecutive key frames labelled F (From) and T (To) are retained in core memory. The frames are shown superimposed, with the selected frame brightened. The user can select one by depressing the appropriate button on a function keyboard adjacent to the tablet, and add to the selected frame by drawing on the tablet. As an additional option, he can ask to see only one frame at a time. Review of the intermediate frames may be made at any time.
A sequence of key frames can be entered and reviewed from beginning to end. To allow this, frames are named with frame numbers and filed on a disk. After a pair of frames is filed, the system is ready to accept the next key frame in sequence. For example, if the pair of frames is filed as frame 1 and frame 2, then frame 2 is retained in core and relabelled F. If a frame 3 has previously been stored it is automatically retrieved, placed in core, and labelled T. If no frame 3 exists, the T frame is empty, and can now be defined.
Linear interpolation is a technique for deforming one curve into another through a number of intermediate stages. However, in many scenes a figure is not deformed, but merely stays stationary or is translated as a rigid object. KARMA has a facility for copying an object of one or more curves from the F frame to the T frame and choosing a position for the object. The intermediate frames will make the object appear to move between the two positions.
To implement this copy and translate function, a method for defining graphic objects, or entities, is provided. Each entity consists of one or more curves which are to be copied from the F frame to the T frame. When a particular entity has been copied the T frame is displayed, and the copy appears in the T frame in its original position. The copy can be translated to any desired position with the stylus. Each entity can be translated independently.
KARMA has three different methods for generating the intermediate positions of a translated object. The object can be moved along a straight line connecting the initial and final position. Alternatively, the user can move the copy over an arbitrary path specified by motion of the stylus; intermediate positions are then calculated along the path (Figures 4 and 5). A third method permits the user to touch the stylus to the tablet to define the precise location of each intermediate frame.
The animator will usually need to combine the two techniques of interpolation and translation. For example, a human figure may be translated while the hands and legs are interpolated. To do this, the entire figure is defined as an entity and copied into the T frame. Translation may be effected by any of the three methods just described. The curves that are to be transformed using the interpolation process are then erased from the copy and redrawn. During review, the translation and interpolation are combined as required.
In a typical sequence objects appear or disappear spontaneously from view, often without any gradual prior changes. However, interpolation between two consecutive key frames does not permit the appearance of a new curve, or the disappearance of one previously present. It can only transform the curves of the first frame into the corresponding curves of the second.
This capability is obtained by using a multiple frame sequence, where the frames are stored on the 1130 disk. For example, suppose frame 1, frame 2, and frame 3 have 6, 9, and 9 curves respectively. Interpolation between frames 1 and 2 will be followed by interpolation between frames 2 and 3. In the first interpolation the curves of frame 1 are transformed into the first six curves of frame 2. The final three curves in frame 2 are not displayed. The second interpolation will transform all nine curves of frame 2 into the corresponding curves of frame 3. The resulting sequence will show the appearance of three new curves.
Similarly, curves can be dropped from view. If frame 4 has seven curves corresponding to the first seven curves of frame 3, then during the interpolation between these frames the last two curves of frame 3 will not be displayed. The effect over the sequence is the disappearance of two curves.
KARMA also permits changes of scene, where the entire sequence shows a jump from one scene to another. For this purpose two store functions are provided; an initial store to identify the first frame of a new sequence, and a normal store for subsequent frames. For example, suppose frames 1 and 3 have been stored as initial frames and numbers 2 and 4 as sequels. A review of frames 1 to 4 will show an interpolation from frame 1 to 2, followed by an interpolation from frame 3 to 4. The effect is a cut from frame 2 to frame 3 rather than a smooth transition.
The earlier sections of this paper have outlined the capabilities of KARMA; this section indicates how control is exercised. The various functions are initiated by depressing a button on the function keyboard. In the outline that follows, the function associated with each button is itemized.
The current repertoire of KARMA seems to be a useful and practical set of tools for the creation of animation sequences. Since it was designed to exploit the techniques of linear interpolation, KARMA does not have the sophistication and versatility of conventional animation methods. However, it has been successful in achieving its primary aim: the elimination of a large amount of routine hand work. In addition, it is especially well adapted to the economical linear style exemplified by the artists Steinberg, Blechman, and Popko. Linear interpolation has been surprisingly effective as an intermediate frame generation technique. No more complex interpolation algorithm seems necessary at present, although incorporation of a non-linear technique would be straightforward.
Additional functions could be added to the system in order to enhance its power. Presently review proceeds between two key frames in a standard way: from the first key frame to the last, with repetition until the user stops it. For filming, this review is performed once. We are investigating a more complex review which would permit certain frames to be displayed cyclically, interpolating from first to last, then last to first, etc. With cyclic review superimposed on linear review a human figure could be translated while the arms and legs are cyclically interpolated to produce a walking cycle with a minimum of art work.
Rotation and scaling can presently be done reasonably well by interpolation. However, scaling and rotation functions similar to the copy and translate facility would be useful.
The ability to film in color directly from the CRT using color filters would also enhance the power of the program. Color could be added to KARMA with new functions enabling multiple exposures of different color overlays for each intermediate frame. The system would position the various filters in front of the lens and advance the film once a frame is complete.
The interest and intuitive understanding of computer graphics by the animator Stan Popko are gratefully acknowledged, as are the interest and support of E. J. Casazza of IBM World Trade Corporation. Mr. Popko prepared the artwork for the animation in the film accompanying this paper, and the photography is by D. H. Morehouse of IBM Kingston. Conversations with R. D. Tennison, A. Stein and others at T. J. Watson Research Center were very helpful in this effort. A conversation with N. Burtnyk of the National Research Council of Canada at an early stage of the project helped to stimulate our efforts. He seems to have followed a similar line of development, and his paper Computer Generated Key Frame Animation has been submitted to the SMPTE journal.
1. T. Miura, J. Iwata, and J. Tsuda, An application of hybrid curve generation - cartoon animation by electronic computers Proceedings 1967 SJCC, pp. 141-148.
2. R. M. Baecker, Picture driven animation, Proceedings 1969 SJCC, pp. 273-288.
To illustrate the algorithms used in this paper, consider the simple diagram below. The line segment on the left is an element of a curve in the F frame, and the segment on the right the corresponding element in the T frame. The interpolation algorithm in effect connects the endpoints with straight lines, marks those lines at equidistant points, and connects the appropriate points to generate the intermediate lines. The interpolation is performed for all corresponding segments of all pairs of curves.
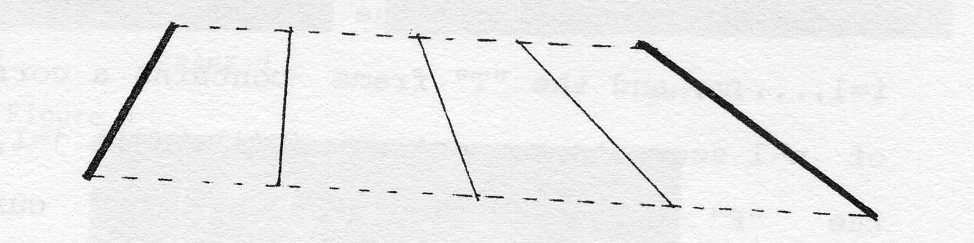
If two curves have different numbers of segments the segment correspondence cannot be made. The curve with fewer segments is then redrawn preserving its original shape, with a segment count equal to the curve with more segments. For example, suppose the curve in the F frame consists of two segments and the corresponding curve in the T frame has five. The F curve is modified to contain five segments as follows: The first point is retained, the second and third are chosen at 2/5 and 4/5 along the first segment, the fourth and fifth points at 1/5 and 3/5 along the second segment, and the final point is retained as the sixth point. The line segments connecting the new points (marked by X in the figure below) form the modified curve. If the line segments are small and equally spaced, the shape of the curve is preserved.
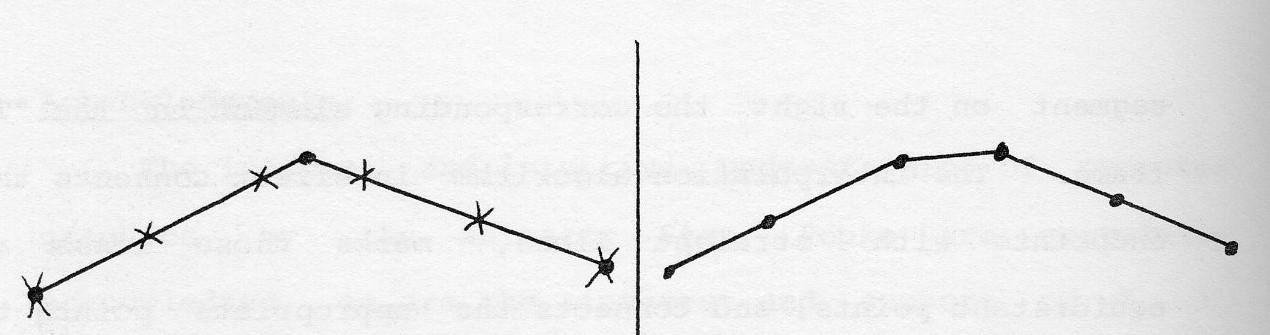
The two algorithms can be formalized as follows: assume that the F frame contains a curve made up of m-1 line segments connecting the series of points (X(i),Y(i)) i=l,...,m, and the T frame contains a corresponding curve of n-1 segments connecting (U(j),V(j)) j=l,...,n. If m<n the F curve is replaced by the curve connecting (X'(i),Y'(i)) i=l,...n where
X'(1) =  X(1)
X'(2) = (X(2)-X(1)) *  (m/n)      + X(1)
X'(3) = (X(2)-X(1)) * (2*m/n)     + X(1)  if 2*m/n < 1
      = (X(3)-X(2)) * ((2*m/n)-1) + X(2)  if 2*m/n ≥ 1
......
and similarly for the Y' values.
Once the segment counts are equalized, the interpolation can generate the intermediate frames. For each frame f a new curve is generated with the points (A(f,i),B(f,i)) where i is the point index, and f the frame index. If M intermediate frames are to be generated, then f=1,...M and i=1,...n. The new curves are defined by
A(f,i) = (U(i)-X'(i)) * (f/M) + X'(i)
B(f,i) = (V(i)-Y'(i)) * (f/M) + Y'(i)
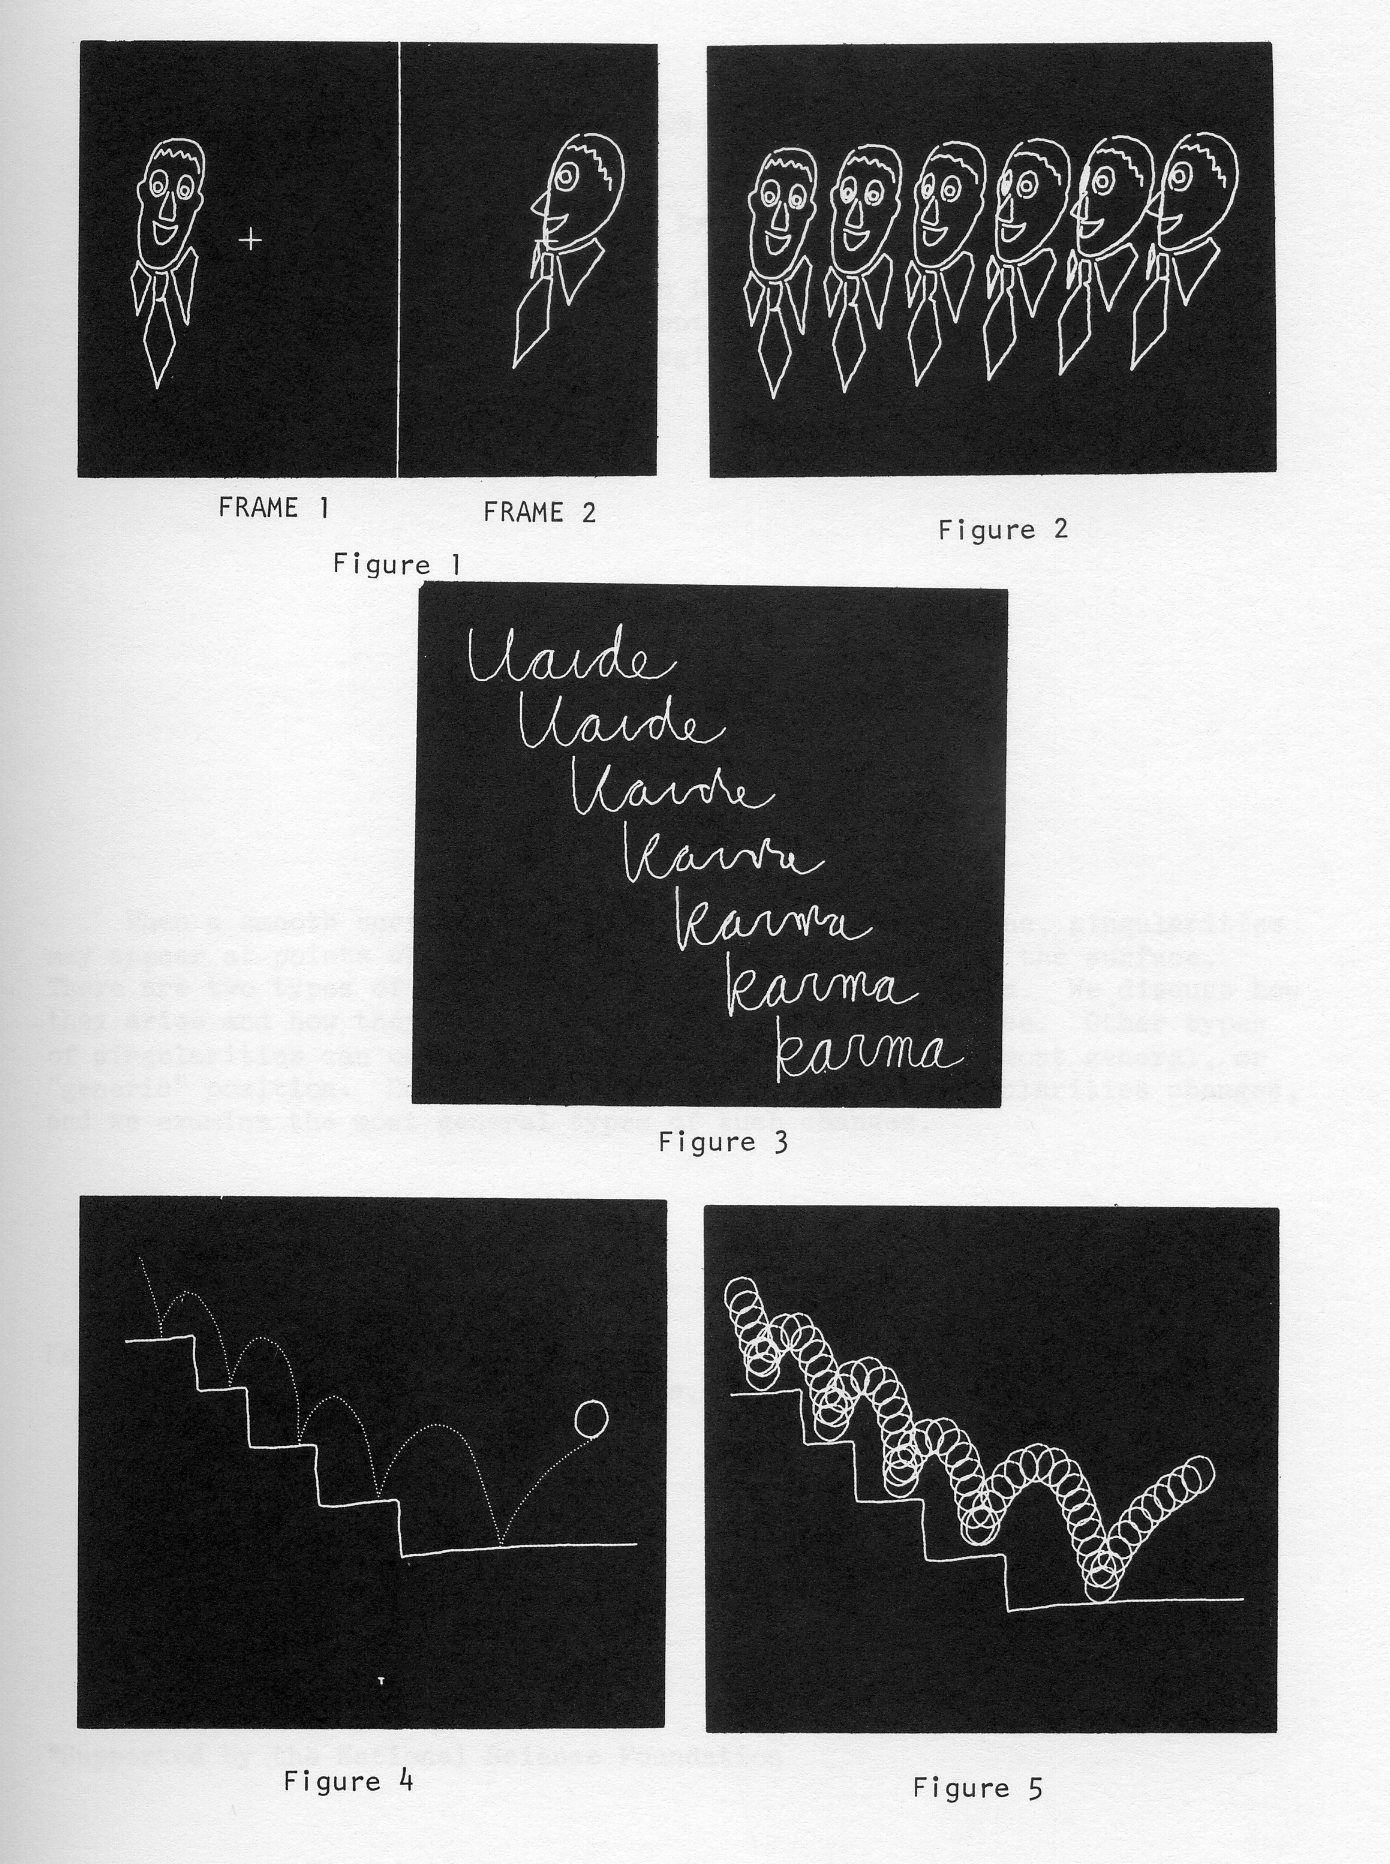
When a smooth surface is projected onto a picture plane, singularities may appear at points where the line of sight is tangent to the surface. There are two types of such singularities: folds and cusps. We discuss how they arise and how they affect the visibility of the surface. Other types of singularities can occur when the surface is not in the most general, or generic position. During a deformation, the set of singularities changes, and we examine the most general types of such changes.
In a paper [1] at last year's UAIDE conference, a method was given for representing a smooth surface (with possible self-intersections) by the projections of dots randomly scattered across it. Extra three dimensional cues can be added by rotational motion, by perspective projection, and by brightening the dots in the foreground. However, for a sufficiently complicated surface the jumble of dots at different levels may become confusing, and it may be necessary to eliminate the hidden dots which lie on hidden surfaces. The discussion below concerns this hidden dot problem, and is valid for either parallel or perspective projection.
The most naive solution would be to draw a line from each dot back toward the eye. If this line intersected the surface in any other points, the dot would be hidden. However, finding the intersection, of a line with even a simple surface is a difficult computation, and when repeated for the hundreds of dots required for a surface, this process takes impractical amounts of computer time.
A more practical technique is to find whole regions of the surface which are visible or hidden. These regions are bounded by the visual edges consisting of points where the line of sight becomes tangent to the surface. In the language of differential topology, these are points where the projection of the surface is singular and the rest of the paper concerns a mathematical analysis of such singularities.
Suppose u and v are coordinates on a patch of surface about the point (u,v) = (0,0). Since this surface sits in three dimensional space, it is represented by three functions X(u,v), Y(u,v) and Z(u,v) of the parameters u and v. If the surface is smooth and non-singular in space, then the two tangent vectors
are linearly independent. Assume the Z- axis points away from the eye, and consider a projection of the three dimensional space (X,Y,Z) onto the (x,y) picture plane, given by two functions x(X,Y,Z) and y(X,Y,Z). For parallel projection we use x = X, y = Y, and for a point perspective projection, x=X/Y, y=Y/Z.
The composite function f, from (u,v) to (x,y), will now become singular, wherever the two tangent vectors project to the same direction in the (u,v) plane. At a singular point, the Jacobian determinant vanishes.
(1)
For example, consider the surface in Figure 1 generated by a parabola in the YZ plane. Its equation is X = u, Y = v2, Z = v.
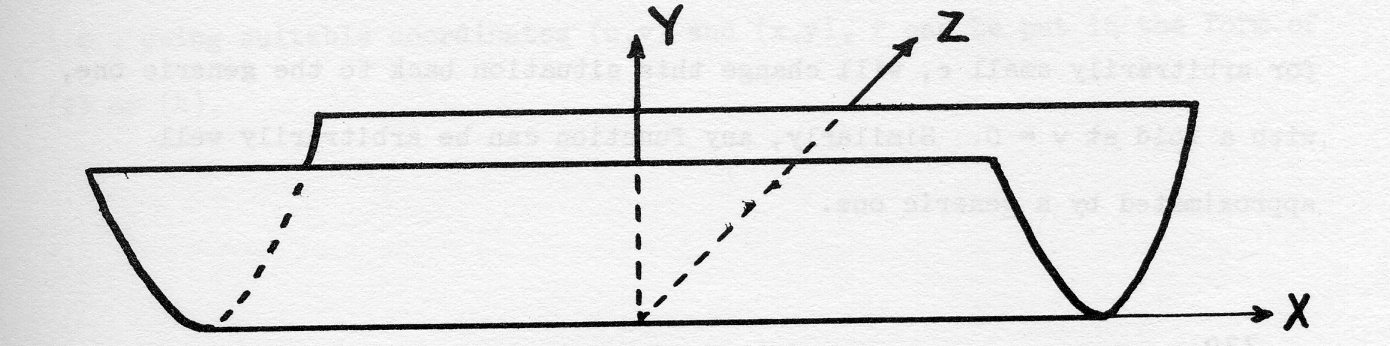
Under parallel projection, we get:
x = u, y = v2, so equation (l) becomes
(2)
Thus, the line v=0 is the set of singular points of the projection, which in this case are all fold points. Since equation (l) imposes one algebraic condition, the set of singular points of f will in general be a smooth curve in the (u,v) plane. The idea of in general can be made more precise, with Thorn's idea of generic, defined in [2]. Roughly, a generic surface has as small a set of singularities as any nearby surface, and thus has no singularities which could be eliminated by a small deformation.
This idea can be seen by looking at the surface of the previous example rotated 90 degrees to an end on position. Its equation then becomes the X = v, Y = v2, Z = u. Under parallel projection we get x - v, y = v2, and equation (1) becomes
which is always satisfied.
The whole surface is squashed down to a curve, and every point is singular. This is not generic. However, a small deformation or sideways push to
(3) X = v + ε u, Y = v2, z = u
for arbitrarily small ε, will change this situation back to the generic one, with a fold at v = 0. Similarly, any function can be arbitrarily well approximated by a generic one.
In the generic situation, the solution to (l) will be a curve in the (u,v) plane, which we may parametrize as φ(t) = ( u(t), v(t)). This becomes a non-singular space curve (X(t), Y(t), Z(t)), but under the projection to the picture plane, it may acquire singularities, where
lies on the line of sight and projects to zero, i.e.
We may then assume, in general, that
Such a point is called an exceptional singular point, or cusp. For example the surface in figure 2 has equations
     X = u, Y = V3 - uv, Z = v
(4)  x = u, y = v3 - uv
Equation (1) becomes
with solution u = 3v2, the curve of singular points in the (u,v) plane. Choosing v as the parameter, the function f sends this curve to the curve x = 3v2, v = 2v3 in the (x,y) plane, which has a cusp singularity at v = 0. The point u = 0, v = 0 is called a cusp or an exceptional point of this function f. Hassler Whitney has proved [3] that for a generic function f from the plane to the plane, every singularity is either a fold or a cusp, i.e., using suitable coordinates (u,v) and (x,y), f can be put in the form of (2) or (4).
Now suppose we can compute all the visual edges, or curves of singularities on the surface. They divide the surface up into a number of regions, and their projections also divide the (x,y) plane into a number of regions. If there are no cusps, the problem is now simple, since visibility of a dot depends only on which region of the surface contains it and which region of the picture plane contains its projection.
The situation near a cusp is a bit more complicated.
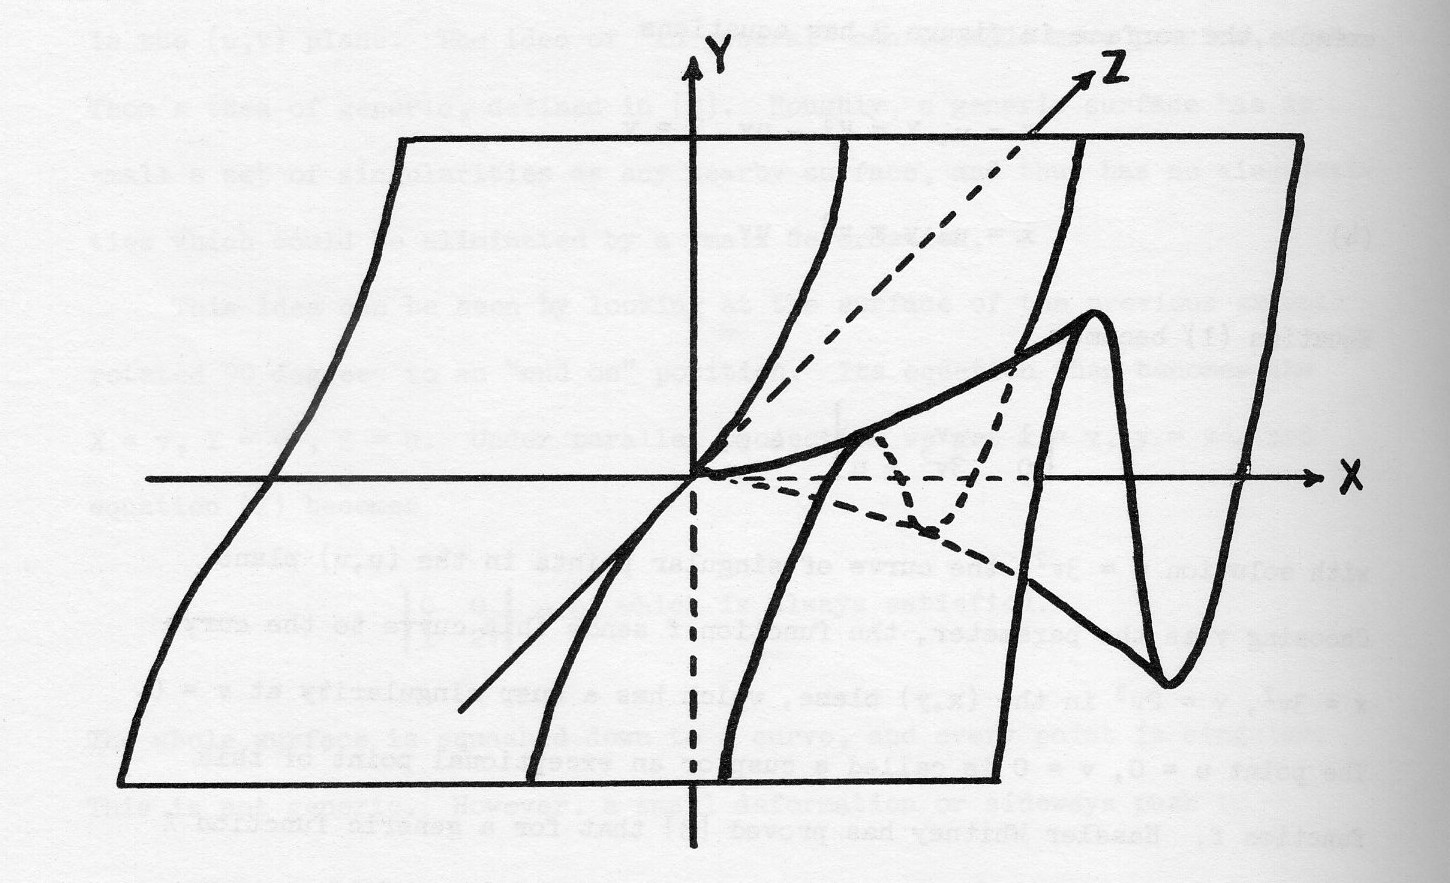
The wavy curves in figure 2 cross-sections of constant u = X, and the other curve, whose projection has a cusp, is the visual edge. The region u > 3v2 is the downward fold on the right of the cusp and is invisible. However, there are points of the region u < 3v2 in back of this surface which are also hidden. These are the points for which X > 0, and Y < 2(X/3)1.5. Here y = 2(x/3)1.5 is the equation of the heavy solid line which is the projection of the visible part of the fold curve. These points are in the same region of the surface, and of the (x,y) plane, as nearby points in front of the fold, which are not hidden. Therefore special care must be taken near a cusp, and extra regions must be created.
Suppose a deforming surface is to be animated. The above procedure is sufficient to find the hidden dots for each frame once the visual edges and cusps are computed and the appropriate regions identified, as long as the visibility of each region is specified.
It would be foolish to reestablish this specification for each frame, since the regions themselves merely deform from frame to frame. This is true because any surface sufficiently near a fixed generic surface is also generic, and its projection and singularities have the same topological character, so that corresponding regions can be identified.
However, during a deformation it may be necessary to pass through positions which are non-generic, but unavoidable. Here is an example. Let φ be an infinitely differentiable even function of x, so that (0) = 1, and φ(x) = 0 if x ≥ 1. Let α > 1 be the maximum of dφ/dx attained for x = β, with -1 < β < 0. Consider the following family of surfaces, with t as parameter, under parallel projection.
(5) X = u, Y = v - t φ(u) φ(v), Z = v
When t = 0, we have a simple flat plane. When t = 1, we have pushed a dimple down into the plane, creating two folds joining two cusps (see figure 3).
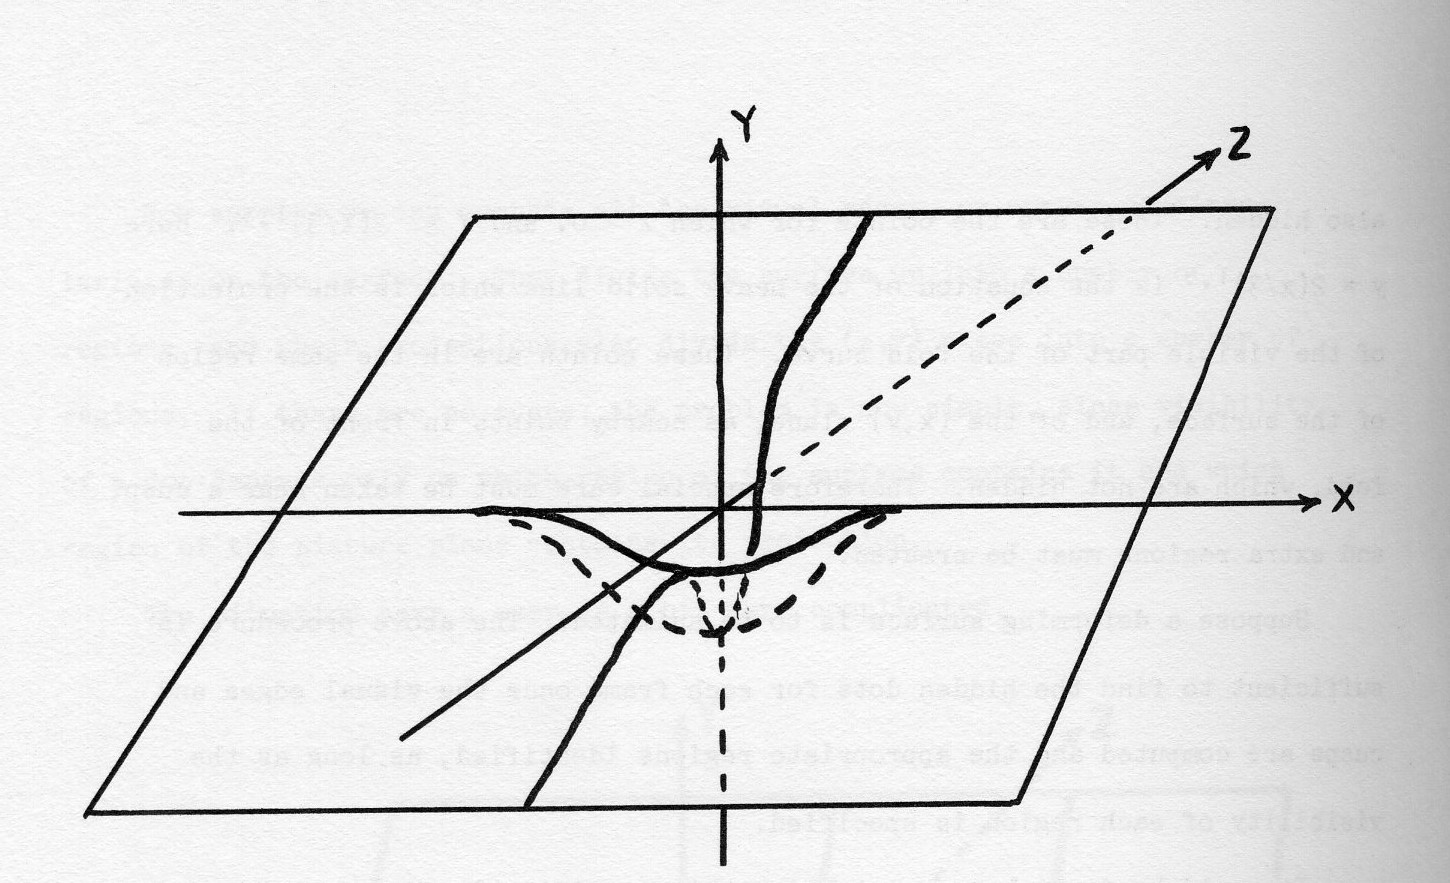
As t increases, the dimple gets smaller. When t = 1/α, we have an isolated singular point u = 0, v = β, into which the cusps and folds coalesce before disappearing.
This particular surface is not generic. Arbitrarily near it there are generic ones of two different kinds, those with a dimple, and those without singularities. There is no deformation from the dimple when t = 1 to the flat plane when t = 0 which is generic for all t. However, in general, near any deformation one can find a generic deformation which has generic surfaces for all but finitely many values of t. For these values, such as t = 1/α above, the surface is of a special type which is as generic as possible, having only one point where something strange happens. These special surfaces are sometimes called of codimension one type, because the set of all of them is of codimension one in the infinite dimensional space of all possible surfaces.
If we look at the above example, the set of singularities forms a surface in the three dimensional space (u,v,t). This surface is folded by f, and the crease is the locus of the exceptional or cusp points. As the cusp points come smoothly together when they disappear, the image of this exceptional curve is smooth. However, this need not always be the case for a map from a three dimensional space. Consider the one parameter family of surfaces below, and its parallel projection
       X = u, Y = uv2 + tv - v4, Z = v
(6)    x = u, y = uv2 + tv - v4
When t = 0, we get a surface
(7) x = u, y = uv2 - v4
with two humps to the right of the cusp, both joining at the same time into a single hump on the left. (See figure 4.)
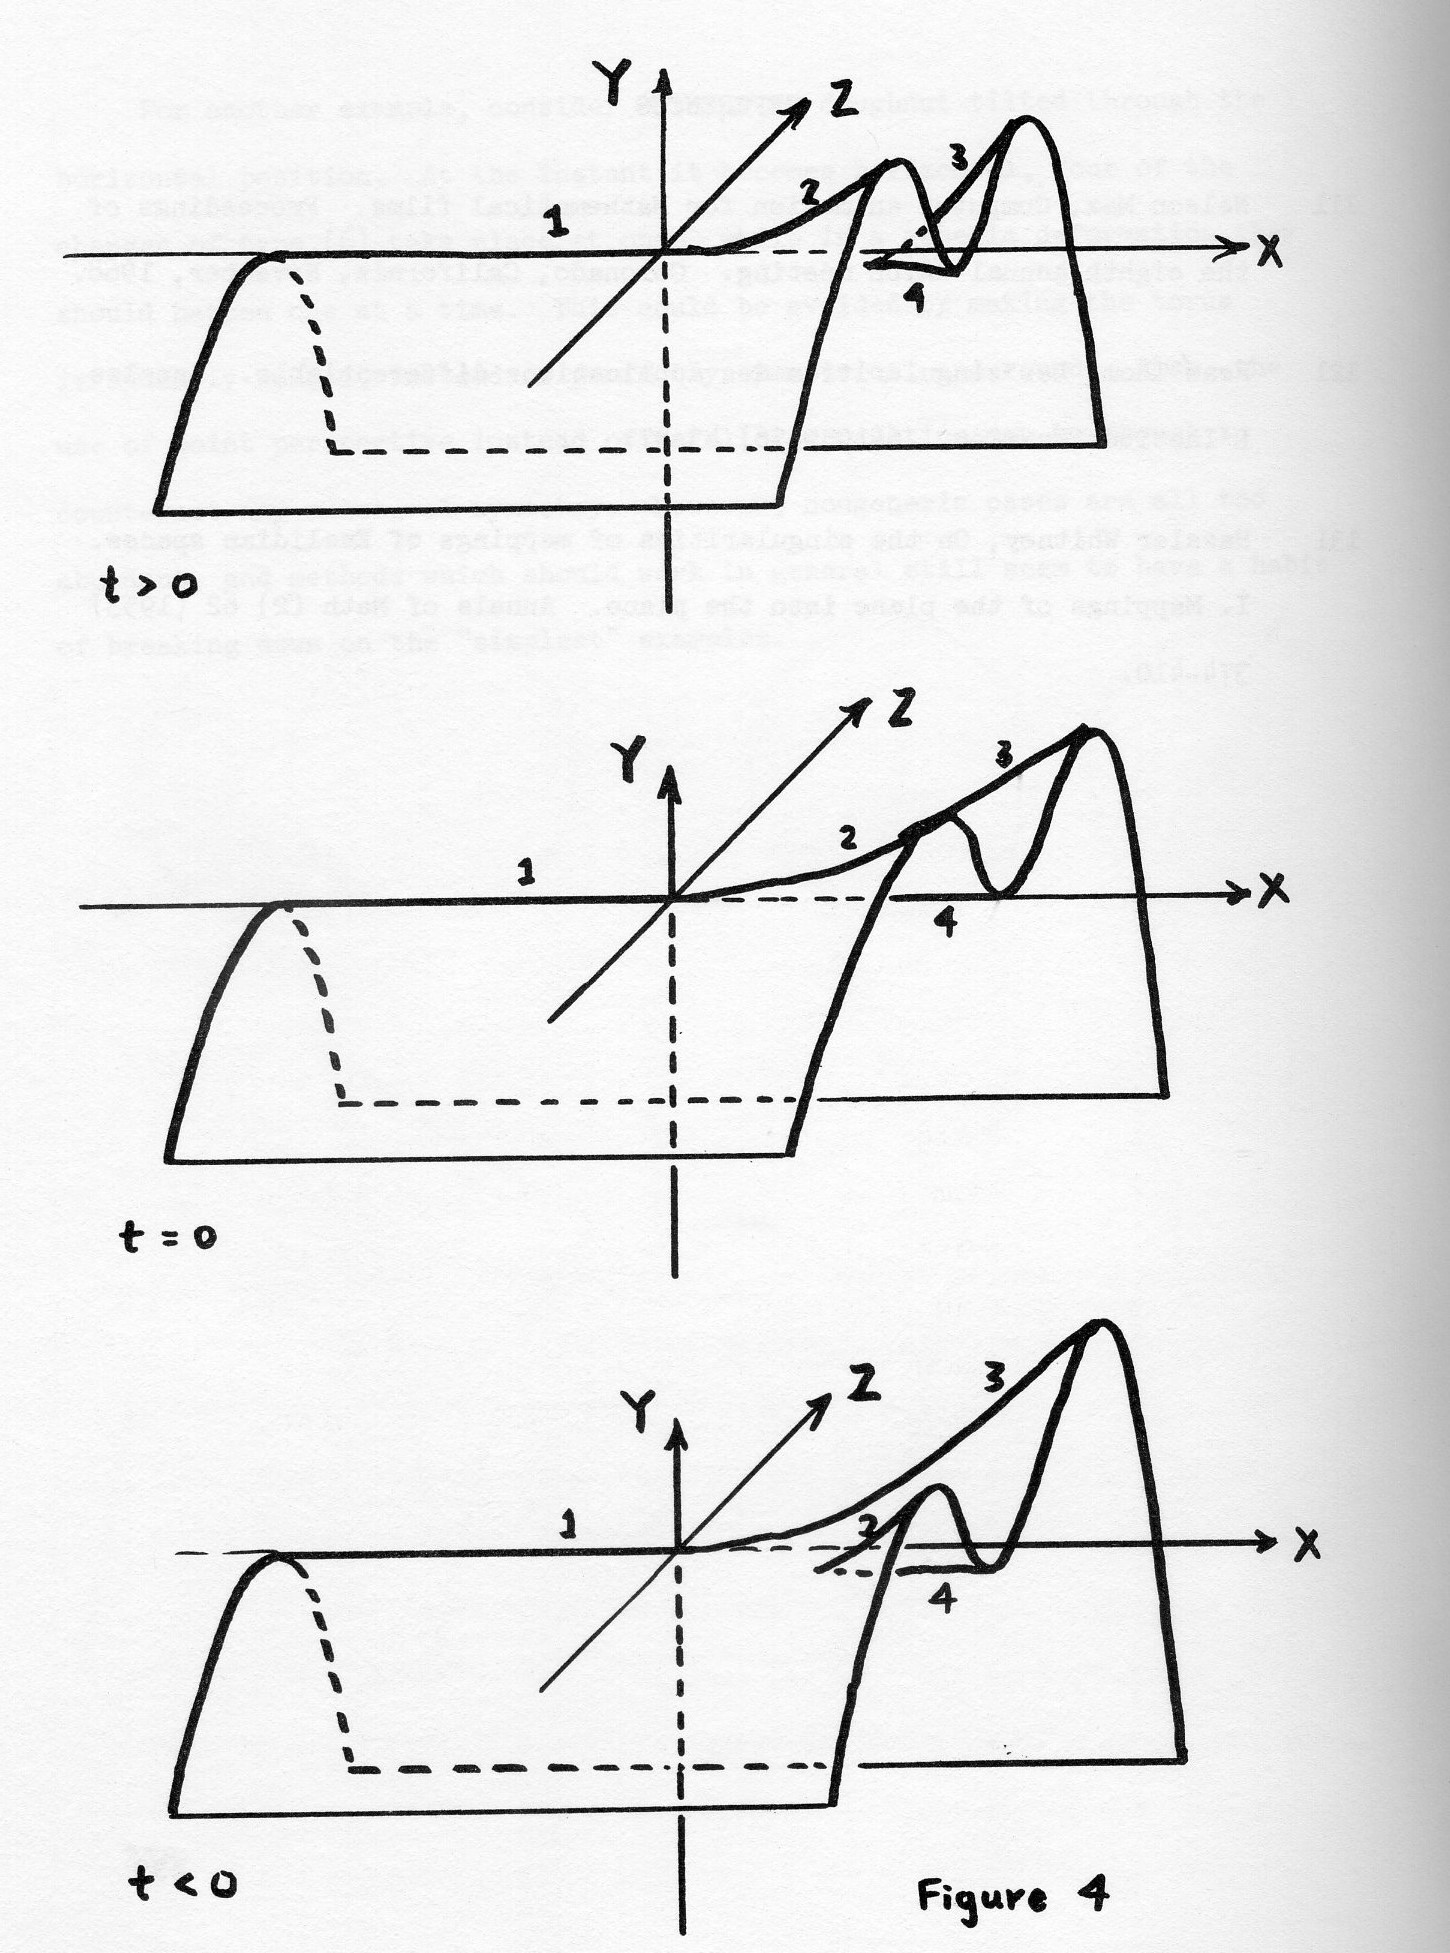
When t is negative, the term tv has the effect of tilting the surface so that the hump in front is raised, and the visual edge (labeled 2) defining its top joins with the one on the left to form a nonsingular visual edge, while the top of the rear hump, 3, meets the bottom of the trough, 4, in a cusp.
When t is positive the tilt is in the opposite direction, and the edges join in a different way, with the cusp in front.
The surface of singularities in (u,v,t) space, found from equation (1), is
     y/v = 2uv + t -4v3 = 0,
 or  t = 4v3 - 2uv.
Substituting this in (6) we get
(8) x = u, y = 3v4 - uv2
which has the same form as (7), and is thus singular.
By switching the role of u and t in (6), we get another family
(9) x = u, y = tv2 + UV - v4
When t = 0, we get the surface
x = u, y = uv - v4
which has a fold along the edge
y = 3 x/44/3
When t < 0, we also get a single fold, but when t increases beyond zero, two cusps form. (See figure 5.)
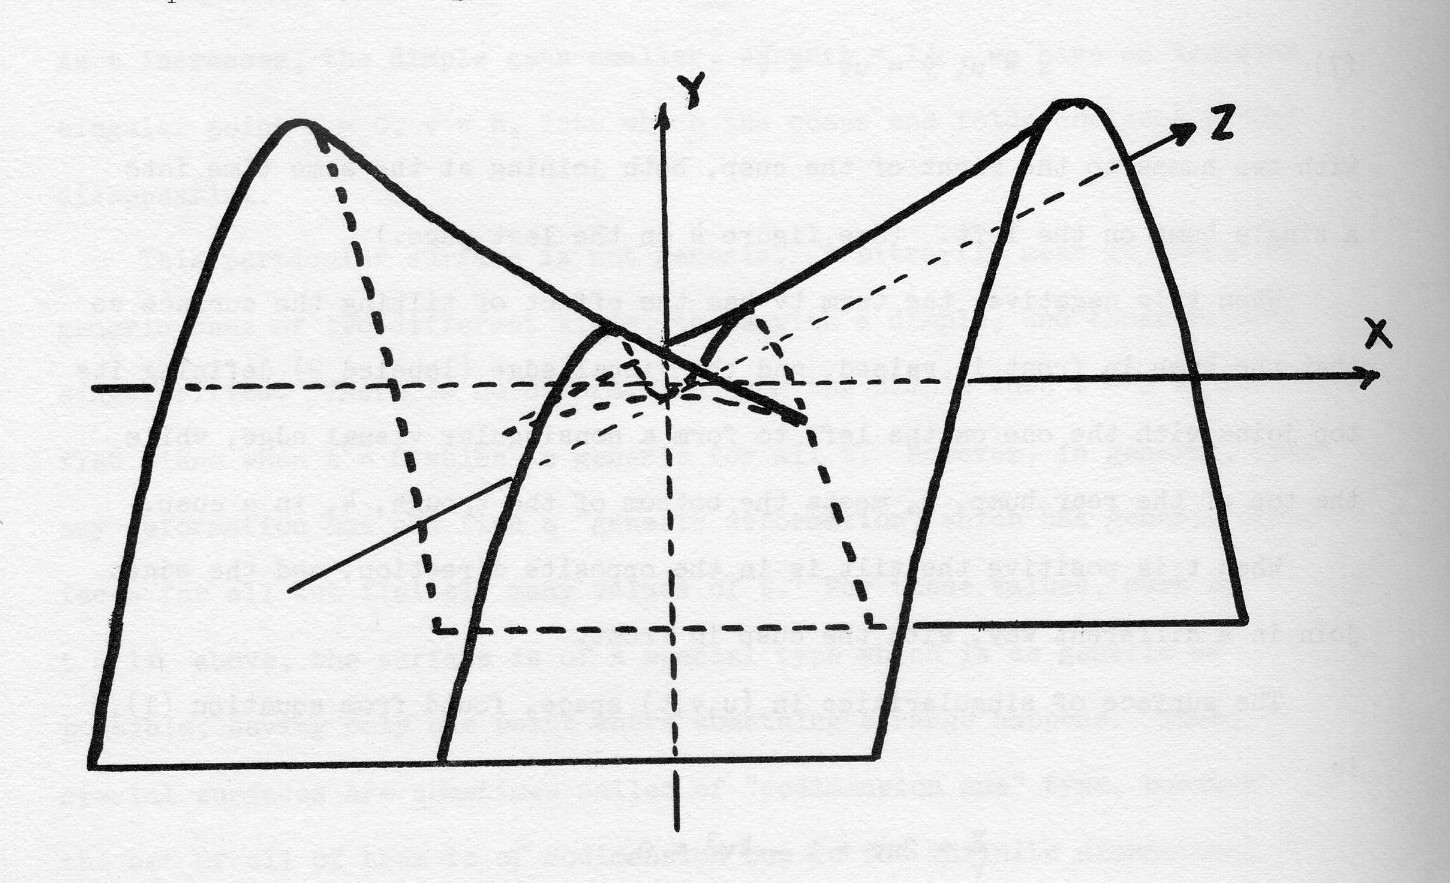
In a generic deformation, the only change in the structure of the folds and cusps will occur in situations such as equations (5), (6), or (9).
However, changes can occur in the projections of the visual edges, even without the edges themselves changing. For example as sphere B passes behind sphere A in figure 6, a new region C must be created, bounded by the folds of A and B.
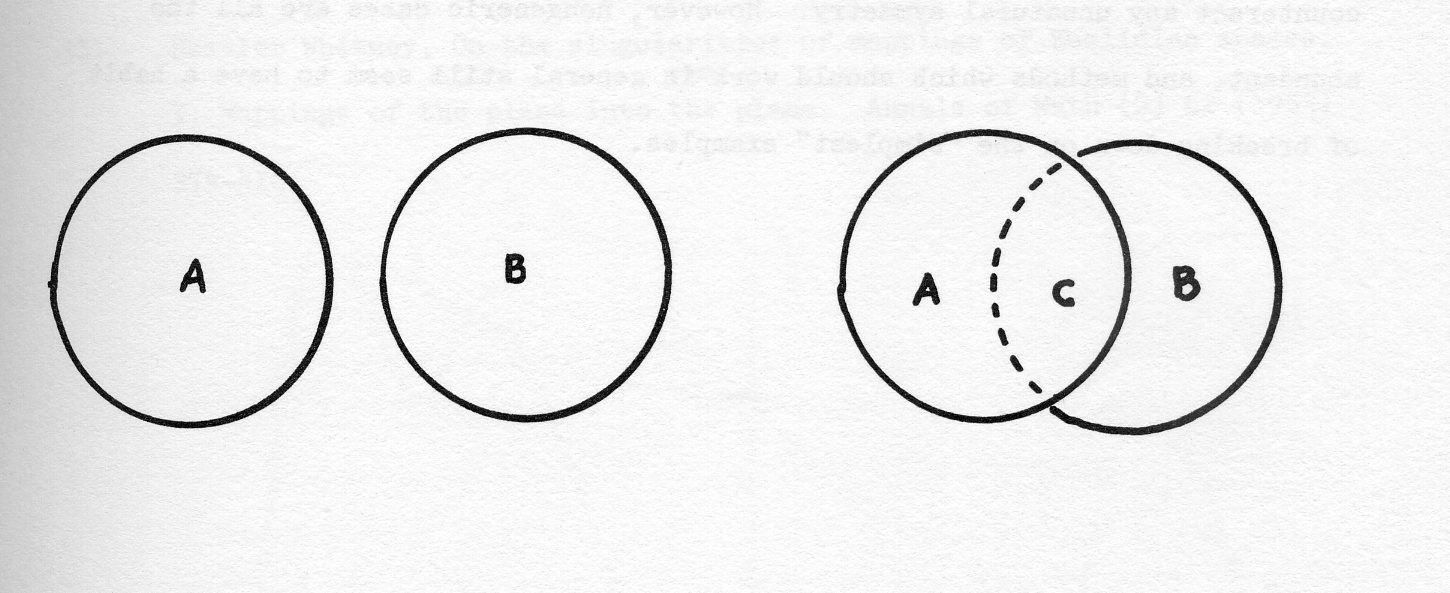
If the above sorts of changes could be incorporated in specifications of which regions were visible, a running tally could be kept from frame to frame. This would only work for generic deformations. Now if a deformation is picked randomly from nature, one can show, using measure theory, that the probability of its being generic is 1. However, surfaces chosen at random by programmers are often too simple, too symmetrical, and in too special a position, like the end on surface discussed above. As ε varies from -1 to 1 in equation (3) the paraboloid will pass a non-generic position for ε = 0. Of course, the deformation could be changed slightly to avoid this by tilting the surface away from the horizontal.
For another example, consider a torus or donut tilted through the horizontal position. At the instant it becomes horizontal, four of the changes of type (6) take place at once, while in a generic deformation they should happen one at a time. This could, be avoided by making the torus irregularly bulged, instead of perfectly symmetrical and round. Also, the use of point perspective instead of parallel projection may be enough to counteract any unnatural symmetry. However, non-generic cases are all too abundant, and methods which should work, in general still seem to have a habit of breaking down on the simplest examples.
[1] Nelson Max, Computer animation for Mathematical films. Proceedings of the eighth annual UATDE meeting. Coronado, California, November, 1968.
[2] Rene Thom, Les singularities des applications differentiable. Annales L'Institut Fourier. 6 (1955-56] 43 87.
[3] Hassler Whltney, On the singularities of mappings of Euclidian spaces. I. Mappings of the plane into the plane. Annals of Math (2) 62 (1953) 374-410.
Magnifying or demagnifying a digital picture is a nontrivial operation. The gray level to be assigned to each point in the output picture must be computed by examining a neighborhood of the corresponding point in the input picture; this point wise process is time consuming for large pictures. In a zoom sequence, the scale change from frame to frame is small, and great savings in computation time can be achieved. This paper presents an algorithm for digital zooming, and also discusses how to remove some of the artifacts which occur if zooming is performed point by point.
The state of the art in computer generated motion pictures is well beyond feasibility studies. The literature abounds with the results of various pilot projects and even contains reports on successful commercial ventures. Computer generated movies began with line drawings on a microfilm plotter and have moved rapidly into full gray scale and color productions. This has been accompanied by a move from the consideration of general feasibility to that of achieving various special effects. In this paper we consider one such effect - the zoom sequence. This problem is interesting and nontrivial because of the need to minimize computing time, and avoid introducing artifacts in the simulation. The desire to have a zoom sequence in a motion picture stems from the idea of being able to simulate the capability of a real camera to move toward or away from a scene.
A zoom is a magnification or a change in scale. There exists a simple function (x' = cx, y'= cy) to represent this mapping of points from one frame to another (expanded or contracted) frame. It is important at this point to clarify what is meant by an expanded frame. In any zoom there is always a center of zoom, some point on the picture, not necessarily the physical center. The expanded picture will be physically the same size as the original; however, the information in the picture will be expanded about the center of zoom, and some information in the old picture will not appear in the new picture.
For the class of pictures whose content is limited to line drawings, the zoom function is readily implementable. That is, if the picture information is stored in a data structure rather than in a raster format one can straightforwardly and rapidly perform zooms analytically. The reason for this is that in such pictures the background need not be examined or mapped into the new frame; it always remains invariant under scale change.
For grayscale and color pictures, however, it is necessary to use the raster format to store pictures. This is because each point in the picture can vary in gray level and/or color. The fixed-level background is a rarity which cannot be counted on. A T.V. quality picture requires on the order of a 500 x 500 raster, which is about 250,000 picture points. In this case the analytical method which works on a point by point basis becomes intolerably slow.
In initial studies of the analytic zoom using a Univac 1108 computer, it was determined that the time required to do a 2:1 zoom of a 72 × 72 point picture, lasting 100 frames, was on the order of two minutes. For larger pictures, the time would go up roughly as the picture area. This is clearly very costly.
Before describing the much more economical algorithm in the next section, a few remarks on the analytic zoom are in order. When a picture is stored as a data structure, it can be zoomed by simply adjusting the values of parameters associated with the data; for example, a line segment between two points (x, y) and (x2, y2), represented in the data structure by these two pairs of coordinates, can be expanded by the factor c by replacing these coordinates by the new pairs (cx1, cy1) and (cx2, cy2). (This assumes that the center of the zoom is at the origin.) This simple forward approach cannot be used when the picture is in raster form, since it would leave gaps in the output picture. Instead, we must use an inverse approach, in which a gray level is assigned to each raster point (x', y') of the output picture by mapping it back into the input picture (x = 1/c x', y = 1/c y'). Here (x,y) is no longer necessarily a raster point of the input picture; to pick a gray level for (x', y'), we can do either of two things: (1) assign it the gray level of the raster point nearest to (1/c x',1/c y'), or (2) assign it a gray level which is a weighted average of the gray levels of the four raster points surrounding (1/c x', 1/c y'). These ideas are discussed more fully in [1].
On examining a zoom sequence one is immediately struck with the small amount of change which takes place from frame to frame. For example, a 2 to 1 zoom might take place over 100 frames of the motion picture. It in fact turns out that most requirements for motion picture zoom sequences would be satisfied by an algorithm capable only of a maximum change of a few percent per frame.
When a picture represented in raster format is zoomed by a small amount, using the nearest-neighbor scheme described above, groups of points in the picture tend to move in large blocks from their positions in the original picture to positions in the new picture. In fact, for a 1% zoom these blocks are of size 100 × 100, for 5% the block size is 20 × 20 and for 10% it is 10 × 10. An example is in order. Consider the case of a one dimensional zoom:
Original:   ...EEECCCAAAOBBBDDDFFF...  (O is the center of zoom)
Zoomed:  ...EEEECCCCAAAAOBBBBDDDDFFFF...
Here one can think of the zoomed pictured as being constructed by shifting the C's one space to the left, the E's two spaces to the left, the D's one space to the right, the F's two spaces to the right, and so on; the cracks resulting from these unequal shifts are mended by adding a new A, a new c, and so on.
Thus to perform a zoom involving only a small scale change, one can compute the corresponding block size, shift the elements of the picture by blocks, and interpolate to fill the resulting cracks. This process was implemented using the PAX picture processing system [2]. in which shifting operations are quite efficient. It was found simplest for this implementation to treat first the x direction (so that the blocks become vertical strips) and then the y direction (horizontal strips). One can prove that this method does not alter the results. A description of the algorithm as originally implemented follows:
Since the successive frames are supposed to increase linearly in magnification, one cannot produce an exact 2% expansion by performing a 1% expansion twice; rather, one should go back to the original picture and expand it 2%, However, this is evidently costly. Furthermore, after a few steps the zoom factor has become large, and the cracking method has lost its advantages. In a 2:1 zoom sequence, one would like to capitalize on the fact that by the end of the sequence, every row and column has been duplicated exactly once. One can do this by sacrificing the exactness of the intermediate steps. To zoom 2:1 in 100 steps, one can duplicate one row (and column) in every strip on the first step; then duplicate a different one on the second step; and so on until each row and column has been duplicated once, at which point an exact 2:1 expansion has been achieved. The problem now is how to choose the sequence of rows and columns to be duplicated. If this is done in too systematic a fashion, the zoom sequence will appear unnatural, since the eye can spot the periodicity.
To solve this problem, an aperiodic method of staggering the cracks is needed. One possibility would have been to use a random selection, but insuring that no column or row is duplicated more than once (in a 2:1 zoom). The method actually used was simpler and still gave a uniform stretching effect over the zoom sequence. The staggered cracks are produced by successive bisection of the strips.
In the case of a 2:1 zoom over 100 frames, the strip width is 100 points. The successive cracks in each strip are chosen at 50; 25; 75; 12; 37; 62; 87; 6; and so on.
This zoom algorithm produced significant savings in computer time, as shown in the table below.
| Picture size | Average tine per frame (seconds) | |
|---|---|---|
| Analytic zoom | Staggered cracked zoom | |
| 72 × 72 | 1.2 | 0.7 |
| 480 × 360 | 26.0 | 4.2 |
The algorithms were implemented in PAX, and were not squeezed for coding efficiency. A Fortran IV machine-independent version of the algorithm is being written; it is expected to yield substantial further savings in computer time.
1. E. G. Johnston and A. Rosenfeld, Geometrical operations on digital pictures in B. S. Lipkin and A. Rosenfeld, eds., Picture Processing and Psychopictorics, N. Y.: Academic Press, 1970, 217-240.
2. E. B. Butt and J. W. Snively, Jr. (Revised version edited by E. G. Johnston and Roger Lipsett), The PAX II Picture Processing System, University of Maryland Computer Science Center Technical Report TR-68-67, May 1968 (Revised September 1969).
The film FOCUS is a black and white movie with a magnetic sound track recorded at 16 frames per second. A screening of this film, lasting 10 minutes, comprises the first part of the paper.
The prints from the original are processed to give black lines on a white (clear) background purely as a matter of taste. Whilst scratches made by badly adjusted projectors are more noticeable, commercial scratch treatment is very effective on this type of print. This is because the processes restore the base material and emulsion as regards their transmission of light but cannot, of course, selectively redeposit silver. In connection with scratching, it has been found useful to remove a small almost superfluous guide-plate on our BD 644 Bell and Howell projector. This enables the sound drum to be bypassed. The high inertia of this makes it continue running after the film has stopped. Although the drum appears smooth it does cause scratching with start-stop running.
The object of making FOCUS was to illustrate the software available and to gain first-hand knowledge of the snags as well as the possibilities afforded by the film industry. A suitable area offering experience of both proved to be that of sound-effects.
After a reasonable print of the film had been obtained, I then began to consider the details involved in the addition of a sound-track to the film. Since 16 frames per second is equivalent to almost 5 inches per second and because computing requirements are high for animated movies, I had decided to record sound at the so-called silent speed. I did not envisage producing many very high audio frequencies in the sound-effects. As far as the film industry was concerned, however, I had already committed the sin of going to a non-standard or rather, unheard-of, sound speed. After a brief consultation with the men in the film laboratory's sound department, I was instructed to supply them with an ordinary (!) tape recording, perfectly sound balanced for volume and exactly matching the film in timing. They would then be able to transfer this to a perforated 16 mm magnetic tape running at 24 frames per second - their only speed. Although unable to monitor it they would end up with a master recording ready for either transferring to a magnetic stripe added to a print, or for producing a photographic or optical sound track also for transferring to a print. As the 16 mm magnetic tape is perforated the same as the film, the sound-track once correctly recorded on this then presents no synchronisation problems in transferring to a print.
I now understand the mechanics of actually obtaining a sound-track on the film, but all the difficulties of generating sounds and achieving synchronisation lay ahead. Fortunately, help was to hand: a professional film maker, Peter Hadingham of Swift Film Productions who once made a documentary film about our Laboratory was easily persuaded to become involved in a computer animated movie. He protested somewhat at recording sound at 16 frames per second but said that he could do it. The aim was still to generate a perforated 16 mm magnetic tape as a master for subsequent transfer to a striped print(s).
The first task before going to the studio was to produce a script for the dialogue and notes as to the sound-effects for the other sequences. Even though it was not possible to decide on all the sounds until the very last moment, the majority were noted down at an early stage. In the case of the dialogue, the object was to express the basic principles concisely about what was being shown, with regard for accuracy and with little or no ambiguity. A Bell and Howell projector with helper proved invaluable in the final stages of rewording the script to fit more exactly with the pictures. Sequences were lengthened in order to get all the relevant details in, as well as producing a more smoothly flowing visual presentation.
The actual production and recording of the sound effects and dialogue were virtually completed in one very full working day by Peter Hadingham and myself. I arrived imagining that the sounds I had requested would be gradually produced one by one from a library of records. It was soon pointed out to me that unfortunately even if just the right sounds could be found, copyright fees payable would add considerably to the cost.
The method of recording was to employ a modified Bell and Howell model 640 projector. It has been adapted to run double-headed i.e. to transport a 16 mm perforated magnetic tape as well as the film being projected. Basically, two extra spools had been mounted so that both film and magnetic tape could be taken up. If desired, the projector could be restored to its original state with no marks showing. The projector's magnetic head could also be manually moved in and out of play/record positions. This eliminated noise in going from play-back to record whilst projecting and thus permitted a high degree of synchronisation.
The sound effects were initially recorded on the tape recorder which had a mechanism on the tape-deck preventing switching-on noises being picked up by the recorder. These effects were then transferred to the projector with both film and perforated magnetic tape running through. For merging sounds it was necessary to employ two tape recorders. A third portable recorder proved useful for recording sounds that had to be generated outside the studio itself, such as the sound of running water used in one sequence.
Another factor that I had not appreciated was the high degree of synchronisation necessary between the start or finish of a sound with the projected image. To achieve this it was necessary for one of us to operate the projector, whilst the other started the tape recorder used for storing the sound effects as we went along.
Thanks to the immense talent of my colleague both musical and for improvisation, sound production forged ahead at an incredible rate. Bongo music, either South American or Afro, zither music, xylophone, guitar, flute or bass fiddle sounds could be produced to order. I was even persuaded to contribute a grunt at one point! Some sounds, such as a cine-projector running when recorded from an actual machine, did rot sound anything like it: a hand-turned sewing machine made a much more realistic projector noise. A breeze turning into a gale can be nicely simulated by blowing into a microphone held close to the mouth. A large diameter film spool on a high speed rewind substitutes well enough for a jet plane, and may be recorded in more comfort than to attempt to capture a real one. Other sounds may be made more intriguing using faster playback before adding to the sound track. By taking the back from a cuckoo-clock the bird may be persuaded to call on demand at a rate to suit you.
After the 16 mm magnetic film had been satisfactorily recorded at 16 frames per second, a sprocketed tape recorder running at 24 frames per second and driven in synchronisation with the film projector was used to transfer the sound onto the film stripe. As the print had been made on single perforated stock it was possible to have a full-track magnetic stripe as opposed to a ¼-track one. This provides for more sound volume with less background noise if being shown to a large audience. The transfer is done each time a new copy of the film is produced requiring a sound track. It would be possible to convert the magnetic sound track into an optical one, but loss of quality would undoubtedly result at this projection speed.
Apart from the fact that a film recorded at 16 frames per second cannot be replayed on T.V. which in Britain runs at 25 frames per second, few drawbacks exist. Most projectors will play-back at 16 frames per second and with full-track striping results are more than reasonable.
By far, the most ubiquitous computer graphics device in the U.S. has been the CalComp Drum Plotter. Equally popular has been the CalComp Basic Software Package (copy right by California Computer Products, Inc.), which consists of 6 subroutines callable from a high level language such as FORTRAN or PL/1. When the computer driven microfilm recorders such as the Stromberg DatagraphiX 4020 became available, many prospective users were discouraged at the prospect of a major reprogramming effort. The following is a description of two FORTRAN IV subroutines that will efficiently translate a CalComp program into an SD 4020 output tape. When submitted behind an existing plotter program, they accomplish the conversion process without altering any source code at all.
The CalComp Software is based on an inverted pyramidal hierarchical structure resting on the subroutine PLOT (see Fig. 1)
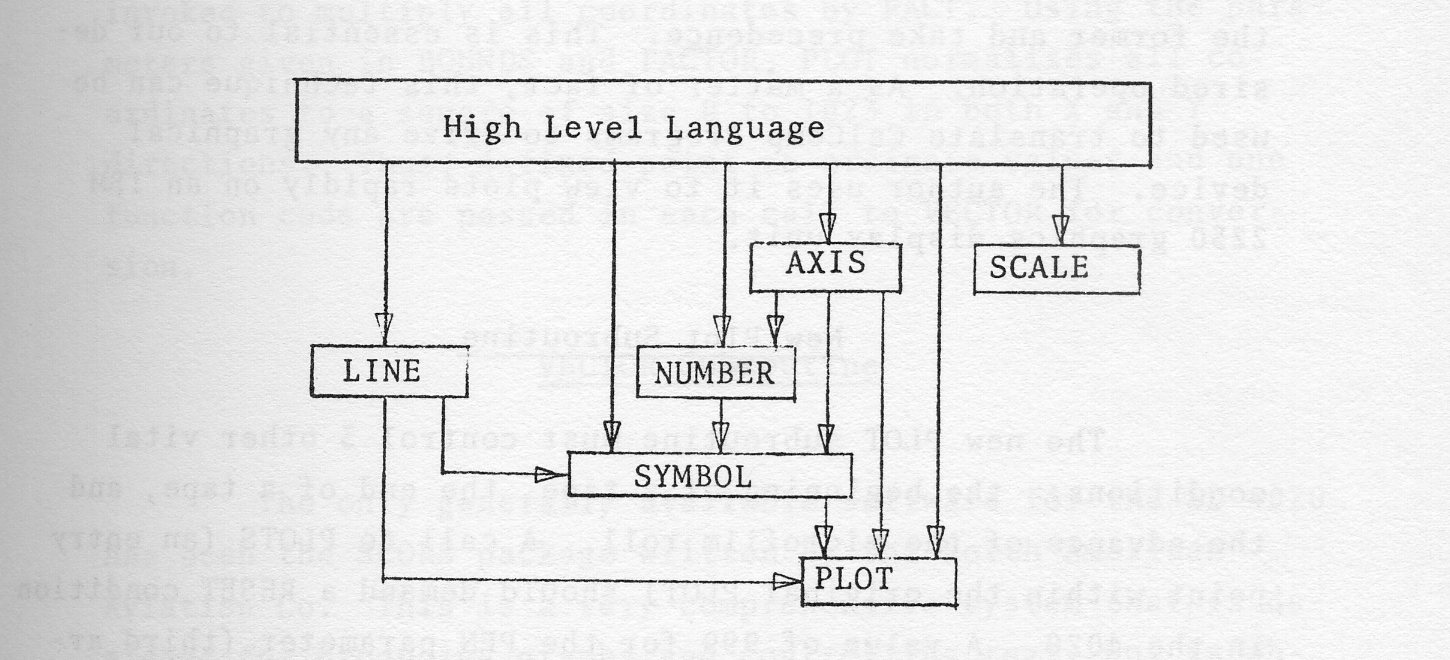
All calls develop a line or series of line strokes that eventually call PLOT with 3 arguments. (A note of warning: In SYMBOL, register zero may have to be reset to one after PLOT is called. It expects PLOT to be in Assembly Language, which leaves register zero intact.) These specify the X and Y coordinates of a point, and a code to indicate whether the pen should be lowered or lifted. Thus if the PLOT subroutine were replaced with another subroutine that would field all pen commands and remember the beginning and ending points of a line stroke, it would call another routine to encode this line in 4020 form. This is a far more efficient scheme than translating an output Calcomp tape, which is chain encoded into very small discrete steps of several thousandths of an inch in length. Furthermore, most computer operating systems will permit the inclusion of two subroutines by the same name (in this case, PLOT) in a source module; the latter one will overlay the former and take precedence. This is essential to our desired operation. As a matter of fact this technique can be used to translate Calcomp Programs to drive any graphical device. The author uses it to view plots rapidly on an IBM 2250 graphics display unit.
The new PLOT subroutine must control 3 other vital conditions: the beginning of a tape, the end of a tape, and the advance of the microfilm roll. A call to PLOTS (an entry point within the original PLOT) should demand a RESET condition in the 4020. A value of 999 for the PEN parameter (third argument of PLOT call) should spill the buffer and place an End File on the tape. And finally, a value of -3 for the PEN parameter which requests a new origin in the original PLOT subroutine, will arbitrarily be treated as a request for a new frame of film. All of these functions are performed by setting a code number, and calling an all FORTRAN subroutine VECTOR, described in the next section.
The new PLOT should also allow specifications of full screen boundaries in terms of inches. This was done by adding an entry point called BOUNDS (XL, YB, XR, YT) where:
(XL,YB) defines the lower left corner, and
(XR.YT) defines the upper right corner.
The default values are (-1.0, -1.5) for lower left, and (11.0, 10.5) for upper right. These values were chosen to give a twelve inch square area which allows room for lettering below or to the left of the origin. This call can also be used to reset the origin; e.g. CALL BOUNDS (-5.0, -5.0, 5.0, 5.0) gives a 10 inch square plotting area with the origin at the center. The standard call to the entry point FACTOR(FACT) can still be invoked to multiply all coordinates by FACT. Using the parameters given in BOUNDS and FACTOR, PLOT normalizes all coordinates to a square of size 0 to 1023 in both X and Y directions. Thus, 4 fixed point co-ordinate values and one function code are passed in each call to VECTOR for conversion.
The only generally available software for the SD 4020 has been the SCORS package written by the North American Aviation Co. This is a very comprehensive system that is designed for producing graphs and controlling text, but is obviously over-engineered for simple line drawing tasks. As a matter of fact, in order to plot a line under SCORS, no less than 10 different subroutines were involved! As each subroutine is linked, all registers are stored and eventually reloaded, so a great deal of CPU time was needlessly lost. By putting all this logic and encoding within VECTOR, a typical straight line plotting program takes only 60% of the time previously required.
Only 3 commands in the 4020 instruction set are needed. RESET performs simultaneously ADVANCE FILM, STOP TYPE, and EXPOSE HEAVY commands, at the beginning of a run. ADVANCE FILM, is also needed by itself. Whenever either of these two control operations is requested, a short length record is written to force an inter-record gap. This allows a time delay in case a 4020 installation does not have an F-53 input buffer. It also permits compatibility with a CII 120 microfilm recorder.
The other 4020 command needed is DRAW VECTOR. (See Fig. 2).
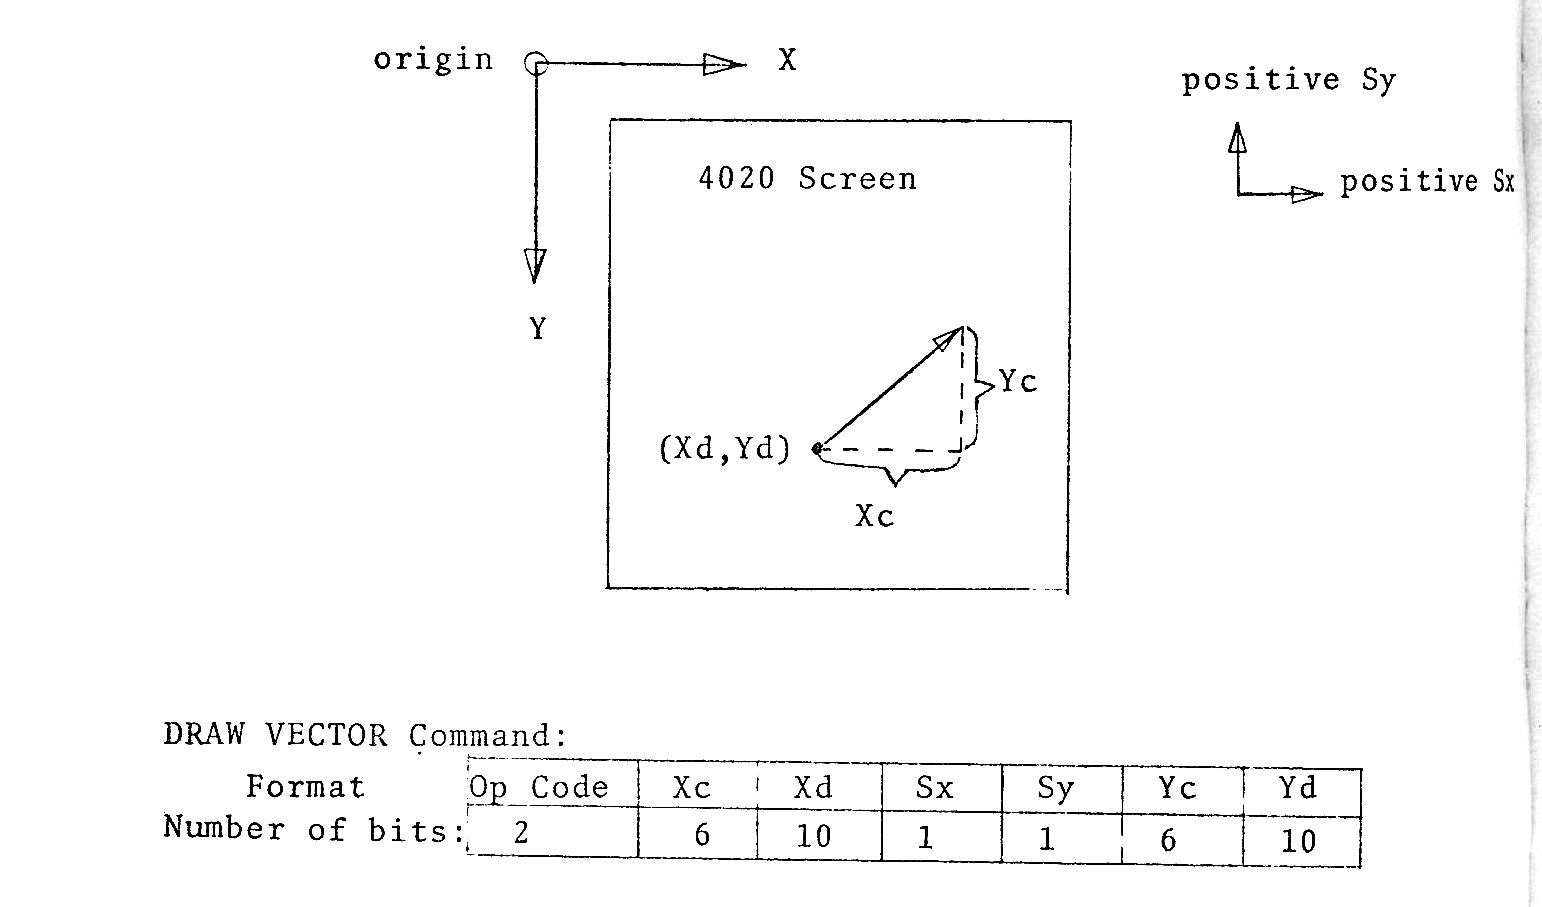
The command is built in FORTRAN using multiplication by powers of 2. This is somewhat time consuming itself, and could be avoided by a left shift assembly language routine. Unfortunately, the largest vector possible with this bit structure is 63 raster units long for both X and Y coordinates. A longer line, then, is broken down into smaller lengths with repetitive DRAW VECTOR commands. The 2 Op Code bits are always 1, and the sign bits appear as 1 if in a positive sense, 0 if negative.
Since the total command contains 36 bits, it is written on a 7 track tape as 6 contiguous 6 bit (plus parity) characters This arrangement works out on a 36 bit word computer in fixed point arithmetic, but the left most bit (which must always be 1 for DRAW VECTOR) is treated as a sign bit. On an IBM 7094, only the sign bit is flipped to indicate negative numbers, so the word is negated, and 2**34 is added for the Op Code portion. On a 36 bit word UNIVAC 1108, negative numbers are handled in one's complement form, so a negative (2**34 - 1) is added. A CDC 3800 has 48 bits, so the sign bit is left positive (zero), but a right adjusted format of 6 characters must be specified (FORMAT(170R6)).
The IBM 360 has a 32 bit word (4 eight bit bytes), so that a full command will not fit. An optional convert feature on some machines will strip off 6 contiguous bits for each character, but this leaves an awkward fraction of a word to deal with. To allow compatibility with 360 computers without the convert feature, the standard truncation of 8 bit bytes to 6 bit characters was assumed. Each byte is padded with 2 leading zeros which are not used. (See Fig. 3).
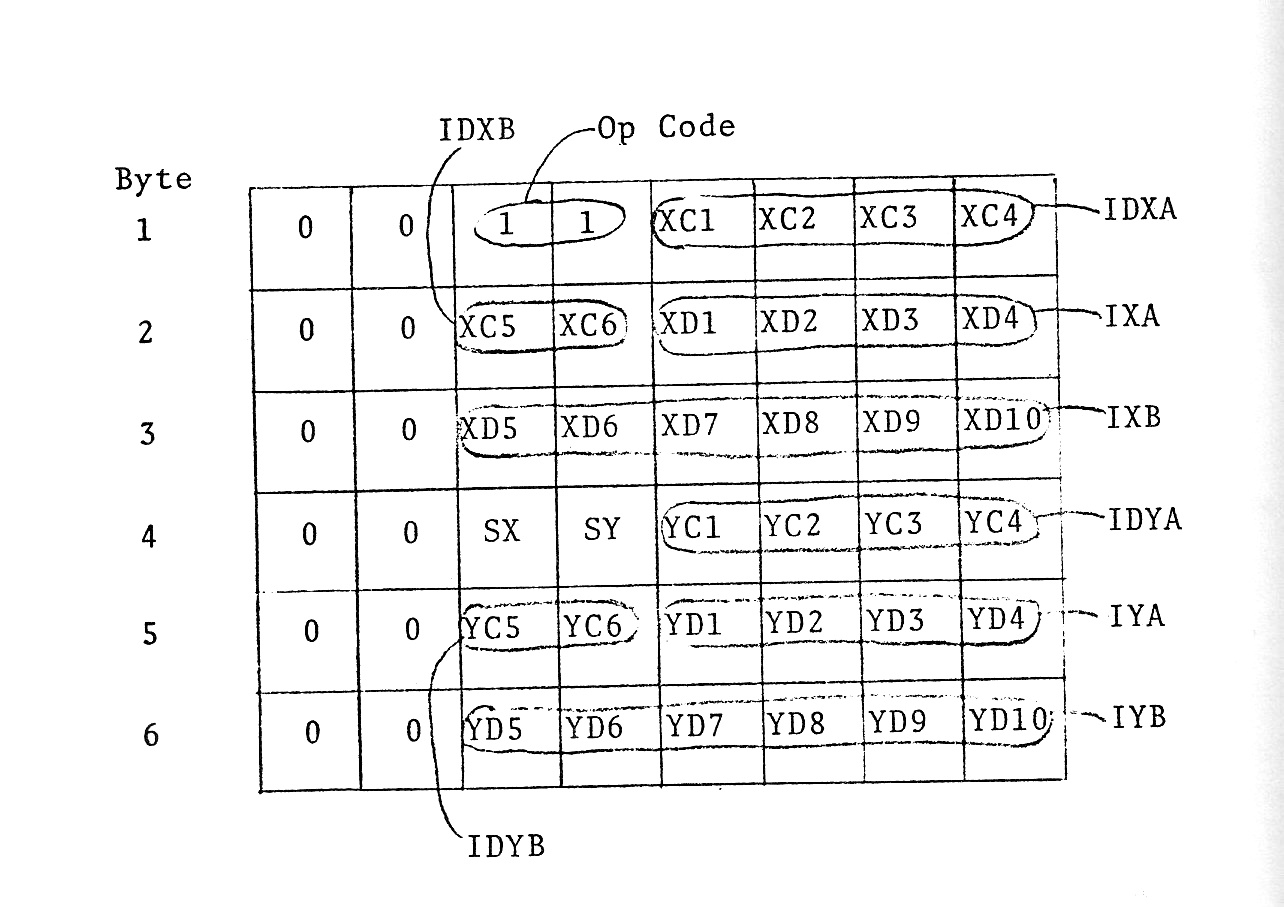
With the above structure, a command is nested within 3 half words so that a modest sized 510 half word array is required to store 170 commands, which fill a small F-53 buffer.
It is my feeling that Graphics should be treated as an ancillary function to computer applications. It should not become a stumbling block for the novice who wants effective pictorial output for a useful program. If a programmer is already familiar with CalComp plotting commands, there is no reason for him to master a new language simply to take advantage of the convenience of microfilm.
      SUBROUTINE PLOT(X, Y, IPEN)
C     THIS SUBROUTINE OVERLAYS THE PLOT SUBROUTINE IN THE CALCOMP
C     PACKAGE AND TRANSLATES THE OUTPUT INTO CODE FOR THE STROMBERG
C     DATAGRAPHIX 4020. IT CALLS ON VECTOR TO ENCODE THE COMMANDS.
C     WRITTEN BY S.E.ANDERSON APPLIED PHYSICS LAB. JULY 1970
C     REQUIRES PATCH TO SYMBOL...LA 0,1 AFTER SYMB1030 IN SOURCE DECK
C        USE CALL PLOTS(...) TO INITIALIZE TAPE.
C        USE CALL BOUNDS (XXL,YYB,XR,XT) TO SPECIFY LOWER LEFT CORNER
C        (XXL,YYB) AND UPPER CORNER (XR,YT) OF SCREEN
C        USE IPEN=-3 TO ADVANCE FRAME
C        USE IPEN=999 TO TERMINATE TAPE
      GO TO 100
      ENTRY PLOTS(IBLF,NLCC,LDEV)
C     RESET AT BEGINNING OF RUN
      CALL VECTOR(0,0,0,0,3)
C     SET UP CONSTANTS
      FCT=1.
      XMLT=85.3
      YMLT=85.3
      XL=-1.0
      YB=-1.5
C     START WITH 5 BLANK FRAMES OF FILM...
      DO 9991 J=1,5
9991  CALL VECTOR(0,0,0,0,2)
      GO TO 999
      ENTRY WHERE(RXPAGE, RYPAGE, RFACT)
      RXPAGE=X
      RYPAGE=Y
      RFACT=FCT
      GO TO 999
      ENTRY OFFSET(XCFF,XFCT,YCFF,YFCT)
      GO TO 999
      ENTRY FACTCR(FACT)
      FCT=FACT
      GO TO 999
      ENTRY BOUNDS(XXL,YYB,XR,YT)
      XL=XXL
      YB=YYB
      XMLT=1023./(XR-XL)
      YMLT=1023./(YT-YB)
      GO TO 999
  100 IF(IPEN-99) 200,104,104
C     END OF FORTRAN PROGRAM
C     EXECUTE BUFFER CONTENTS AT END OF RUN.
  104 CALL VECTOR(0,0,0,0,4)
      GO TO 999
C        PLOT A LINE...
  200 IX1=IX2
      IY1=IY2
      IF(FCT.EQ.1.)GOTO 201
      X=X*FCT
      Y=Y*FCT
  201 IX2=(X-XL)*XMLT
      IY2=(Y-YB)*YMLT
      IF(IPEN-2)400,202,999
C        IF IPEN=-3 CALL FOR A NEW FILM FRAME
C        DISREGARD THE X,Y CO-ORDINATES
  400 CALL VECTOR(0,0,0,0,2)
      GOTO 999
C     DRAW LINE
  202 CALL VECTOR(IX1,IY1,IX2,IY2,1)
  999 RETURN
      END
      SUBROUTINE VECTOR(IX1,IY1,IX2,IY2,ICODE)
C        IBM 360 VERSION (32 BIT WORD)
C        THIS FORTRAN SUBROUTINE CREATES A 7 TRACK TAPE FOR THE 4020
C        STROMBERG DATAGRAPHIX MICROFILM RECORDER. IT ACCEPTS ONLY
C        LINE DRAWING AND FRAME ADVANCE COMMANDS (NO CHARACTERS).
C        WRITTEN BY S.E.ANDERSON APPLIED PHYSICS LAB. JULY 1970
C        IT DRAWS A LINE FROM (IX1,IY1) TO (IX2,IY2)
C        WHERE X AND Y RANGE FROM 0 TO 1023
C        ICODE=1 FOR LINES
C        ICODE=2 FOR FRAME ADVANCE
C        ICODE=3 FOR RESET (INITIALIZES 4020)
C        ICODE=4 FOR END OF TAPE
      DIMENSION J(4)
      INTEGER*2 IBFR(510)ISGNX=1
      ISGNY=1
      IRET=1
      GO TO (101,102,103,104),ICODE
C        FRAME CMND.
102   IHW1=9728
      IF(IX.GT.4) GO TO 200
      IBFR(IX)=2560
      IX=IX+3
      GO TO 102
C        RESET CMND
103   IHW1=11776
      IBFR(1)=2560
      IBFR(4)=2560
      IX=7
      GO TO 200
C        STOP TYPE CMD
104   IF(IX-1)208,208,204
C        VECTOR CMND
C        TRUNCATE LINES AT BORDERS
101   J(1)=IX1
      J(2)=IY1
      J(3)=IX2
      J(4)=IY2
      DO 400 I=1,4
      IF(J(I).LT.0) J(I)=0
      IF(J(I).GT.1023) J(I)=1023
400   CONTINUE
C        INVERT Y COORDINATES
      IXD=J(1)
      IYD=1023-J(2)
      IDX=J(3)-J(1)
      IDY=J(2)-J(4)
      IF(IDY)418,416,420
C        IGNORE ZERO LENGTH LINES
416   IF(IDX)422,999,424
C        CASE WHERE Y COMPONENT IS NEGATIVE
418   IDY=-IDY
      ISGNY=-1
420   IF(IDX)422,424,424
C        CASE WHERE X COMPONENT IS NEGATIVE
422   IDX=-IDX
      ISGNX=-1
424   IF(IDX-IDY)128,120,120
C        CASE WHERE IDX GE IDY
120   TAN=FLOAT(IDY)/FLOAT(IDX)
      IXC=63
      IYC=63.0*TAN
      IXCS=IXC*ISGNX
      IYCS=IYC*ISGNY
      N=IDX/63
      IF(N)125,125,123
123   IRET=2
      DO 124 I=1,N
      GO TO 199
126   IXD=IXD+IXCS
124   IYD=IYD+IYCS
125   IXC=IDX-N*63
      IYC=FLOAT(IXC)*TAN
      IRET=1
      GO TO 199
C        CASE WHERE IDY GE IDX
128   CCT=FLOAT(IDX)/FLOAT(IDY)
      IXC=63.0*CCT
      IYC=63
      IXCS=IXC*ISGNX
      IYCS=IYC*ISGNY
      N=IDY/63
      IF(N)131,131,129
129   IRET=3
      DO 130 I=1,N
      GO TO 199
132   IXD=IXD+IXCS
130   IYD=IYD+IYCS
131   IYC=IDY-N*63
      IXC=FLOAT(IYC)*CCT
      IRET=1
C        BUILD 4020 LINE COMMAND in 3 HALF WORDS
199   IDXA=IXC/4
      IDXB=IXC-ICXA*4
      IXA=IXD/64
      IXB=IXC-IXA*64
      IDYA=IYC/4
      IDYB=IYC-IDYA*4
      IYA=IYC/64
      IYB=IYC-IYA*64
      IHW1=12288+IDXA*256+IDXB*16+IXA
      IHW2=IXB*256+32*((ISGNX+1)/2)+16*(-(ISGNY-1)/2)+ICYA
C           LOAD A 6 BYTE COMMAND INTO BUFFER
200   IBFR(IX)=IHW1
      IBFR(IX+1)=IHW2
      IBFR(IX+2)=IHW3
      IX=IX+3
202   IF(ICODE.EQ.1).AND.((IX.LT.511))GO TO 210
204   IXM1=IX-1
      WRITE(10,206) (IBFR(M), M=1,IXM1)
206   FORMAT(255A2,255A2)
      IX=1
      IF(ICODE-4)210,208,210
208   END FILE 10
210   GO TO (999,126,132),IRET
999   RETURN
      END
In this session the panel of Canadian computer animators discussed activities in this field as they are currently taking place in Canada.
Kar Liang, National Film Board of Canada, Montreal, Canada, introduced the topics for discussion commenting on the place of computer graphics in the realm of information and data systems, as both a communication medium and a creative medium.
Leslie Mezei, University of Toronto, Toronto, Canada, described an interactive graphic system ARTA, and some projects in computer arts and animation.
Frank Cairns, National Research Council of Canada, Ottawa, Canada, talked about work at NRC on musical composition and computer film animation. Dr. Marcelli Wein, also of NRC, presented technical details of items mentioned by Frank Cairns, discussing in particular Key Frame Animation.
The session consisted of six parts:
Unfortunately, neither Lee Harrison nor John Whitney, scheduled to appear in the program, were able to attend.
The paper surveys key issues in the design and evaluation of current and future interactive computer animation systems.
The marriage of computer animation and interactive graphics I call interactive computer mediated animation. The phrase is cumbersome, but the words interactive and mediated are of critical importance.
In a medium, through a dialogue, we form and shape and represent content and meaning, the subject matter of the dialogue. An interactive language must mediateand enhance creative expression of that subject matter.
The matter of animation is first and foremost images, hence graphically-rich imagery should be mediated through graphic, pictorial interaction.
The matter of animation is picture change, picture dynamics, hence rich dimensions of dynamic variability should be mediated through interaction expressive in time and of time.
The matter of animation is rich sensory experience, hence dynamic intuition should be expressed through tangible, sensual interaction.
The matter of animation is symmetry and order and organization, hence precision and structure should be mediated through interaction expressed simply, clearly, cleanly.
The matter of animation consists of large collections of images, image sequences, changing images, hence the transaction time per interaction and the transaction time per mediated image should both be as small as possible.
We can therefore evaluate interactive animation systems along these five key dimensions - graphic, dynamic, sensual, structured, and immediate, by considering:
In the first half of the program, three panelists will describe, in words and with film, very different realizations of the interactive computer-mediated animation concept. I will present the GENESYS system and the picture-driven animation model. Lee Harrison III will describe the Computer Image family of animation systems. Prof. Charles Csuri will relate how he and a group of his art students have experienced and worked with a set of interactive animation programs. What are the essential features of each system? How does a user interact with it? How strong is the system along each of the five key dimensions? What does current use suggest about future evolution of animation systems?
Following the coffee break, Prof. Tim Standish, a computer scientist whose specialty is languages for interactive computing, Dr. Bert Sutherland, a computer scientist whose specialty is interactive graphics, and John Whitney, a film maker and pioneer in computer animation, will comment on the earlier presentations.
All six panelists, and I hope the audience as well, will then discuss future approaches towards enriching computer animation media and towards facilitating interaction between animator and computer. To stimulate this discussion, let me pose some questions, organized under three headings:
The choice of hardware is a major determinant of the graphic quality of images that can easily be produced with a system. The first part of the program features radically different solutions to the choice of hardware, some primarily analog and TV circuitry, the others primarily digital logic. These technologies should be married in future animation systems. How can this best be accomplished? Can we characterize what is done most naturally by digital, analog, or TV techniques? Are there qualities or potentialities of conventional animation media that cannot be achieved with any of these approaches? How about interfacing with animation stands (a la Kar Liang)? or, should we design totally new animation stands? (Whitney's analog computer-controlled stand, and Scanimate, are both new animation stands in the sense that they are machines for transforming arbitrary still graphics into animated image sequences.)
The graphic quality of most current computer animation (aside from simple straight line drawings) is sufficient to identify uniquely its source. Just as we can distinguish cel animation from cut paper animation from direct painting on film, we can immediately recognize a Computer Image or a GENESYS or a BEFLIX product. Need each computer animation system have a unique graphic quality, or can we build a single system that will simulate a family of diverse animation media? I envision a computer animator of the future sketching (defining Images) with a flexible electronic paintbrush or electric pen, with which he can generate incredible varieties of line, shading, and texture, and which he can tune to achieve distinctive styles of his own. What is required to make this vision a reality? - new display hardware, integration of line drawing with video display capability, better control of the quality (intensity, thickness, modulation) of line or video signal, software generation of shading or texture in two or three dimensions,...?
What about storage and playback? Storage could be digital, on video tape, or photographic (including holographic). Playback could be from video tape, or by general - or special-purpose display processors, digital, analog, or hybrid. What are the advantages and disadvantages of each, in terms of flexibility, speed, storage capacity, resolution, cost, equipment amortization through use for other functions,..? How does the choice of storage medium and playback mechanism interact with the basic design of the animation computer?
How do we augment the sensual dimension of interactive animation systems?
Currently, with GENESYS, the animator expresses his intuitive, bodily-sensed dynamics through a pen on a planar surface. Using a set of push-buttons, he can tap a rhythmical sequence directly into the computer. Animators at the Computer Image Corporation can jump and dance, while wearing a light harness, their dynamics being transmitted directly into the computer.
The future will likely see the use of pressure-sensors and grip-sensors in electronic paintbrushes, three-dimensional wands for drawing and sculpting directly in space, and a variety of new devices to facilitate the transmission of expressive body movements into expressive synthetic moving images.
The analogies between the synthesis of graphic variation through time, or animation, and the composition of music have long fascinated Alexeleff, McLaren, Whitney, and others. How can sound best be integrated with imagery, and how should this problem affect the design of future systems? Computer Image already directly drives figures into motion by music or recorded vocalizations. The computer animator of the future will use systems in which sound and visual components can be integrated from the very start of a movie, in which real-time playback will include both audio and video, in which graphs of picture change and of sound and music will be superimposed on the same time frame in a unified editing system, and in which music waveforms can be sketched along with graphic waveforms.
The past five years has seen flurried activity in the building of systems for building interactive graphics systems. Early efforts explored alternative data structures for representing synthetic line drawings, and embedded minimal sets of display calls in available high-level languages. More promising directions have emerged in later years. Richer languages for describing structured data and user interaction have been embedded in high-level languages. Comprehensive methodologies for the design of interactive graphic systems have been developed.
Everyone is understandably eager to attain a critical mass for film making. Consequently, the design of written languages for expressing animation has not flourished into new directions. The same paths are retread again and again, without noticeable trends towards standardization. Standardization now would be premature, but careful analysis and language comparison should be undertaken. The embedding of the interesting and pioneering BEFLIX in FORTRAN is valuable for it will now be more accessible. Yet FORTRAN is archaic, and future embeddings of any animation language should begin with a base that has more powerful control and data structures, and more flexible and forgiving I/O. Let's not further propagate the obsolescence of rigid, card-oriented, format.
Even less work has been directed towards the development of graphical interactive languages. GENESYS is based on a concrete philosophy of pictorial animation languages, consisting of both static images and real-time actions (user-driven animation), but its current command set is ad-hoc and the implementation shoddy. Other efforts, such as those of Ohio State, IBM, and Information Concepts, have begun. The Computer Image approach is totally different - what is the language of user actions at a Computer Image console?
What is needed, I believe, are some fresh ideas, a thorough rethinking and reformulation of fundamental concepts for describing images and animator actions, and perhaps a touch of formalization. The concepts of conversational languages, extensible languages and picture grammars provide some new directions that I think will be of assistance.
A conversational language is one in which each user command is directly interpreted and either executed immediately or incorporated as part of a new procedure under construction. Conversationality enables one to enlarge the capabilities of a system with the same language in which he uses it. The concepts of language extensibility and picture grammar are closely linked. Both provide mechanisms for building complex structures out of primitive elements, and for testing if candidate objects possess a particular kind of complex structure. A picture structure defined by a grammar is a class of pictures that satisfy certain constraints, hence a language for defining picture structures is a powerful picture construction and description language.
I propose that we strongly pursue the development of extensible, conversational animation languages. (APPL, in my dissertation, is an effort in this direction, but is as yet unimplemented. Other cuts at language definition need to be made.) Pictures and interaction primitives must be carefully chosen; powerful mechanisms for extension must allow the definition of complex picture types and classes of animator actions. Equivalences between written (linear) and graphical (2 or 3 dimensions plus time) representations need to be developed. (One valuable by-product of such equivalences will be discussed below under systems.) The resulting language will be usable both for building interactive animation systems and for expressing animation.
One particular software feature deserves special mention. In working with GENESYS over an extended period, Lynn Smith has generated and filed away large collections of static images and dynamic descriptions, despite the Stone-Age tools she had for doing this. The library, data management function of an animation system, the facilities for naming, renaming, referencing, aggregating, and disaggregating, must be carefully integrated into any new system design.
I should like to subject the above viewpoint towards animation system software to critique from the panel, and solicit, from the audience as well as the panel, alternative views. To evaluate an approach we ask such questions as - Will it facilitate the description and generation of rich image graphics, the provision of powerful means of dynamically varying an image, the ability hierarchically to build complex images out of simple images, complex movements and rhythms out of simple movements and rhythms, and the provision of flexible, responsive service to the user. The final test, of course, is its demonstrated use in the building of a more elegant interactive animation system.
Systems built to date have been highly specialized. We already noted the diversity of current computer image styles, and posed the problem of realizing such diverse graphics in a single system. Should we reverse the trend towards specialization in other aspects of system development? What interactive capabilities do systems for making physics, or math, or biology teaching films require? Would algorithmic, or procedural, capabilities aid artists using systems such as GENESYS? What kinds of capabilities? Can we and should we build systems strong along all five dimensions - graphic, dynamic, sensual, structured, and immediate? This will not be easy, for the demands appear to conflict - bodily interaction versus formal interaction, graphic and structural complexity versus the immediacy that is facilitated by simple graphics, dynamics, and organization. Can we afford systems strong along all five dimensions?
Insofar as images are simple, or picture change is trivial or random or predictable or easily calculable, demands upon the quality and quantity of interaction can be relaxed. I should like to see an animation system that provides an array of interactive capabilities along all five dimensions, yet allows the animator to use and pay for only that subset of capabilities needed for a given application. How may this goal be achieved? Can animation systems be time-shared? What implications does this goal have for system design? For selection of a hardware configuration? For software design?
How do we make existent or planned animation resources more accessible to those who cannot afford their own? The concept of computer networks seems relevant here. Even though adequate bandwidth along all five dimensions cannot be realized through today's networks, animation can be roughed in, and only in the final stages need the animator visit the host computer to complete the film. It is therefore essential that an animation data base be modifiable from a variety of subsystems and a variety of terminals, and that we better understand the relationship of written and graphical languages, so they can be used more interchangeably. The power of the display terminal is a particularly critical cost factor; hence flexibility in its choice is desirable. Is such a concept of resource sharing viable for computer animation? Alternative concepts are solicited.
In conclusion, I solicit comments about the interplay of animator, film producer or director, system builder, and system resources, software and hardware. I shall make three brief remarks: Computer animation systems will increasingly challenge animators and film-makers to explore new vistas of dynamic graphics. As the demands of animator and filmmaker become both more free and more rich, an animation system builder and the system resources will be increasingly challenged to improve the flexibility and responsiveness of the service. Finally, I predict that as a number of individuals use and extend a computer animation base system of the future, these will evolve, symbiotically, towards a number of personalized systems oriented towards and responding to the needs of those individuals, personal animation-machines, true extensions of man.
The mind boggles. But much is still to be done.
A definition of real-time might be attempted, however, certain difficulties arise since there are few good examples one can refer to. Technical explanations are relatively simple but to convey the experience of a new application is quite another matter. Recently at the 1970 Spring Joint Computer Conference the Evans and Sutherland Corporation demonstrated several real-time computer programs on their graphic console. One such program is a simulation of an aircraft taking off and landing on an aircraft carrier. The user can graphically fly his aircraft in a real-time environment communicating with the program through an electronic tablet and light pen. He can make changes in the elevation of the movement of the aircraft as the event occurs in time. He has the visual representation of these relationships on the oscilloscope as if it were a real physical event of flying the aircraft. To the observer it appears as if the user takes off in his aircraft from the aircraft carrier and the program shrinks the carrier's size and tilts the horizon line depending upon the user's maneuvers. What the observer does not usually appreciate are the utility routines and the perspective program and the clipping divider program which handle the transformations. A very dynamic and interactive mode of communication is offered in which one can test out maneuvers and experiment with alternatives without serious consequences.
In our real-time system at Ohio State the user can draw images on the CRT or he can use mathematically generated images for film animation. Not only do his images move in real-time but the images can be controlled as they move with the light pen and switches and buttons on the function keyboard. An artist can draw key frames for an animation sequence and a computer program fills in the additional drawings required to make the images move. To control speed one can adjust switches on the function keyboard which represent different rates of speed, and the moving images instantaneously speed up or slow down. The axis of rotation of a moving drawing can be adjusted through the function keys and light pen. The size of a moving drawing can be changed by pressing a function key to reduce the size of the drawing while another function key is used to increase its size. These function keys are programmed to behave like potentiometers. With the light pen one can draw the path they wish the drawing to follow, and as soon as the path is completed and one presses a function key, the drawing moves at motion picture speed. Several drawings can be displayed simultaneously on the CRT and the user has independent control over the path, the speed of movement about the path, and the size of each drawing. By pressing keys on the 2250 keyboard that represent x, y, z, directions, a software joystick can be used to control the path of 3D drawings. For instance, a 3D drawing representing a turtle can be walked in real-time throughout three dimensional space. The animator also has independent control over the movement of the turtle's head, the tail, and each of the four legs in real-time. Alphanumeric characters for words and sentences can be typed in through the 2250 keyboard, and as soon as the word or sentence is typed, the light pen can be used to sketch the path, and then the word will move about the path. Essentially in our real-time environment the user can fly, walk or model his drawings through two and three dimensional space.
At the risk of being redundant this concept of real-time might be described in the following way to artists and film makers. The process of creating images which we have just described involves an exciting new concept of time. Essentially the computer is only programmed so that it can respond to the decisions of the artist about the image and its movement. Then whatever the artist decided to do is transmitted almost instantaneously to the screen. This allows for a full interaction between the artist and his images. It occurs in what we call real-time, that is, time which is real because the moment of the artistic idea is also the moment of its materialization. This is a revolutionary idea in film-making, rather like editing the film before it is made. It makes the creative process a very spontaneous thing, for all the problems of execution are solved in advance. It is also by no means as mechanical as it might seem, for different artists will produce a variety of images and different relationships between images to portray their concept of reality.
In a real-time environment there are limitations as to the number of transformations that can be linked together before the real-time display is lost. Even with a sophisticated use of a compound transformation, and special approaches to the relationships between transformations and data structures, the computer's storage size and cycle speed, with its word length and instruction set, will impose additional constraints.
One of our concerns is not only one of developing new tools or options in graphics but how does the non-specialist use them in a natural way. Perhaps the question might be stated in the following manner. How can computer graphic tools involving chains or links of transformations be integrated for real-time animation so that the user can be involved in a spontaneous and interactive mode of communication to generate animated film sequences? Here one would hope to minimize the delays in response time and the computer programs organized in such a way that the user can give his full attention to the concepts and ideas he wishes to illustrate.
An example of the difficulties one can encounter with a rigid relationship between computer programs for real-time animation is as follows. The user has available to him the following programs that may represent only a small fraction of a graphics software package. (1) A 3D rotation program which handles hidden line removal {the data described as edges and intersecting planes) and which simultaneously handles straight line path zoom effects, as images are moving in real-time. (2) A 3D rotation program which handle hidden point removal (the logical structure of the data is a description of surfaces as points) and it has a software joystick and also the option to draw curves on the CRT with the light pen which can represent the zoom path of data. If the user wants the data described as edges and intersecting planes in program (1), and only the software joystick to control its movement from program (2), another new program will need to be written by a programmer to accommodate a new relationship between these routines. The solution to this problem may be a simple one but it is an inefficient approach and the storage space and speed of the computer system can soon be exhausted. Each user in the computer film animation environment has a different need and an approach is highly desirable which offers flexibility and new options and one which is not programmer dependent.
An alternative to the preceding approach is to treat the transformations as discrete units or modules. Conceptually, at one level they would appear to the user as items on a shelf or as a menu that he could string together as a chain of transformations. There would be a discrete unit for 3D to 2D or 2D to 3D data conversion, straight line zoom, drawn curve zoom, joystick, random walk, hidden line program, hidden surface program, scaling, 3D rotation, data conversion of hidden surface and hidden line, and many other units. At another and more important level transformations might be treated as building blocks by the user to formulate new transformations. A modular approach to computer programming is not new and it may appear simplistic but in real-time animation there are a number of special considerations. These considerations involve the relationship between data structures, transformations, and data management, and storage allocation.
The following example might illustrate a more complex problem for real-time animation and it is one which we have solved with software. Let us use as a data deck, a line drawing representation (x, y, z, coordinates) of a helicopter. The helicopter has two rotors, one for the main assembly section and another one on the tail section. We have a 3D rotation program which has as part of its structure, transformations to change the axis and the center of rotation of the helicopter. The problem is to make the helicopter move on the CRT and the computer must calculate and display pictures at a rate fast and smooth enough to appear to the user as a motion picture or video film. It should appear to move about an axis of rotation and the effect is as if the helicopter is moving in perspective about the path of an ellipse. While it is moving about this path each rotor is to move at a different speed in relationship to the helicopter itself. Then in addition, hidden lines are to be removed as the helicopter is changing its position in relationship to the user of the program. The user should be able to communicate to the program with a light pen and function keyboard to immediately change the speed of the helicopter's movement and the speed of each of the rotors. He can at any stage change the axis of rotation of the helicopter or even draw a new path.
In this example, let us give our attention to the most important problems and perhaps set aside a number of minor details about programming in a real-time environment. For instance, the transformations involved in a 3D rotation program are important but not the issue at the moment. Neither are the utility routines which handle the interrupts through the light pen or the function keyboard. There are a number of questions we must ask ourselves. (1) How do we define the data structure so that the program can recognize the helicopter as a whole and the individual rotors as data? (2) Once a transformation is developed to move the helicopter, how is another transformation introduced which will take into account that the helicopter is already moving at some rate of speed constantly changing its location, but now the main rotor must move at another rate of speed? (3) How do we link the transformation to the data structure and other transformations which will look at the main assembly that is moving and at the same time have another speed for the tail rotor? (4) While we are dealing with three motion variables, how can hidden lines be removed as the helicopter is changing its position? (5) How do these transformations look at the data structures to recognize the helicopter, main assembly and tail, main assembly rotor, and tail rotor? How does one set up the pointers to recognize data and establish the appropriate links between the transformations? At the same time, how does one allocate space for programs and data and move them in and out of the computer's core memory fast enough to provide a real-time display?
Algorithms to solve the hidden line problem in a batch processing environment have been in existence for several years. Most of them have been written in a higher level language such as FORTRAN. The calculation time for one view of an object may vary from 30 seconds to several minutes depending upon the complexity of the object and the efficiency of the algorithm - one would assume access to a high speed computer. If the programmer could reduce the calculation time from seven minutes to two minutes, he would naturally be enthusiastic about the improvement. There are differences in the algorithms used by researchers Bouknight, Warnock, and Loutrel. Although these are excellent solutions to the hidden line problem, they do not seem fast enough as solutions to produce a real-time hidden line display (the convex case), at least on 32K machines with medium speed core.
At Ohio State on our 1130/2250 system we have a real-time hidden line program which can handle the convex case (600 edges). In the process of doing an analysis of the hidden line problem, we discovered some procedures which reduced the number of tests that had to be made with the data. Another significant factor in our real-time hidden line display involves an extremely fast three dimensional rotation program. Our hidden line routine is also fast enough to permit several drawings to be displayed simultaneously moving at different rates of speed, and at the same time each drawing has a different zoom path and zoom rate as hidden lines are removed. The technique and concept used for this rotation program coupled with an improved hidden line algorithm accounts for our success with real-time display. Our results were produced on a 32K machine with a 3.6 microsecond cycle time but the same techniques and concepts used on a machine such as the PDP10 with its greater speed and better instruction set would produce far more complex figures moving in real-time. It would be reasonable to expect that many figures in the concave case could be displayed in real-time on a PDP10 machine interfaced to an Evans and Sutherland graphics display processor.
Extensions or projected plans of our work into the hidden line problem include not only refinements on the convex case but solutions to the concave case which will make it possible for us to do the following type of animation sequence. It would probably not be possible for us to achieve this example in real-time but the display might move at stop action speed.
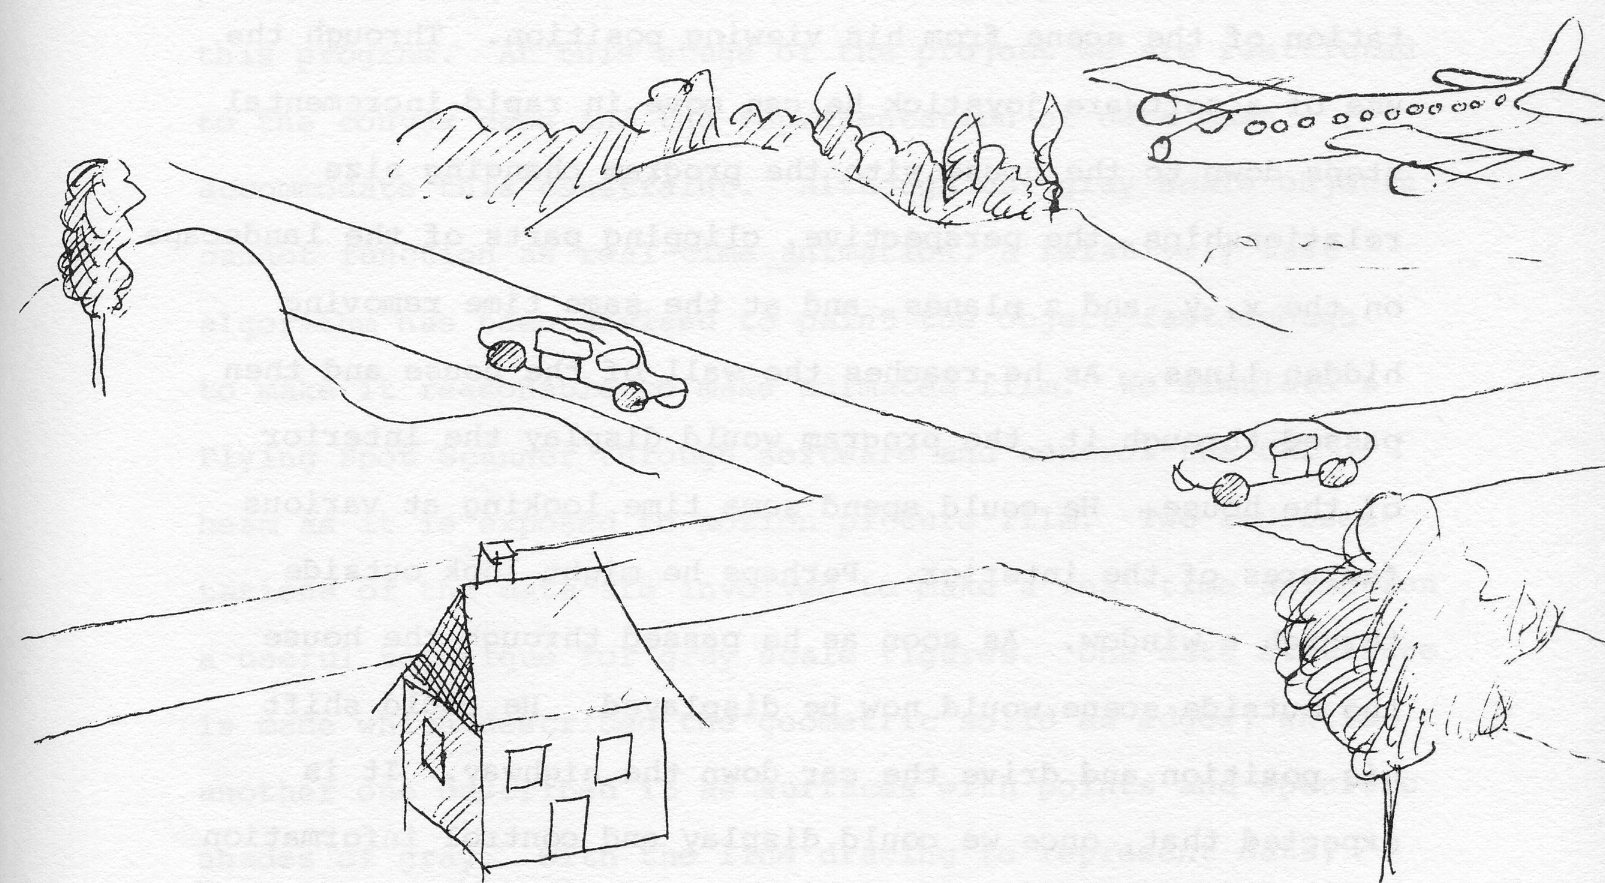
Under computer program control we would like to graphically move throughout this landscape. As the user communicates his position relative to the landscape, the program provides a display of his position at that location. The house, the two cars, and the airplane are three dimensional models which have a representation of their interior structure as well as their exterior structure. The user first adjusts with the light pen and function keyboard, the path and the speed of the two cars, and the airplane. Then he establishes a location x, y, z, coordinate in the scene from which he can view the scene. Let us assume, that he starts at a position several hundred feet above the ground level. Within a matter of seconds or less the CRT will display a representation of the scene from his viewing position. Through the use of a software joystick he can move in rapid incremental steps down to the house with the program changing size relationships, the perspective, clipping parts of the landscape on the x, y, and z planes, and at the same time removing hidden lines. As he reaches the wall of the house and then passed through it, the program would display the interior of the house. He could spend some time looking at various features of the interior. Perhaps he might look outside through a window. As soon as he passed through the house the outside scene would now be displayed. He could shift his position and drive the car down the highway. It is expected that, once we could display and control information at that level, the computer program could have addition options of a multiple point light source to provide gray scale representations and also to indicate the translucent and opaque appearance of surfaces depending upon the user's viewing angle.
The 2250 display has only one intensity level. In order for us to do gray scale representations of solid objects, a point density subroutine was written to achieve the variations of gray. The spacing of points on a given face of a geometric solid determines the shade of gray. Data structures were defined to have a logical description of surfaces as points. A solution to the hidden surface problem is part of this program. At this stage of the project we are restricted to the convex case and the representation of data must accommodate this constraint. Although our gray scale objects cannot function as real-time animation, a relatively fast algorithm has been devised to paint the object fast enough to make it reasonable to make animated film. We simulate a Flying Spot Scanner through software and control the CRT beam as it is exposed to motion picture film. Two representations of the data are involved to make a real-time animation a useful technique for gray scale figures. One data structure is made which described the geometric solid as edges, while another one described it as surfaces with points and specific shades of gray. With the line drawing to represent data, judgments can be made about the size, position, motion, and speed of the objects. Adjustments can easily be made in the real-time environment with those parameters. Such important decisions would be the precise path, size, speed, and time duration about the path. Then the values representing those parameters are used on the second data deck to make the final film sequence. The individual frames are painted in shades of gray fast enough to make stop action filming a feasible approach.
Our algorithm to write, points on the CRT representing geometric solids (convex) and simultaneously to do a double rotation while removing hidden surfaces, can display 225,000 points in less than 12 seconds. Once the first view is painted there is less than one second delay between the first view and the second view. It seems reasonable for us to make short sequences of gray scale motion picture of figures which can be represented by 75,000 - 100,000 points. Here one would have a new frame every 5 or 6 seconds.
Interactive graphic displays for real-time film animation and model simulation can be a dynamic and productive process for the user. The computer programming requirements to support and extend the capabilities of such a system is a sophisticated problem which involves basic research in computer graphics. The frontiers of research into the relationship between man and machine, as it is applied to interactive graphic display systems, indicates that additional modes of communication might be brought to bear upon this problem. New relationships between man and machine could involve a more total sensory-electronic communication system. They could influence his definitions of problems and how these problems could be solved. All of these modes of communication include special purpose electronic hardware and the appropriate computer programs to implement them. (1) Visual communication systems which involve the user's eye and body movements offer some interesting possibilities. Ivan Sutherland's video helmet for 3D perception of computer generated images in a real-time system is one example. Another possibility makes use of a special optical headgear electronically connected to the computer which scans the user's eye movements. At The Ohio State University a major research project (1966-1969) did research in eye movement studies on subjects as they watched commercial television programs. The subjects wore a head mounted electronically operated optical system which tracked their eye movements and these eye movements were recorded on video tape and then analysed. Manfred Knemeyer, my research associate, designed the electronic system for the eye movement studies and he also wrote the computer programs which did the analysis of their data. It seems reasonable to us to electronically wire the human so that he could communicate to the computer with his eye movements, information about the path, the speed, and even the size of the drawings displayed upon the CRT screen. Additional visual commands or instructions could be devised as a visual code to communicate to the computer program. (2) Computers that can recognize human speech are not as yet practical but there is evidence to suggest such a mode of communication may soon be a reality. This method of communication may initially be confined to simple commands, to control a graphic display but the potential for a more complex relationship between the human and the machine is an exciting prospect. (3) A tactile-kinesthetic mode of communication with a computer may seem somewhat bizarre but there is research already moving in that direction at Bell Telephone Laboratories, and at The University of North Carolina. The potential for form generation, form manipulation, and form perception is a promising area to investigate.
In the man and machine communication problem as it applies to visual representation by computer different modes of communication need to be examined to improve the quality of this relationship. Concepts about computer equipment design and the need for better communication systems are already emerging in the technology. With the advent of such a communication system (visual, tactile-kinesthetic, and verbal) basic questions of language description about a problem and problem definition itself are still difficult ones to resolve. In fact, additional modes of communication might further complicate these questions, at least, if one continues to use conventional approaches to data structure definition and linkages to transformations, data management, and the structure of transformations. However, these modes of communication and the ideas they will stimulate may well provide the conceptual breakthroughs that can make the computer process a more dynamic one.
In many ways the computer simulation of pertinent information from the real world is still an art and not a science. The effectiveness of any simulation rests on the human simulator's ability to abstract only those factors that affect the system or process he wishes to duplicate. Our research in computer graphics for real-time film animation, especially our success with the helicopter problem which involved a compound transformation, suggests that we may be able to develop additional computer graphic tools to deal with simulation models. It may be an ambitious goal but it is certainly a highly desirable goal, to expect that computer technology may be able to provide the appropriate tools to allow the scientist, the educator, and the artist to simulate their models of reality.
One of the reasons that computer animation excites me is because I feel it has the potential for becoming an important tool of the intellect. As science has matured, observation and deduction have grown more indirect. Nowadays one seldom uses ones primary senses, such as seeing, hearing or feeling, to make direct observations. Rather, instruments such as microscopes, spectrophotometers, oscilloscopes, bubble chambers and radio-telescopes apprehend phenomena that lie outside the range of human perception and translate them into a time scale and a sensory medium appropriate for human consumption. Theories have become richer and more complex as they attempt to describe symbolically the dynamics of complex systems. In fact, the inherent complexity of systems may be the single most important barrier to advanced scientific understanding in the latter half of this century. This is probably true in the life sciences, in computer science and in the social sciences, and may even be true of many industrial situations as the big northeast power blackout of a few years ago seems to illustrate. We must find ways of dealing with complexity and of rendering the behavior of complex systems intelligible in order that complex systems be made to serve man rather than man becoming the servant of the complex systems he creates. To what degree is man the master and to what degree is he the servant of his transportation systems, economic systems, industrial systems and the ecological system of the entire planet?
It is in helping to render the behavior of complex systems intelligible that computer assisted animation has a largely unexplored potential. The computer can generate and present many species of visual images in many patterns and variations. But perhaps more important, it can translate sterile data into intuitively appealing pictures, it can change time scales and it can suppress details that impede understanding. Thus, like the oscilloscope, it becomes an instrument which transforms phenomena outside the range of human apprehension, into phenomena inside the range of human comprehension. But unlike the oscilloscope, the computer has a tantalizing potential for dealing with complex systems through its ability to be dynamically selective in what it looks at and to supply elegant translations of data unfit for human consumption into displays that are both palatable and revealing.
To give just one small example, suppose you are a biologist studying the effects of thermal and chemical pollution on a given local environment. You devise a set of 50 differential equations which express the population size of each species in the food chain in terms of the population size of other species in the food chain and in terms of some independent variables for thermal and chemical factors. Now how do you access the behavioral implications of your model under important sample conditions? You can try to do it by hand calculations, which is certainly tedious, and probably error-prone. You can write a computer program that prints reams of numbers for you to stare at, which is better. But if you really want to get a feel for the time dynamics of your model, for the rates of growth and decay, and for critical points at which the system will shift toward new equilibria, I know of no better idea than to animate it. Even a simple animation will do. For example, portray each species as a labelled circle whose area is proportional to the species population size. Drive the size of each circle off the differential equation for the population size of its associated species. Then choose an appropriate time scale, some initial conditions, set the beast in motion, and watch what happens. Your eye will be drawn to the place where action is happening and unusual or surprising implications of the model will be likely to draw your attention. Now vary the initial conditions and set the system in motion again and watch what happens. If your model is wrong you will be able to find out how it is wrong so that you can tune it. If your model is right and agrees with important sample data, you may even begin to understand ecology.
There are many other situations where watching the behavior of something dynamic is maybe a better way to aid understanding than is reading a static description. Not the least of these is in understanding how computer software works. Why not animate operating systems, assemblers, compilers and loaders to see how they work and to get a feeling for where they are spending their time?
So, to summarize, while computer animation has many well known uses in art, in education, in entertainment and elsewhere, one of the most exciting largely unexplored applications of it is as a tool to help render intelligible the behavior of complex systems and the behavioral implications of complex descriptions.
I now want to explore some of the purely technical computing issues connected with animation.
Animation involves the use of the dynamics of picture change through time to express behavior. Thus, in computer-assisted animation one is always recomputing pictures. If the animation is non-interactive and is played back off-line from a recording medium such as a film or a video tape, then the response time of the computer in generating new pictures is not an issue, especially since the rates of generation and playback can be different. But if the animation is either interactive or is non-interactive but still generated on-line. Then the computer should generate picture updates at a rate that satisfies the human appetite for information. Thus the response time of the computer in supplying updates becomes an issue. Few batch or remote job entry systems have turnaround times fast enough to supply picture updates for the interactive consumption. Thus, ones attention turns to the systems that provide fast response times, these being single user systems or time shared systems with conversational or interactive facilities. The essence of these systems is simply this: Response time is proportional to the demand for computation and, in particular, there is rapid response to trivial requests.
Hence, if you want to couple your graphic animation system to some background programming language L, in order to do the computations relevant to animating some particular subject area, a rule for choosing L could be: If you are animating offline L can be any language, but if you are animating on-line L must be such that programs written in it can interact with your animation graphics program and can provide rapid enough response time to satisfy your demand for picture update rates.
One has to question closely the need for interactive computer assisted animation. Must animation be conversational? Obviously, in the movies it isn't, and movies are good things. I feel that there are two important cases in which computer animation should be conversational.
The first is that conversational systems which provide rapid response to trivial requests permit one to evolve and modify a program at a very rapid pace. Many of the changes you make in writing and debugging a program are trivial. One should not have to wait four hours and be charged for recompiling ones program just to change one semicolon. For example, if you make a mistake in animating a man walking, and his feet slide over the background because he walks at the wrong rate, maybe all you need to change is one rate parameter. Conversational systems permit you to observe the misbehavior, to request a trivial change and have it rapidly satisfied, and immediately to set the program in motion again to check whether the new behavior is correct. One should not have to go through the whole cycle of updating a source file, compiling, loading, initializing and then setting up the proper routine circumstances in order to sense the behavioral implications of trivial change. Conversational programming languages are especially valuable in this context. They should be chosen for convenient symbiotic relations with an interactive graphic package.
The second case in which interactive computer animation systems are important is to satisfy applications where man must be in the loop to supply decisions about how the animation is to proceed. For example, in using animation as a tool to understand the workings of a complex dynamic system - man must be selective in deciding what to look at in the fire-hose of information and detail that the computer is capable of generating. That is man must set the time scale, the focus and the level of detail. Since man has changing interests that the machine can't predict, he must be in the loop to decide what to look at, to compress the uninteresting, to expand the interesting and to jump in and out of the hierarchy of detail depending on whether he is excited or bored. Conversational graphics systems and conversational programming languages are structured to permit just this sort of thing. They make special provision for writing programs that converse with users, that is, programs that request that information be supplied by the user at certain points, and which use this information to determine their subsequent course of action. Thus, if interaction is important you should choose languages that permit one to express interactive algorithms with ease. The conversational programming languages thus become natural candidates for marriage with interactive computer animation packages.
Extensible languages directly concern the representational power of the medium in which animation-related computations get done. The principal contribution of extensible languages at the moment is in the realm of data definitions, but projected developments indicate a contribution in the area of control structures as well. The prototype extensible languages are in the cycle of construction and experimentation so it will be a while before they are available as commercial products. Here, as elsewhere, the lead time from conception to smooth application can be long. For example, transistors took ten years, and APL, which is a language of great beauty, took seven years.
Extensible languages help us in being flexible with respect to data, and data flexibility is important because it is related to the capacity of a representation to sustain variation.
In animation, we have to specify which parts of a picture are variable and how they are to vary. Do they change position, color, texture, size, orientation, shape or what? Do they move, and if so how continuously or discretely, and at what rate? So the decision about what shall be variable and how it shall vary in a picture implies a need for a data structure flexible enough to represent the set of possible variations. In reference to extensible languages, what we are really speaking about is a difference in scale and convenience in the effort required to set up new data structures. i.e. does it take six months of arduous programming in machine language to get the data representations you want, or does it take a few data definitions and three days of polishing to get going? And what happens if you want to change your mind. These are the issues that extensible languages address, and my own experience with a prototype language we have running in our laboratory indicates that a pleasant improvement in programming convenience is in store for those who graduate to extensible languages, particularly the conversational ones.
For example, six years ago three colleagues and I spent eight man years implementing a compiler for Formula Algol. This year one of my students was able to do all of the formula manipulation we did in Formula Algol one week in a prototype conversational extensible language he implemented as a student project in six months.
So if you are going to build a non-interactive animation package consider marrying it to either an extensible language or a low level list processing language like Knowlton's L6, and if you are going to build an interactive animation package, consider marrying it to a conversational extensible language, because having representational flexibility pays off.
Among other possibilities scan conversation, video discs and off-line refreshing give us a technique for flicker-free sharing of a computer resource that generates different pictures for each of many users. The question then boils down to a matter of dynamics - i.e. the rate at which the picture or its parts is being recomputed. This depends on the response-time of the computer for various amounts of computation. Additionally,, in the case or networking, band width and operating system service times may enter in. One should probably not count on getting updates fast enough to fashion continuous motion for sustained time intervals, but discrete picture changes every so often appear quite feasible. It is still possible to have an animation style without continuous motion of images, but the motion-related sensual qualities of the medium probably have to be sacrificed.
ACIANS is an Artist-Computer Interactive Animation System for the creation of animated cartoons. Interactively, the artist is able to draw freehand, fill in areas, edit and review an animation sequence. This paper describes additions to the system which include: the implementation of panning at any specified angle a frame or cel, automatic reviewing of the panned sequence with an option to save the sequence, meshing (superimposing) of specified cels, and copying of any cel (or a part of) to any cel (or a part of) The paper describes these additions as well as user experience. A film will exemplify the additional features of the system.
ACIANS was initially developed to produce cartoons on outdoor display boards. It utilizes methods analogous to conventional animation production and thus has evolved into a general purpose animation system. The necessity of dealing with areas rather than lines led to a point-oriented system in which all of the algorithms manipulate individual points or groups of points rather than vectors. The provisions to work with areas, to vary the dimensions of the final display, and to vary the resolution of the display make it suitable for the production of output for various media, including film and display boards. As such, it serves the basic needs of cartoonists and educators and may also be used to create storyboards.
ACIANS allows the artist to interact with the IBM 1130 computer. As the artist draws freehand on a Sylvania data tablet, the results of his drawing and control information are displayed in front of him on an IBM 2250 display unit. Functions to be performed are selected by pressing the appropriate button on the program function keyboard. Control information is modified by using the light pen of the display unit. The artist may draw in any one of four layers which are maintained in core and may file his work in the layer library, the frame library or, once a scene is complete, in the scene library, all of which are stored on IBM 2315 disk. The layers, synonymous to cel levels, are divided into sections which may be manipulated independent of the rest of the layer. The major functions of the system include initializing the drawing area to white or black, drawing in white or black, erasing (a function which, in addition, restores the selected background), copying, translating layers, meshing layers, filing and retrieving, and reviewing. The basic structure and functions of the system are fully described in another paper[1, 2].
The size of the display area, which in turn defines the drawing area, is specified by the user when beginning an animation sequence. The user can place an animator's field guide on the registration peg bar attached to the data tablet and select the field he desires or he can arbitrarily select sizes and experiment until a desired size is reached.
Once the size is selected, the system segments the display area into vertical sections, allocates core accordingly and upon request formats the libraries on disk. Segmentation of the display area allows the user to select a display size that is wider than the physical screen. The system automatically scales down the sections to display all of them at once, but drawing may be done in only two sections at a time. Any combination of two sections, contiguous or noncontiguous, may be worked in at a particular time, e.g., sections 2 and 3 or 2 and 4. Thus, the requirement of drawing on split sections, a disadvantage of our first system, has been eliminated. In most cases (other than large display boards) a display area composed of two sections is chosen. For example, figure 1b is roughly a standard ten field.
Previous experience with this system has shown that a finer resolution is desired for film work. Therefore, a facility for two different resolutions was developed. The resolution is selected by the user at the beginning of the animation sequence.
The resolution used in the original system is sufficient for outdoor display boards in lights and was used this past spring to create cartoons for the Oakland Coliseum display board (Fig. 1a). When this resolution is selected, each bulb or point maps into a 6 × 6 raster unit square on the CRT and data tablet. (A raster is 1/85 inch). The resolution developed for film work is twice as fine and thus uses a 3 × 3 raster unit square for each point of a drawing displayed on the CRT (Cathode Ray Tube). At this resolution, normal handwriting can be read from the tablet and clearly displayed (Fig. 1b). If detail is important, as in certain educational and artistic films, this resolution is required (Fig. 1c).
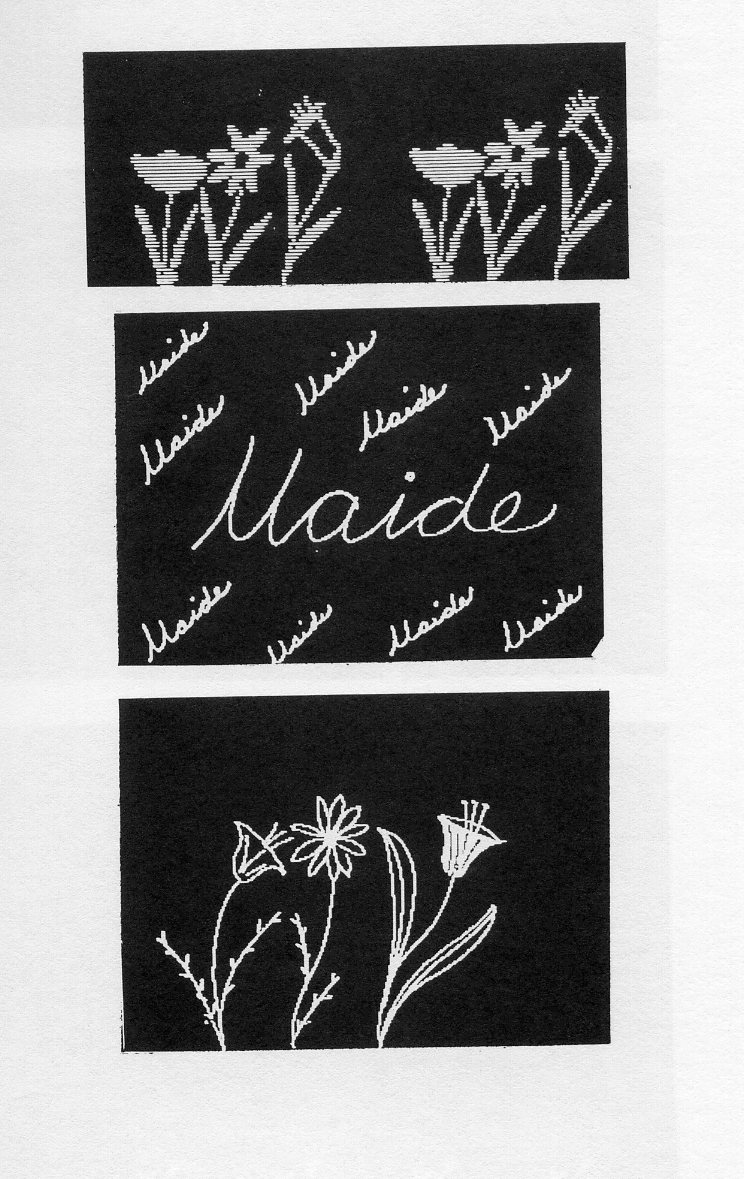
However, there are several disadvantages to working in this finer resolution. The user must draw white on black because the flicker of the opposite case becomes too disturbing for the human eye. Of course, once the drawing is completed, the colors can be reversed or reversal film can be used. There is also a need for automatic fill-in of areas. [3] Since the resolution is finer, the number of scrub motions with the pen needed to fill in an area increases by a factor of four. In addition, the largest size of a frame is limited to 630 × 864 rasters, although this is quite suitable for 35 mm film work. A larger size exceeds the upper bounds of core (32K - 16 bit words) and of disk (half million words) unless multiple drives are used.
Our impression is that a resolution halfway between the two resolutions might be quite adequate for film work. Such a resolution would reduce the flicker and provide more core and auxiliary storage. However, an automatic fill-in capability is highly desirable in any case.
The copy function provides some capabilities not available in conventional animation. The user may copy any layer into any other layer, copy any section into any section (a part of a layer defined by the system at initialization) in the same layer or in another layer, or copy a layer into another layer and specify it as a background for that layer.
The copy function thus allows the user to duplicate any layer or to save a layer in core which might be destroyed by the mesh function (Refer to Mesh). The ability to copy sections provides a tool for creating repetitive backgrounds or layers easily and quickly. In figure 2, a garden of flowers was created by drawing three flowers in the leftmost section and copying that to form two sections, then copying the two sections to create four sections. A crowd of people may be created in a similar manner by drawing only three or four persons (Fig. 3c). To remove the appearance of repetition, the drawing functions may be used to modify one section; that modified section may, of course, be copied into another section to vary the effect even more (Fig. 3d). A reverse function which operates on sections or layers can interchange black and white to provide more variation and interesting effects (Fig. 3a, 3b).
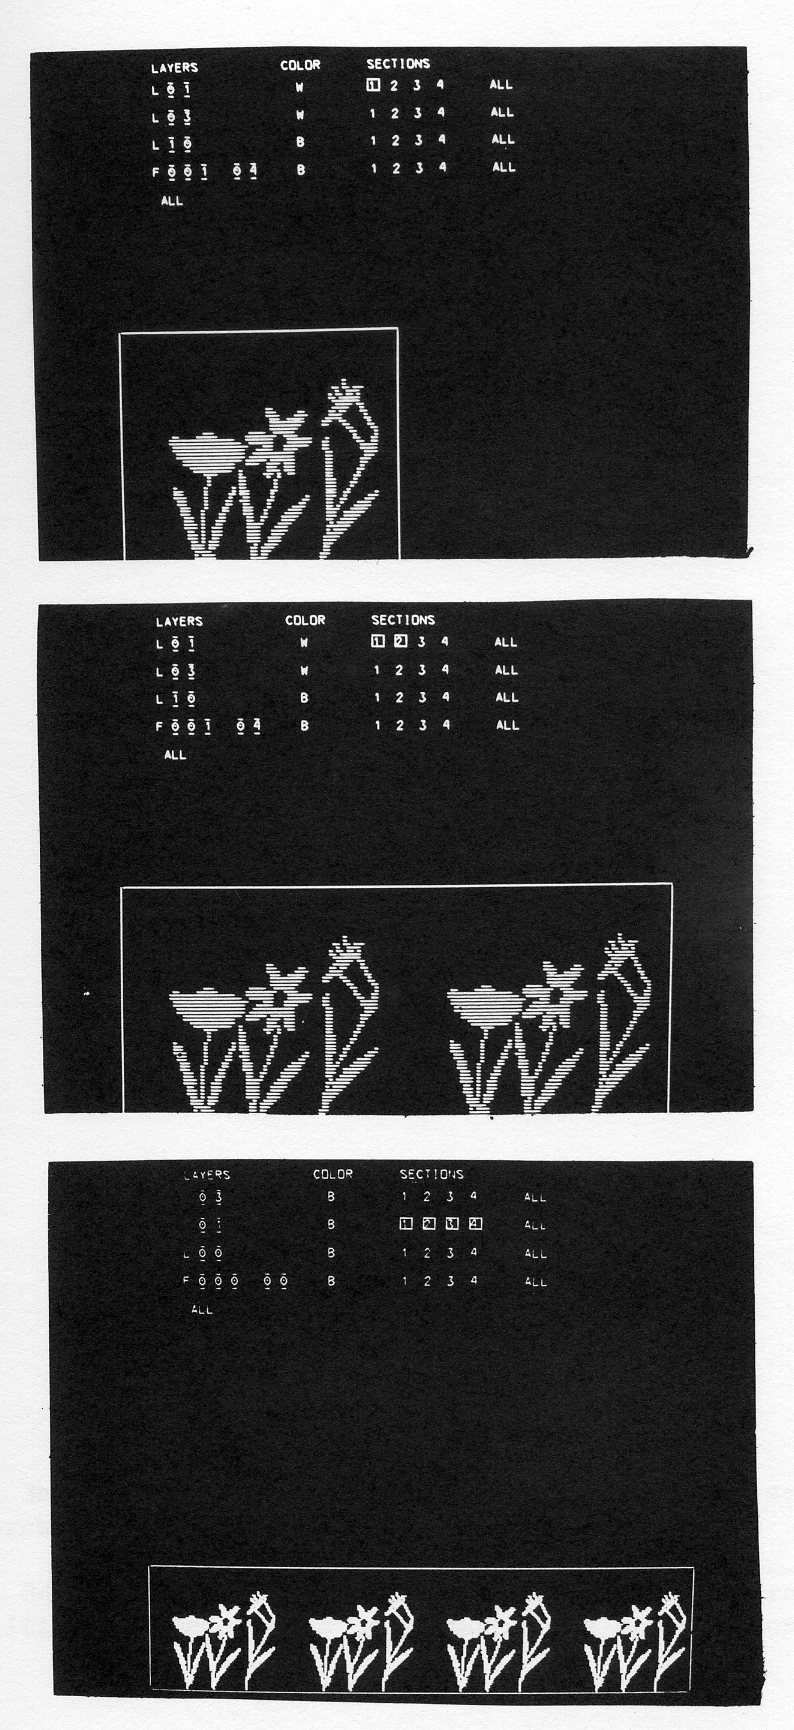
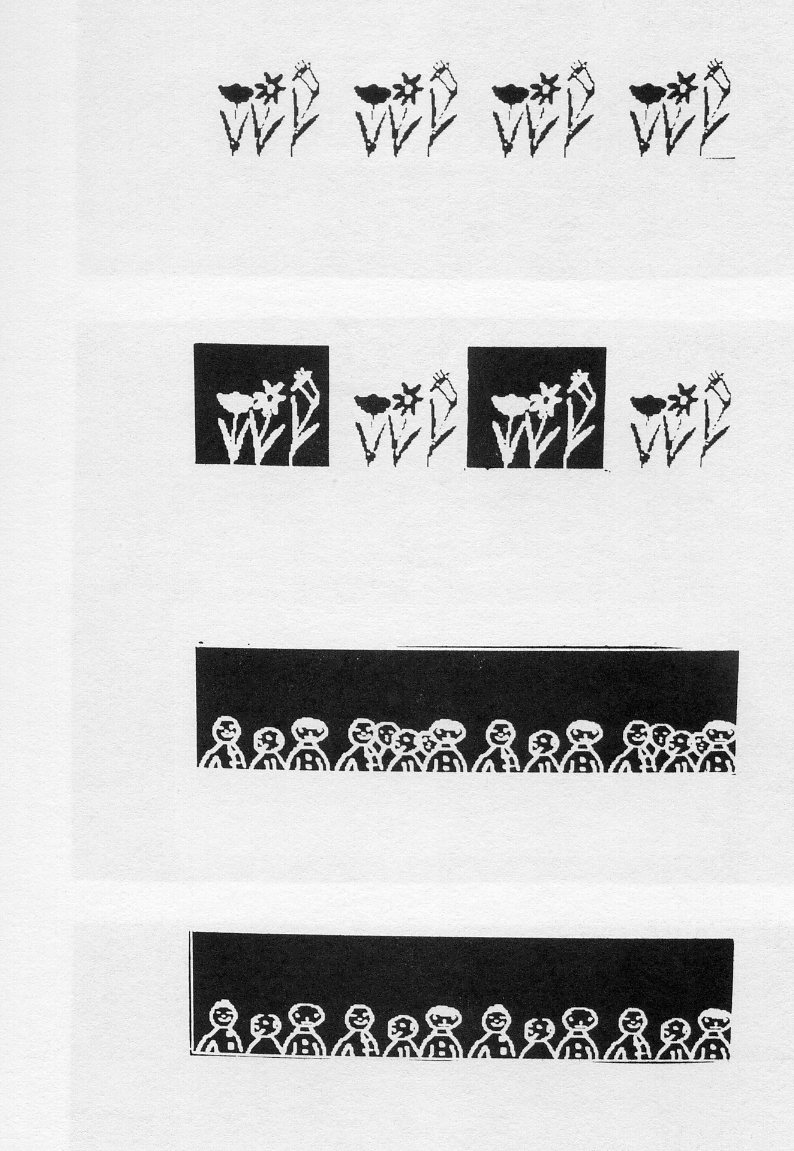
Registration of a background and foreground is performed by the copy background facility. This facility copies one layer into another layer and identifies the source layer as a background layer. The artist can then draw in the foreground layer without affecting the specified background unless desired. Whenever the erase function is activated, the background will be restored to the foreground layer in the areas erased with the drawing stylus.
Once several cels have been created by drawing on separate layers, the ability to mesh these cels (layers) into a single frame is desired. This function may be thought of as simulating the placing of animation cels one behind the other to form a single frame.
A predominant color (either white or black) is selected by the user for each layer. The predominant color of the top layer of each pair controls the mapping at each stage. When black is the predominant color, a logical AND operation is performed. In figure 4, the white triangle is the lower layer and the black circle is the upper layer; note that the predominant color is black. The meshed result (the bottom photograph) leaves the corners of the triangle which are not obscured by the circle on a black background. This result was placed in the upper layer and displayed on the CRT. When white is the predominant color, a logical OR operation is performed. Figure 5 illustrates the meshed result (bottom photograph) using a black triangle on a white background and a white circle on a black background.
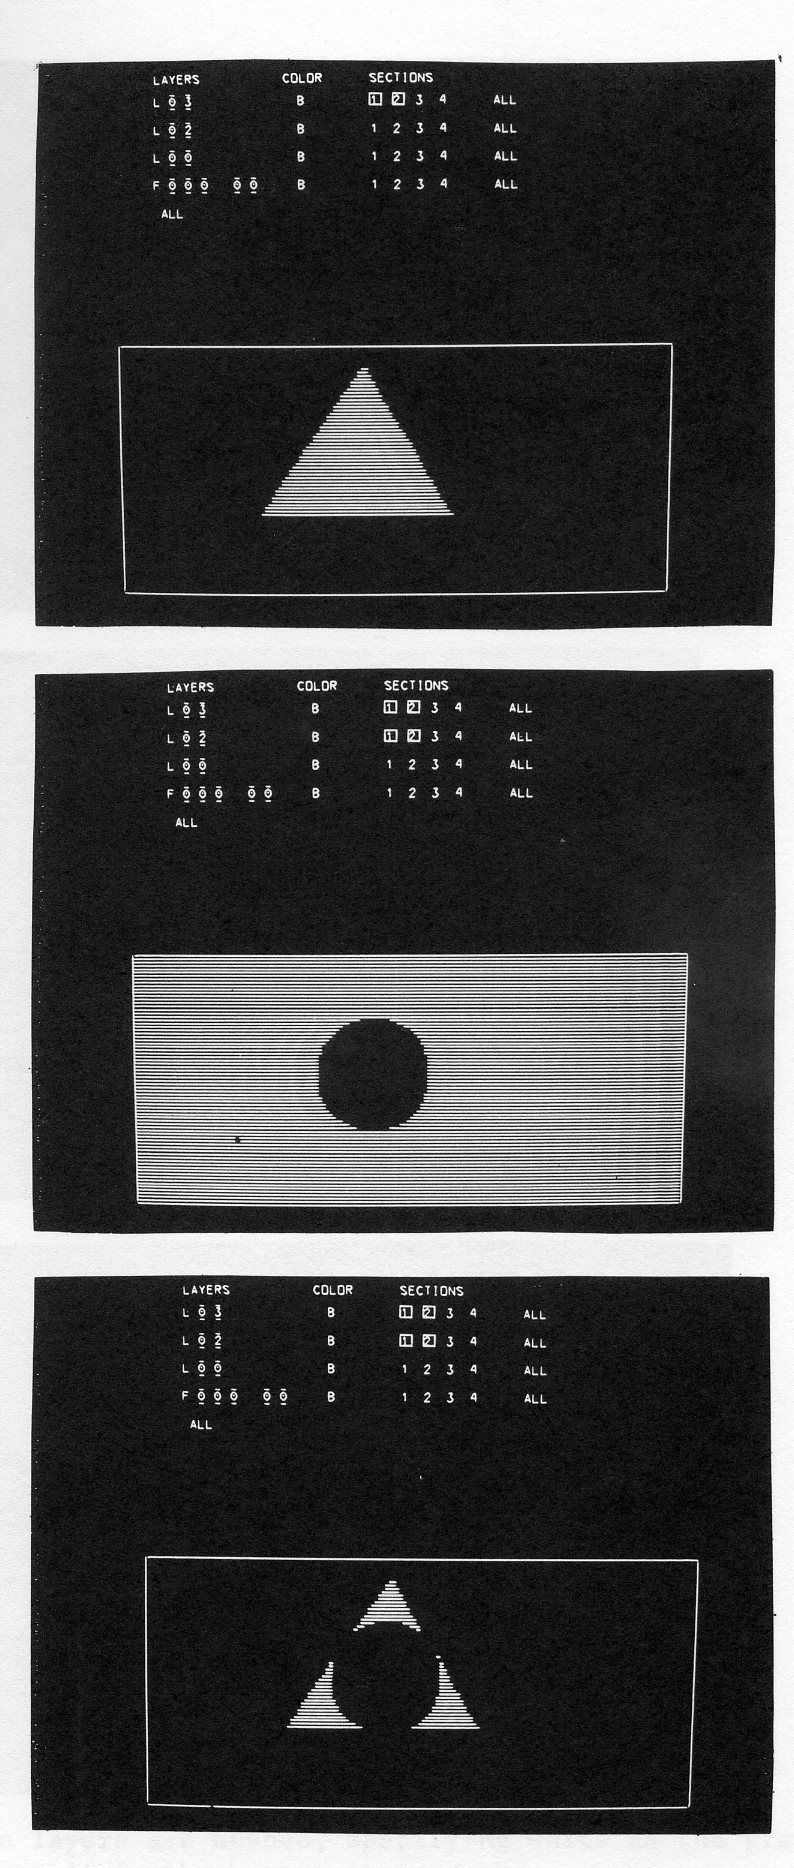
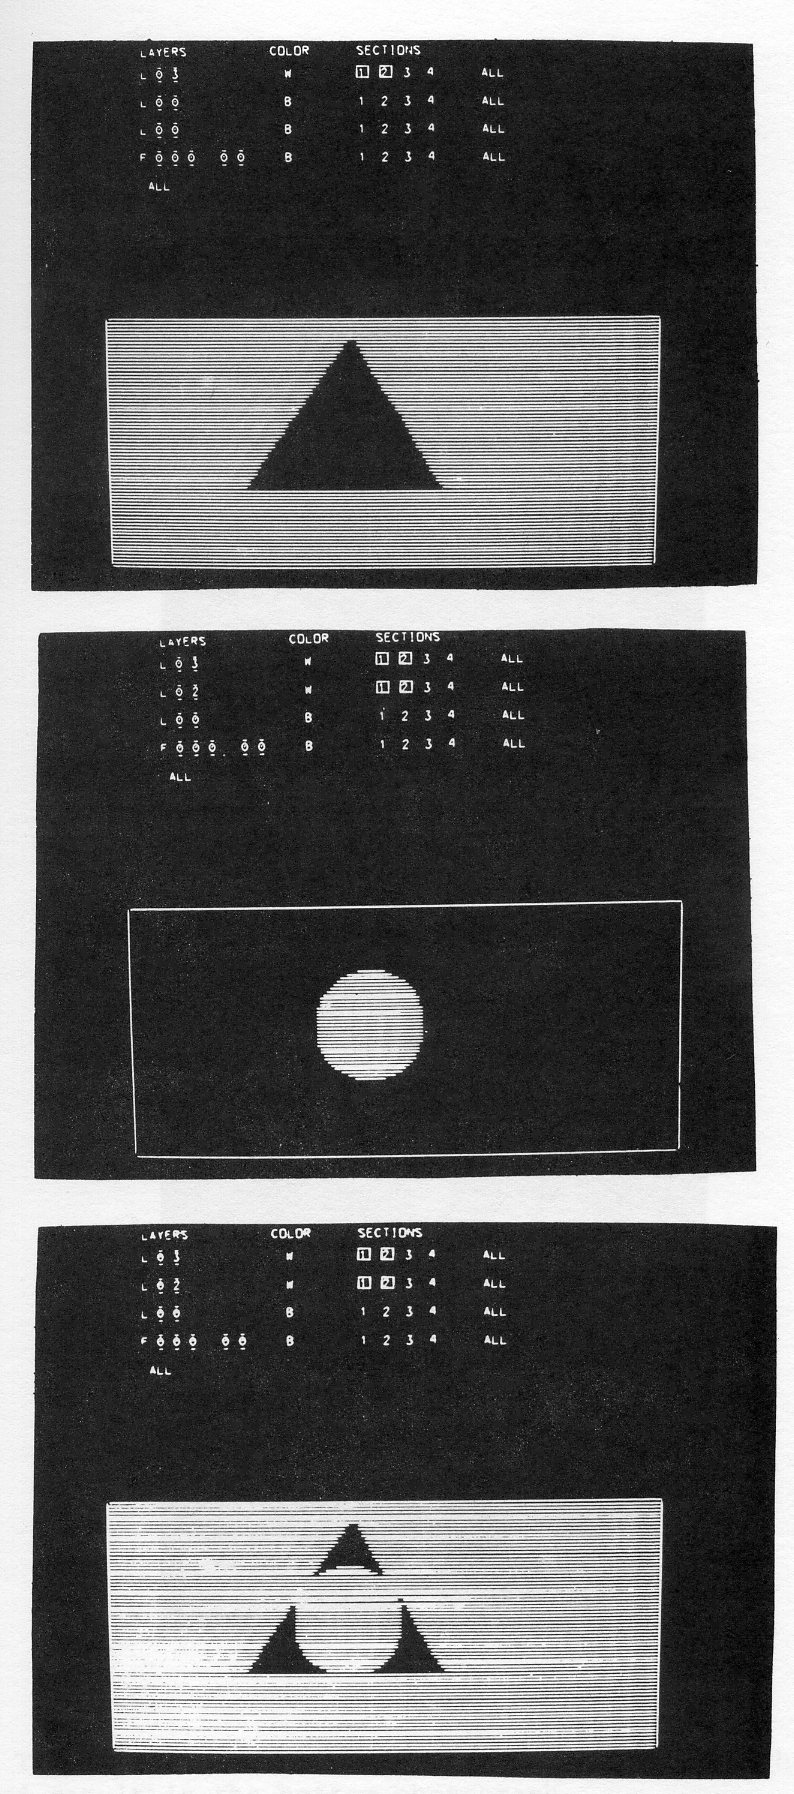
Any number of layers and any number of sections may be meshed by making the appropriate light pen selections on the control tableau of the CRT. Meshing is performed from the first to the last selected layer with the result placed in the last selected layer and displayed on the CRT. All layers, except the last, remain as they were before the function was requested. If more than two layers are selected, the second selection is meshed with the first, that result is meshed into the third selection and so forth.
Meshing may also be thought of as a concatenation of picture elements. Figure 6 shows picture elements on three layers; the fourth layer which was black holds the result of the concatenation. Meshing frames often results in interesting effects. To experiment with various effects, the artist simply retrieves created frames from the library, places them into layers, and requests the mesh function. When the meshed result does not satisfy the artist's intentions, he may either edit the final result to his satisfaction (e.g., remove hidden lines) or redo the mesh with a reassignment of predominant color.
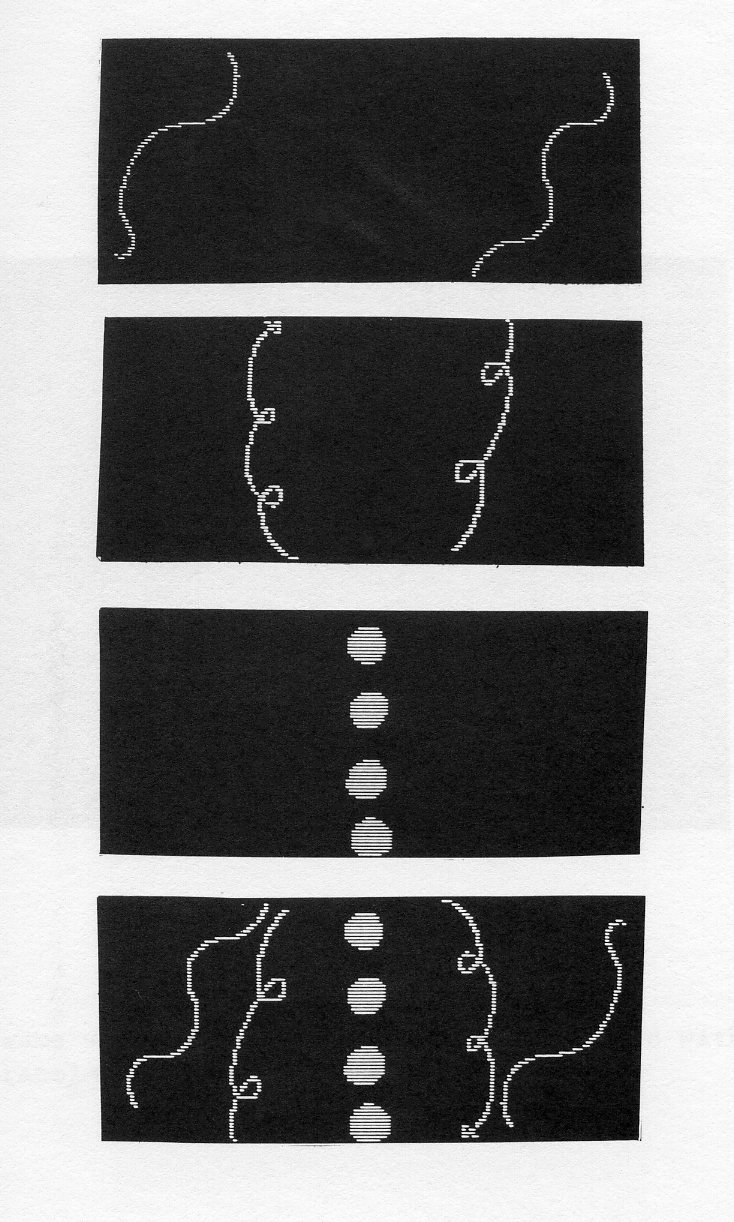
Translation shifts any layer along a vector defined interactively by the user. Using this function, the artist may pan a background, create a wipe effect, or move an object across the screen. The combined use of the translation, mesh and copy functions creates an animation sequence from a few drawings.
A push-down list of X, Y coordinates (relative to the lower left-hand corner of the display) are maintained in core to serve as the parameters for translations. The points are displayed as numbered crosses superimposed on the picture area of the CRT (Fig. 7). To add to this list, the artist enters the select point function and indicates the new point with the stylus of the data tablet. As in the drawing functions, the movement of the stylus is tracked by a spot on the CRT. The user may delete any point or points in the list with the delete point function. The last four pairs of coordinates selected are displayed and provide a short history of points for the user. To perform transformations over a span of frames with the parameters varying from frame to frame, the list would have to be longer.
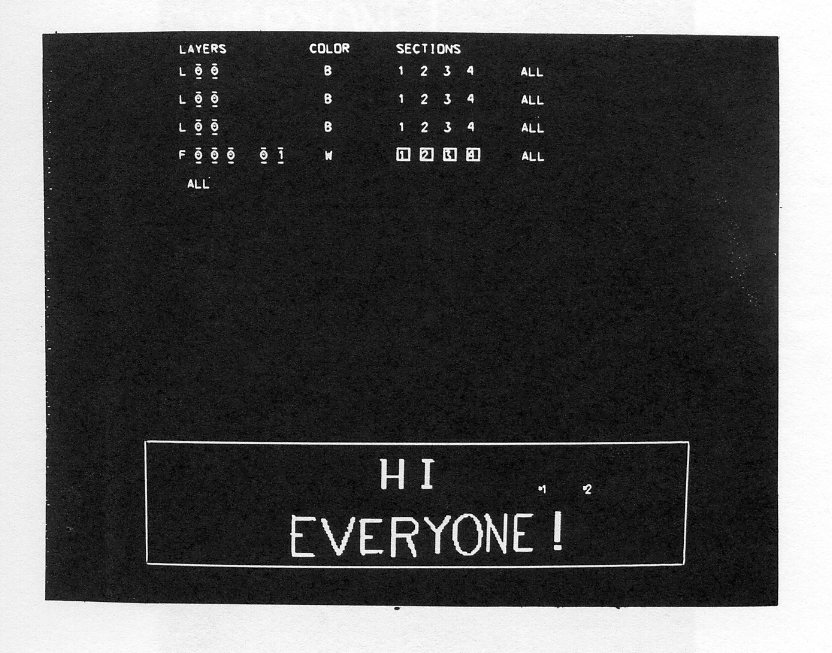
Translation uses only the last two select points. It shifts the selected layer so that the next to last point maps into the last point. The translation algorithm determines the difference of X2 - X1 to establish the direction (left or right) and the number of sections, words and bits to shift along the horizontal axis; the difference of Y2 - Y1 determines the direction (up or down) and the number of rows to shift along the vertical axis. To preserve the data as it is shifted, the movement must always start at the corner of the display from which data is shifted out of the frame. For example, if the translation is in a left and upward direction, the movement must start in the upper left-hand corner. The algorithm simply determines in which corner the movement must begin and the data which must map into that corner. It moves the data working across a row, checking for the end of sections. At the end of each row, any undefined bits are changed to the background color (the opposite of the predominant color) as selected earlier by the artist. The algorithm then starts moving the data from the next row until all defined rows have been shifted. Any undefined rows are, of course, changed to the background color. The time required to shift one frame is a barely noticeable flicker on the CRT from the original to the translated frame. The system does not save the original frame, although it would be a trivial addition and is a feature which should be included.
The artist may also select a continuous translation with the option to file the resulting sequence. This function continues to translate and display the selected layer using the vector formed by the two points for each movement until the artist presses a button indicating the end of the sequence. The function thus permits translation over a span of frames as long as the movement is defined by the same relative vector (Fig. 7) between each frame. The Hi Everyone sequence was created using this feature (Fig. 8). Note that the predominant color was white (Fig. 7), which implicitly defines the background color as black. The areas to the right of the frames as the frame is shifted to the left are, therefore, defined as black.
Any layer of the four layers in core may be translated at any angle or in any direction. By meshing two or more layers after translation, many effects may be achieved with a few basic drawings. Separating the background into two parts (e.g., clouds and hills), drawing these parts on separate layers, translating one or both layers and meshing the result forms background sequences. Further examples of translation and meshing are found in figures 9 through 12. In figure 9, an airplane pilot in his plane was drawn on one layer and clouds were drawn on another layer. Only these two drawings were used for the entire animation sequence (Fig. 10). A selection of key frames from the sequence shows the plane bobbing up and down as it moves through the clouds and then zooming off the screen (Fig. 10). To produce the scene, the plane was translated up and down and then meshed with the layer of clouds which was translated in a horizontal direction. At the end of the scene, the clouds were held still and the plane was moved at an angle.
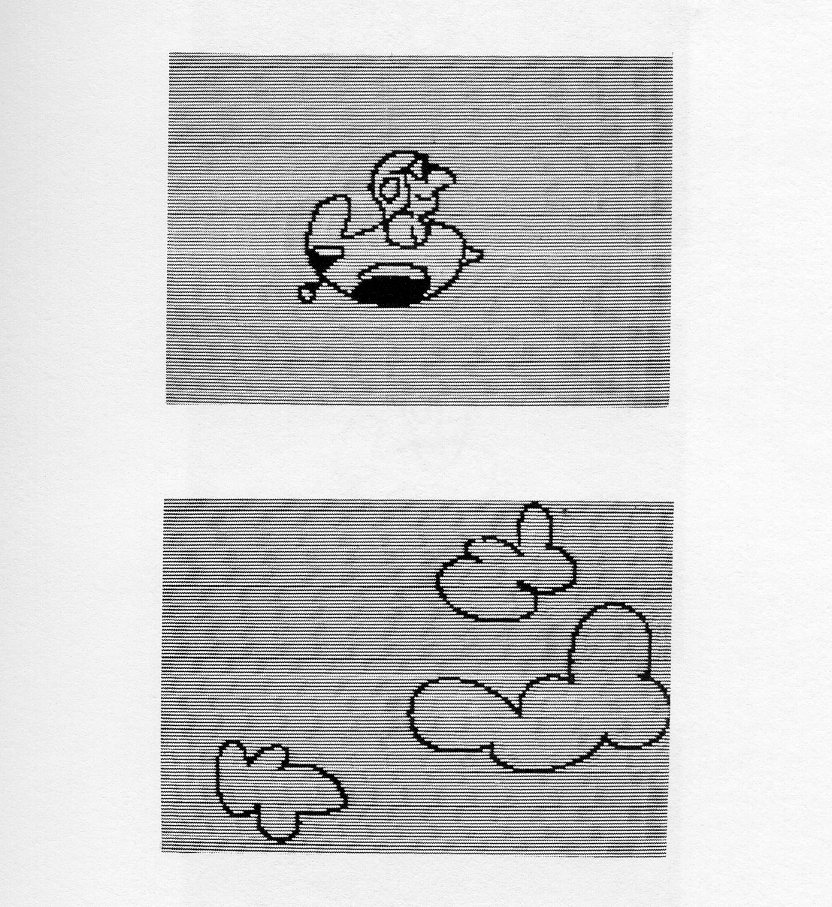
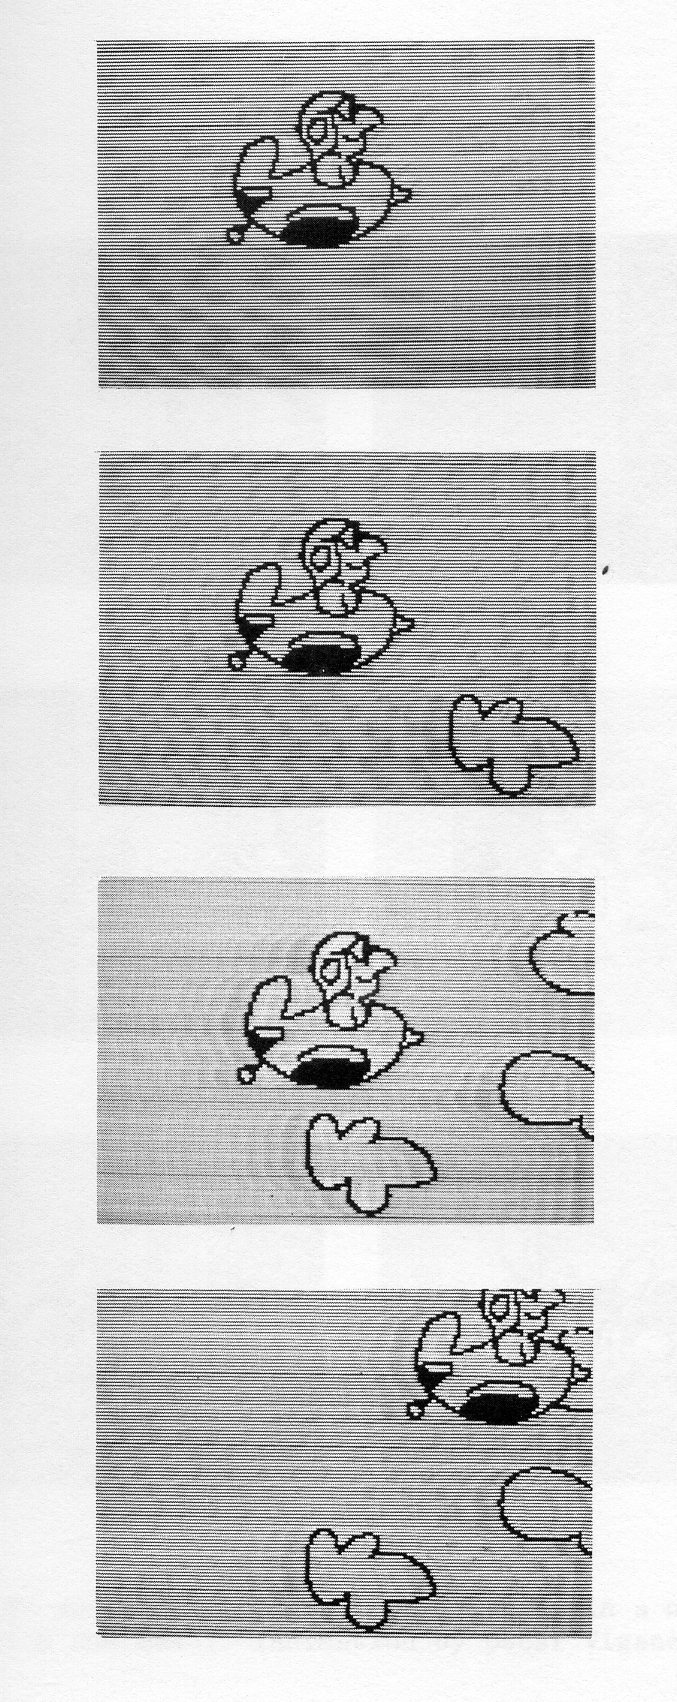
A wipe sequence, frequently used to begin a new scene as in figure 11, may also be created using translation. In the example shown, the artist has drawn the last frame of one scene and the first frame of the next scene. Working in reverse sequence, the first frame (last photograph in Fig. 1) is translated left and then right leaving a black area or bar at the left (after translation, the undefined areas are filled with the opposite of the selected predominant color). The last frame which is on another layer is translated left with a black area appearing on the right. Then the two translated frames are meshed to form the desired effect. If the artist changes the angle of the vector which controls translation between each frame, he can move objects or backgrounds to simulate many types of movement. For example, if the vectors are selected such that they define a circle, then the object being moved may appear to move around another object. The sequence in figure 12 shows a man who has crash landed with stars circling round his head. The stars were drawn on two layers, translated independently and then meshed with the main drawing which was on a third layer.
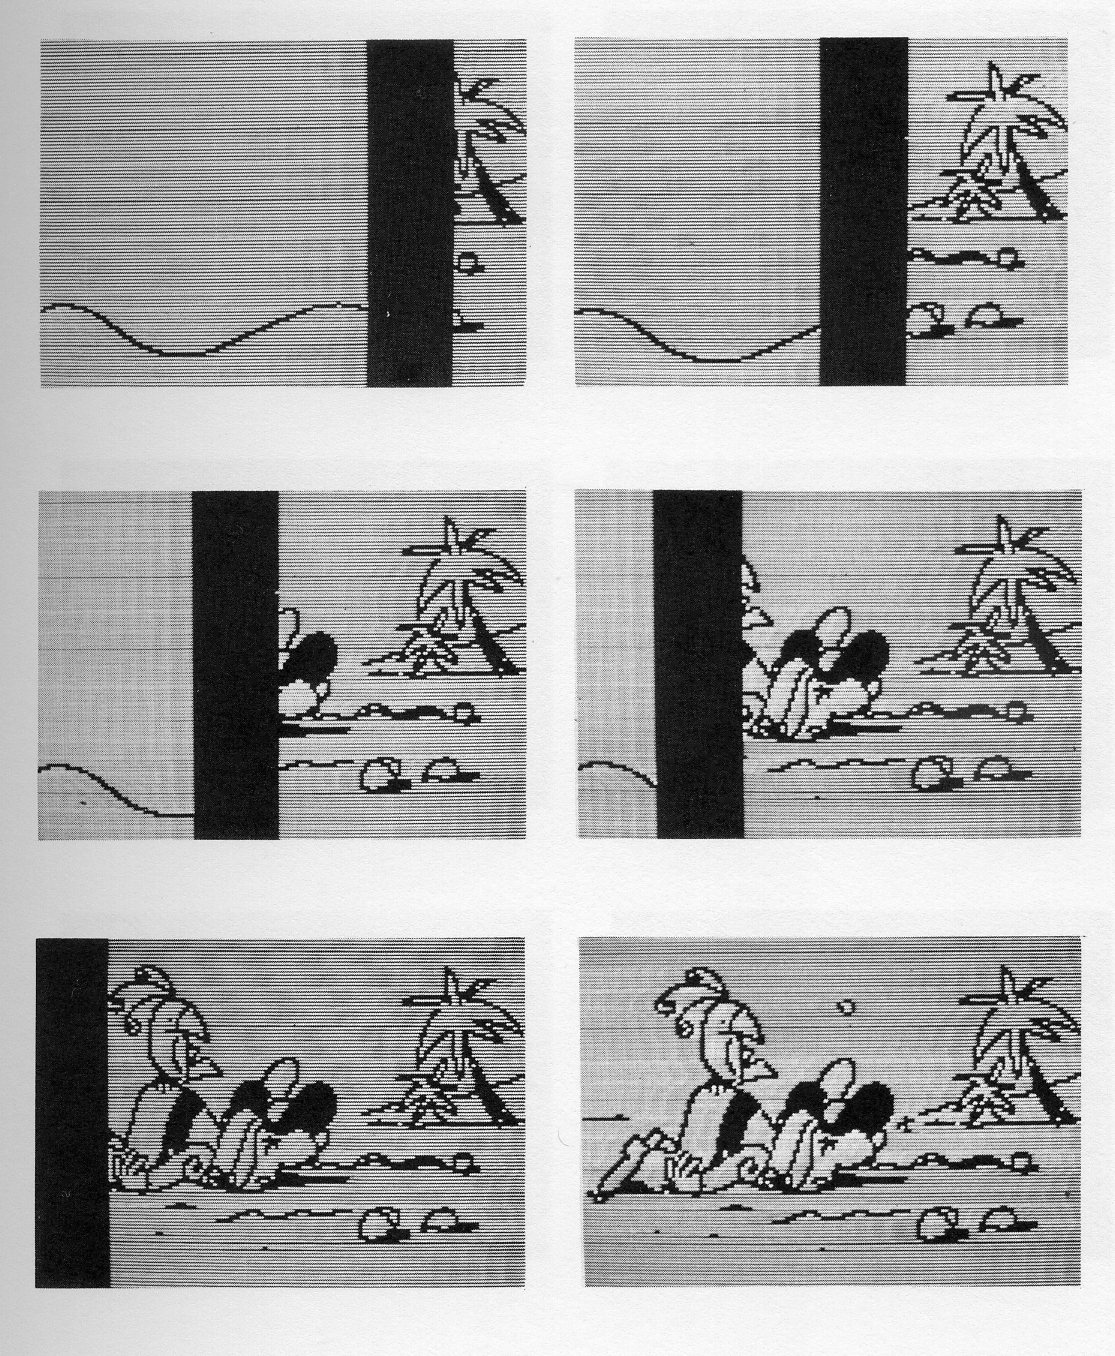
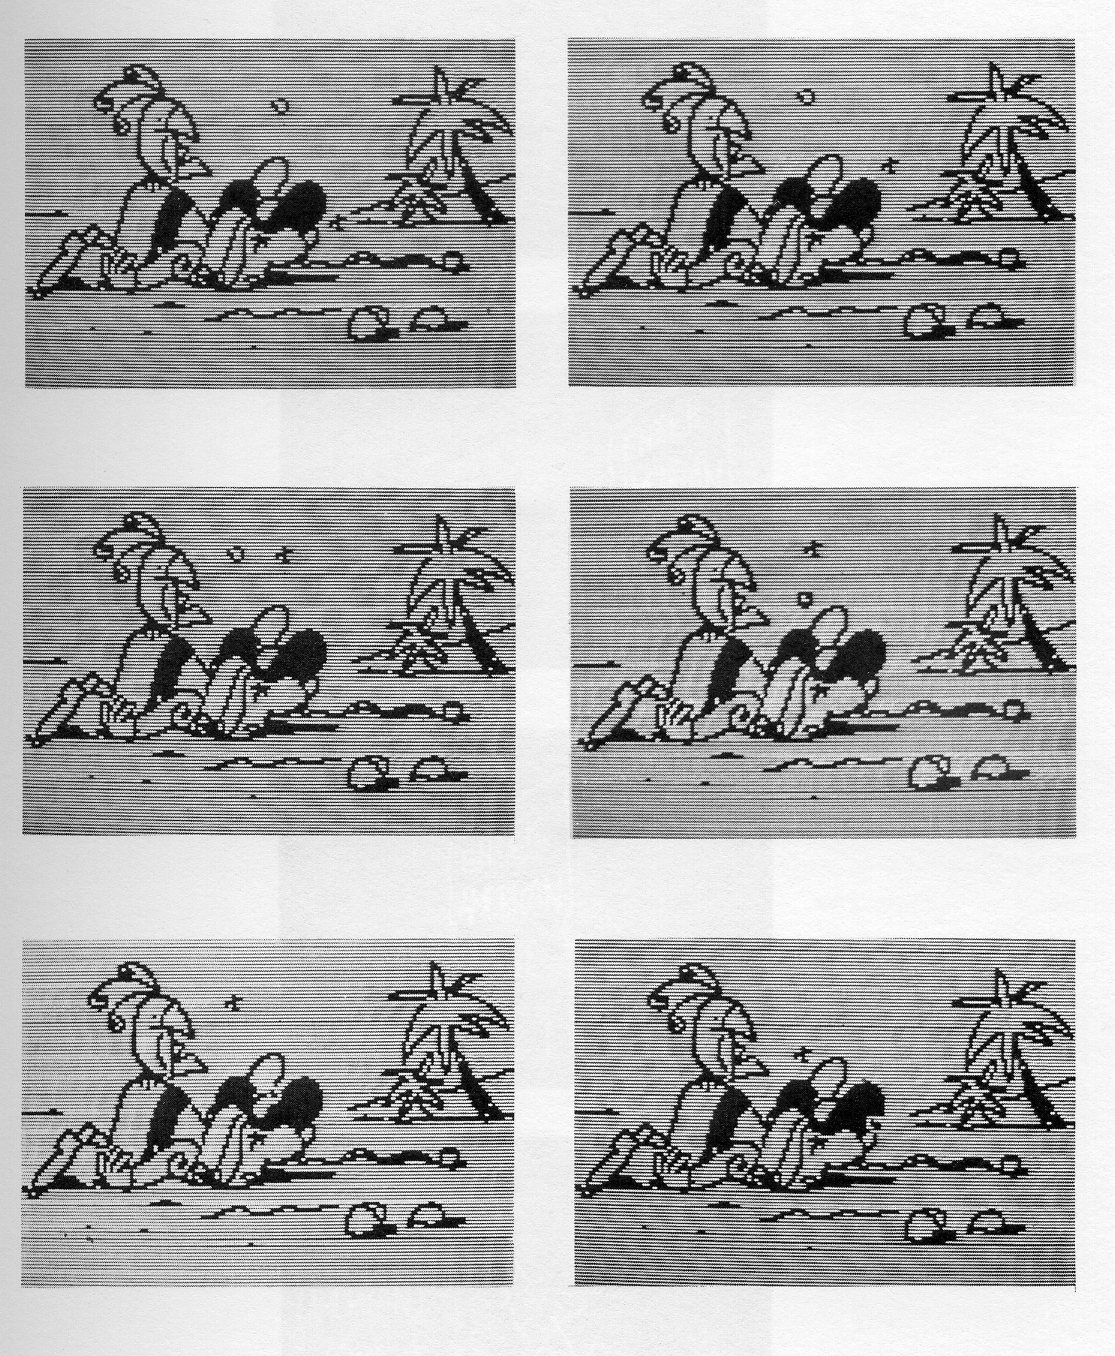
ACIANS has been used by professional and non-professional artists to create many short sequences. Oscar Vigano, an animator, has drawn several sequences using both resolutions. (A file is available with these sequences.) With no pre-drawn sketches, he was able to create a five-second animation sequence in one afternoon (Fig. 10). Only two drawings, which were translated (panned) independently and then meshed, were used. Several facilities could be easily added to the system to shorten the creation time. As a layer is panned, the non-visible portion could be saved so that an immediate reverse pan or a wrap around could be requested. A function which automatically pans and meshes independent layers would be quite helpful. A facility for defining a set of frames and the functions that create these frames as a cycle would be an important addition. The functions might be any of the allowable functions in the present system, such as retrieve into layer one, translate layer two according to the points selected in the push-down list, mesh layers one, two and three into layer four, file layer four, initialize layer four to black and repeat the cycle for eight frames. Another time-saving addition would be a library of character fonts to allow rapid creation of lettering. From our own experience and observations of other systems, we feel that a vector capability must also be superimposed on the present system. This would allow more rapid drawing of straight lines and make transformations simpler to implement including the automatic creation of in-betweens. [4]
Besides creating animation sequences, the system has also been used to create storyboards. Oscar Vigano has drawn key frames on the system, taken polaroids from the CRT, and pasted them on a board for a customer. It is not only a time-saving method for creating a storyboard, but also sets up a disk with key frames for the final cartoon.
Animation sequences can be easily created by non-professional artists from key frames, as we learned when Stan Popko, an animator from New York City, provided us with drawings for an animation sequence. (A file is available showing these sequences.) The drawings were then traced and manipulated by Camille Junker, one of the authors, to produce the actual cartoon (Fig. 13). Filming can be done directly from the screen of the CRT, as was done in the above case. A photo cell was placed on a button on the program function keyboard. When the button was pressed, the requested frame was retrieved, the shutter on the camera automatically opened, the frame held for two display cycles and then the shutter closed. The same frame may be photographed automatically for any specified number of frames or the next frame in the sequence may be requested. A professional film could also be created on an SC-4020 by transferring data from disk to tape in the appropriate format.
The most interesting commercial possibility might be to produce a video tape directly from disk. Since ACIANS is based on a raster scan concept, it should not be difficult to format the data properly for a digital to analog converter. For the user of the system, this approach would provide excellent review capabilities and would solve the problems resulting from the severe limitations of disk storage.
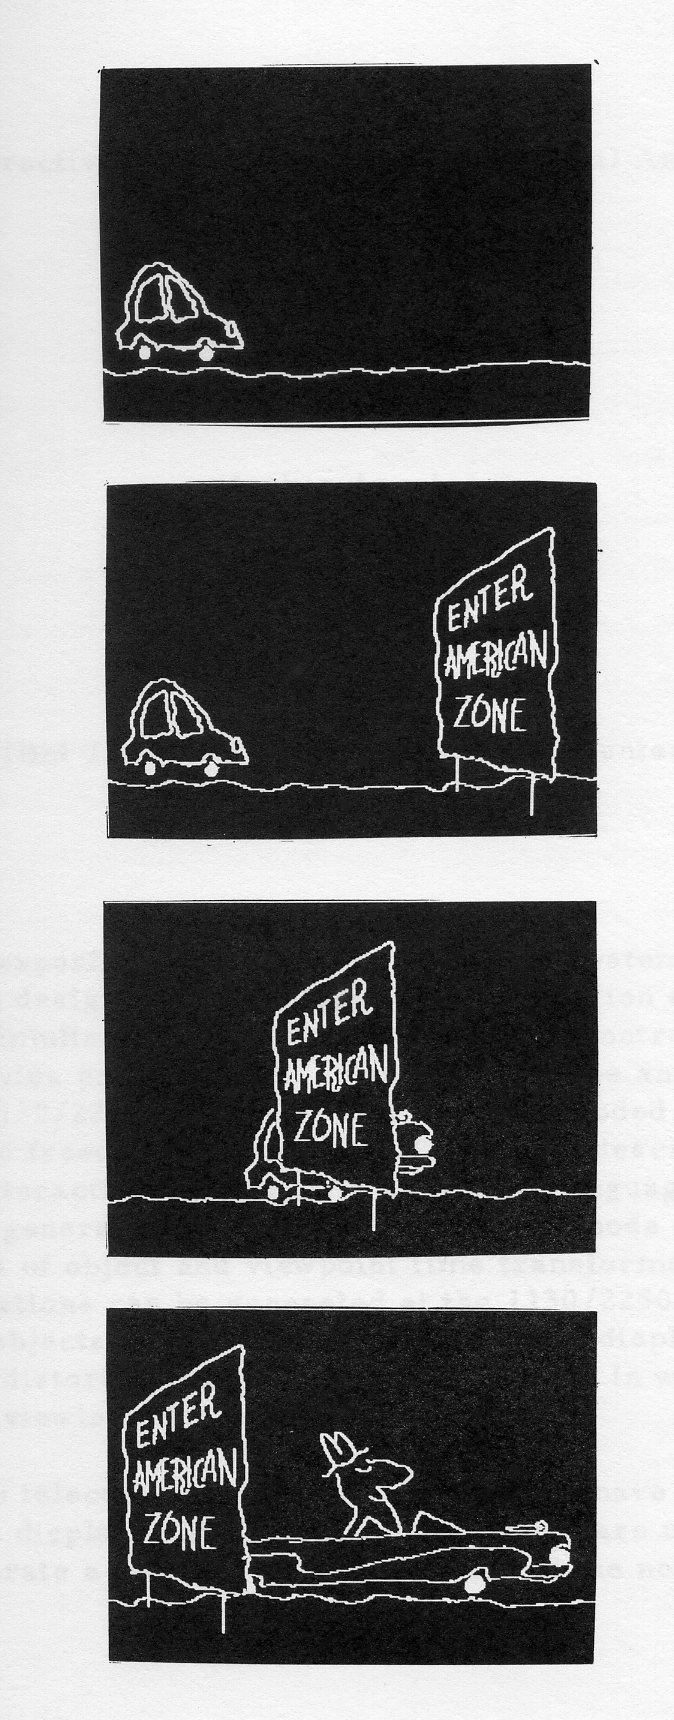
At the present time, no future additions to ACIANS are planned. We feel that a basic system which met its original objectives was developed, but it is still only a beginning.
The animation, comments and suggestions by Oscar Vigano have been greatly appreciated. Gratitude is expressed to Stan Popko for the design of animation sequences.
1. Carol Fernsler, Camille Volence, Artist-Computer Interactive Animation System, UAIDE Proceedings, November, 1969.
2. Carol Fernsler, Camille Volence, Computer-Aided Animation, RC 2763, IBM Research Center, Yorktown Heights, New York, January 19, 1970.
3. Janice Lourie, The Computation of Connected Regions in Interactive Graphics, Proceedings of National Conference (ACM), 1969.
4. F. Gracer, M. Blasgen, Karma: A System For Storyboard Animation, UAIDE, Proceedings of the Ninth Annual Meeting, October, 1970.
An experimental computer animation system has been developed which enables the design of three-dimensional animation at an IBM 2250/1130 display and the simultaneous automatic punching of control cards for the generation of movies on a SC-4020. The objects to be animated can be designed at the 1130/2250 display or they can be encoded manually when additional artistic freedom is required. The object description can be checked on the interactive display. An animation language has been written to control movie generating programs run in batch mode on the 360/91. This language consists of object and viewpoint time transformation descriptors. These transformations can be generated at the 1130/2250 as the animator manipulates the objects on display. The interactive display enables translation, rotation, distortion and duplication of objects in wire frame renderings with perspective viewing.
The animator can telecommunicate with a 360/67 to have the hidden lines eliminated on the display. Animation control cards are usually processed overnight to generate a movie which can be viewed the next day.
Now that many investigators [1][2]p3][4] have demonstrated that realistic pictures of three-dimensional objects can be economically computer generated, the major problem of three-dimensional graphics is the refinement of techniques for specifying three-dimensional scenes. Most objects as lists of points in space associated with specific x, y, z coordinates and a list of topological connections between these points. If the program handles wire frame or opaque flat surfaces or solid polyhedra, the vertex points of intersecting lines are stored. For curved surfaces, points on the curves are stored or the equations of the surfaces and limiting regions are stored [5]. For curved surfaces, points on the curves are stored or the equations of the surfaces and limiting regions are stored [6]. The determination of vertex points and surface equations is time consuming. Even for the simple object shown in Figure 1, the manual encoding may take six hours. This is because the building in Figure 1 is meant to represent a proposed building and dimensions must be used that are in scale with the design. Figure 2 is a sketch of a polyhedra that approximates a human head and Figure 3 is a typical SC-4020 presentation of that sketch, and these pictures demonstrate another aspect of modeling that can cause problems - the attainment of a shape that will be pleasing when viewed from any direction. Designing and encoding Figure 2 required about 60 hours even with a considerable amount of computer assistance. Another aspect of three dimensional presentation that is very significant is the specification or relative motion of objects within a scene either to mechanical or mathematical specifications or for artistic effects. Still another problem is the change in shape of a particular object in time.
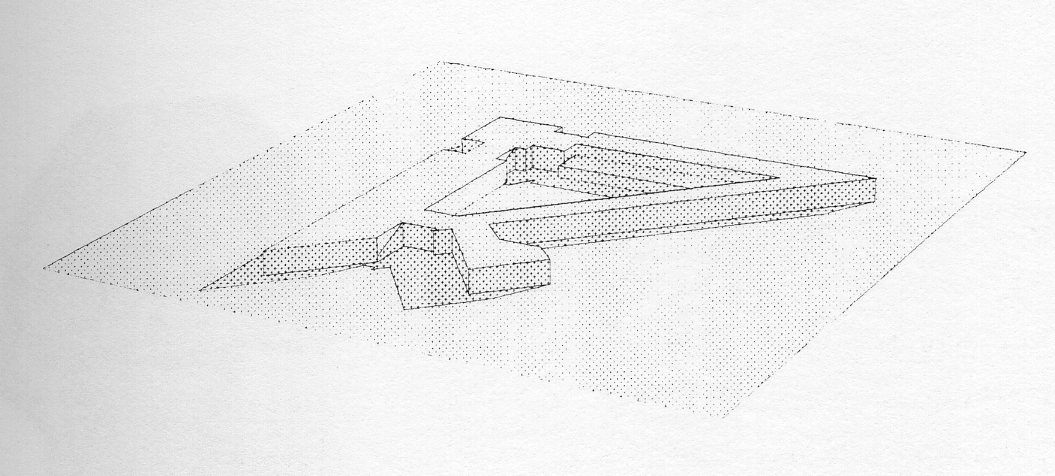
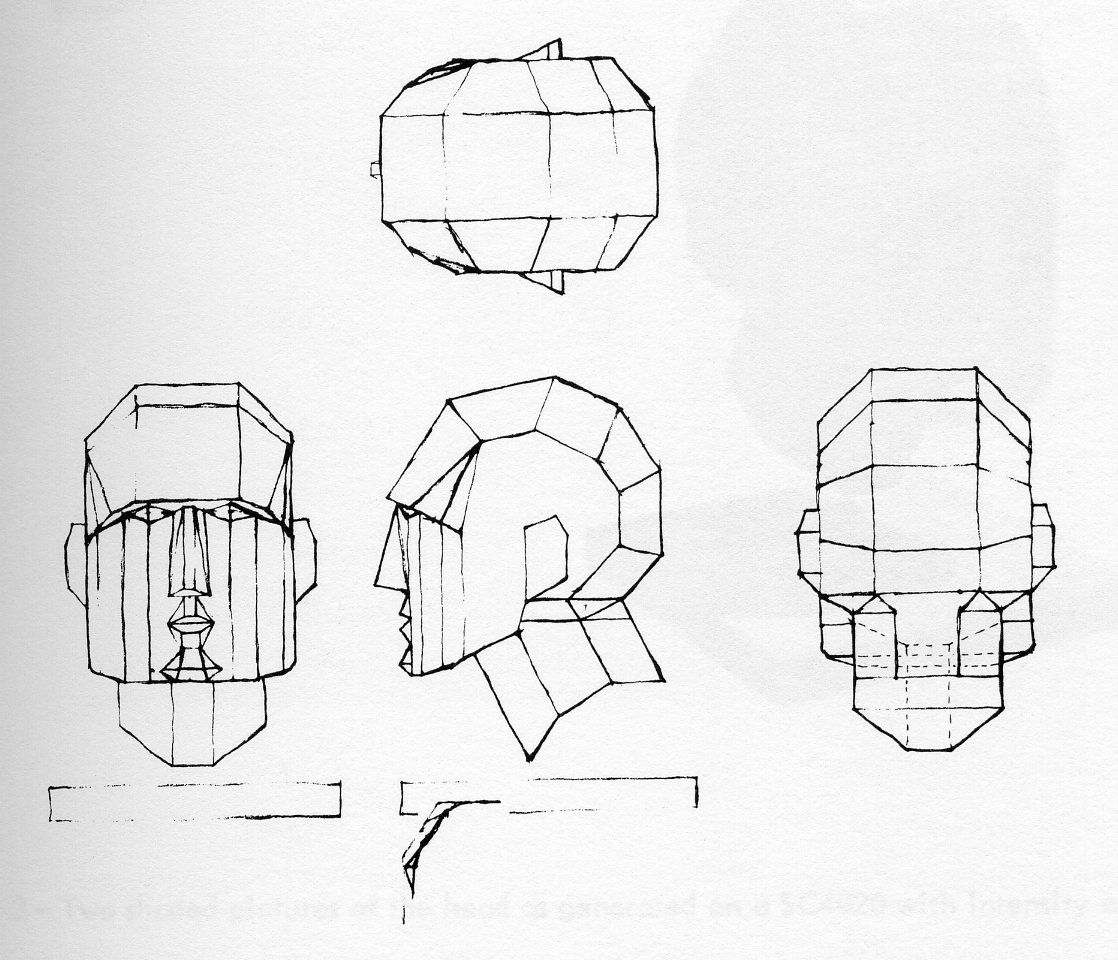
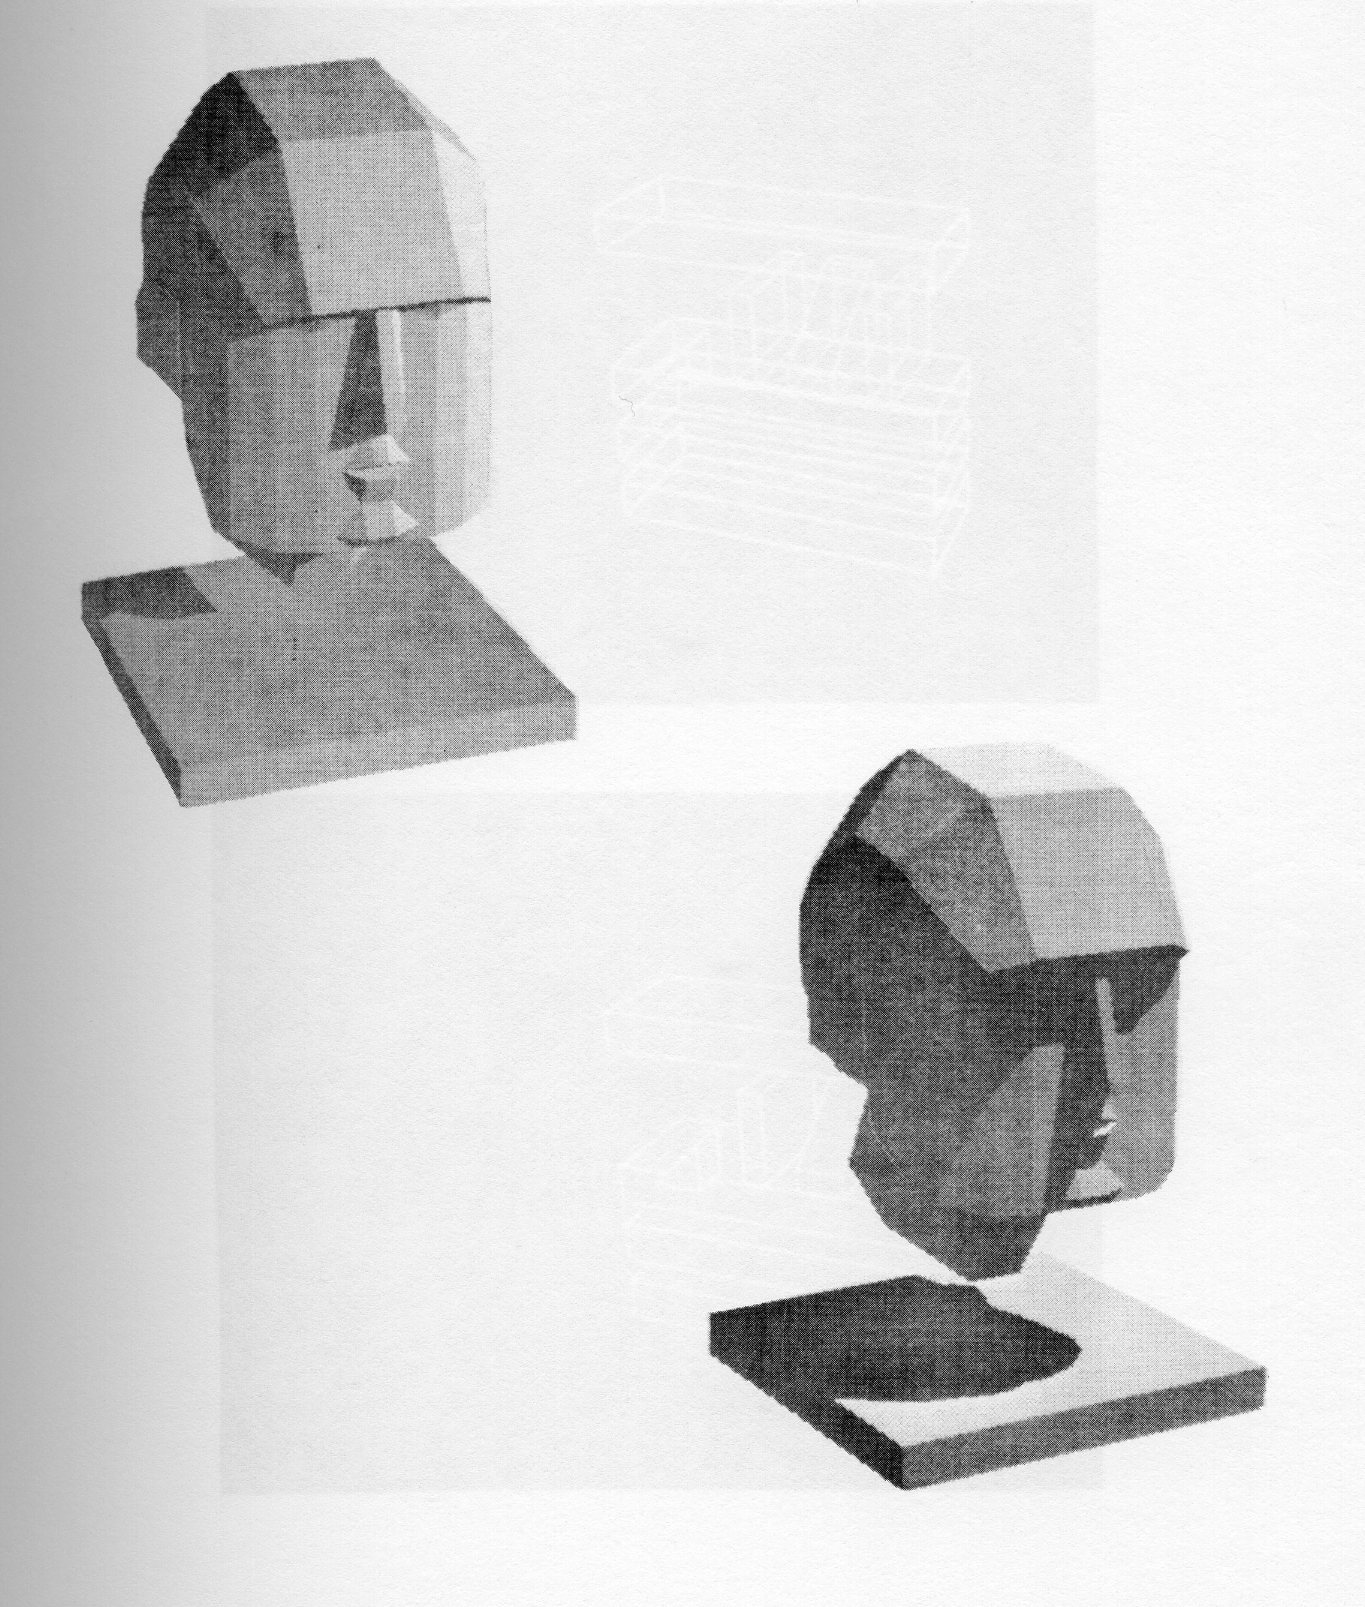
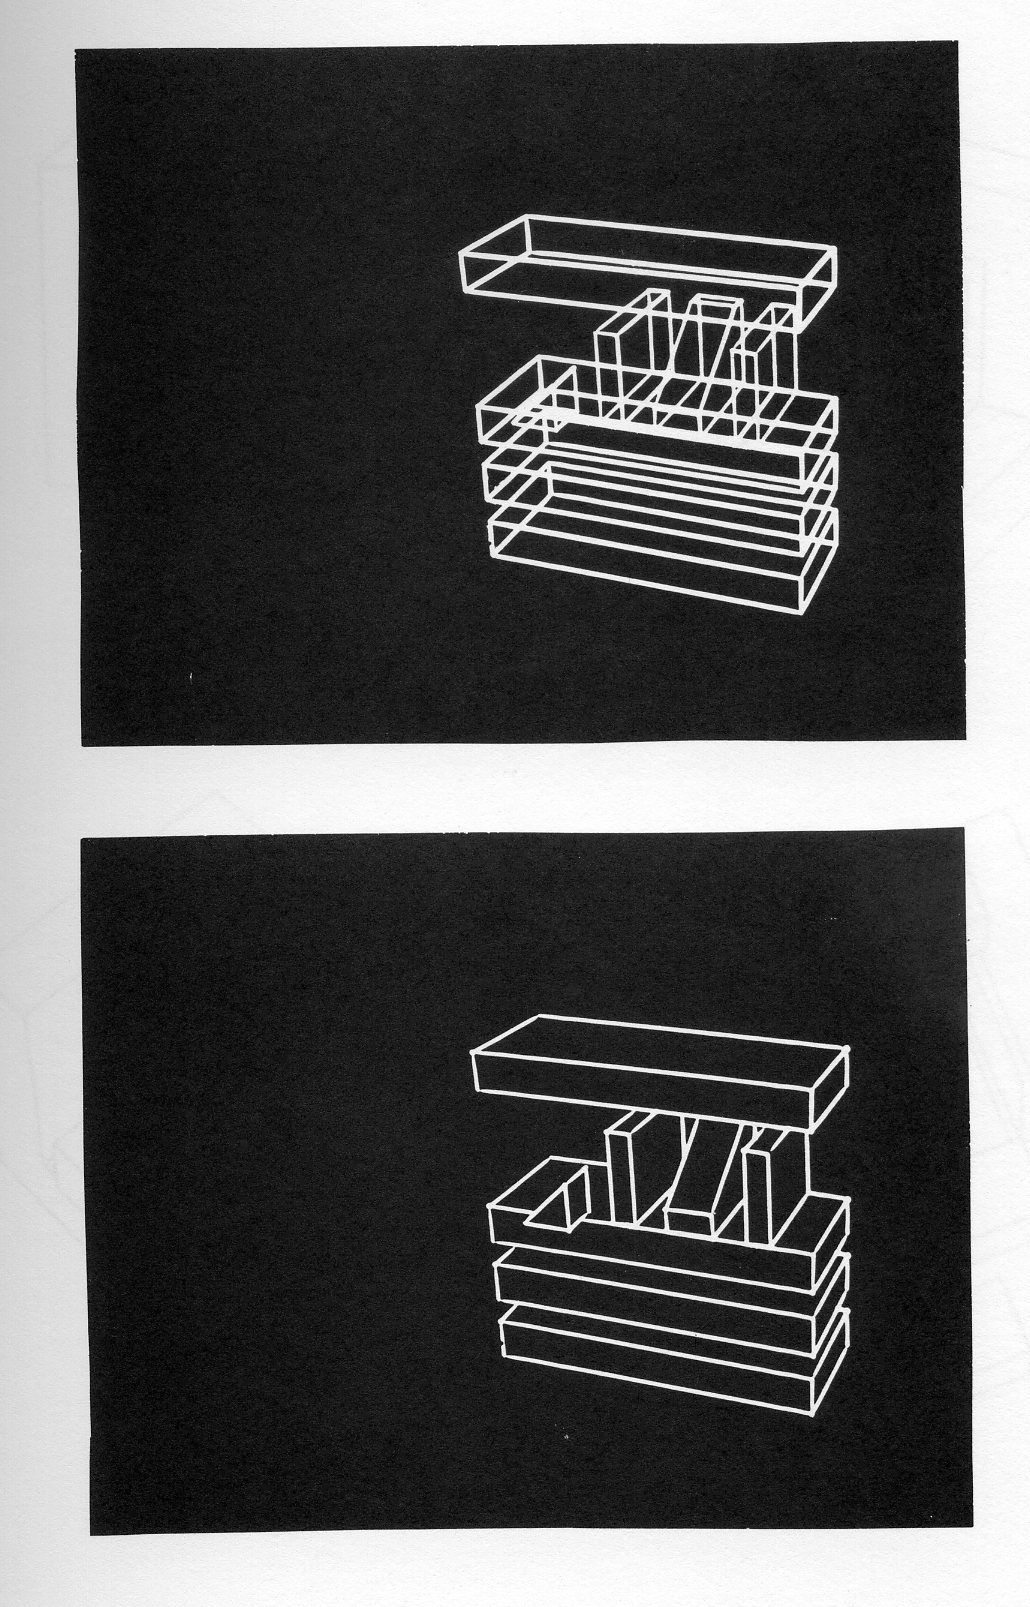
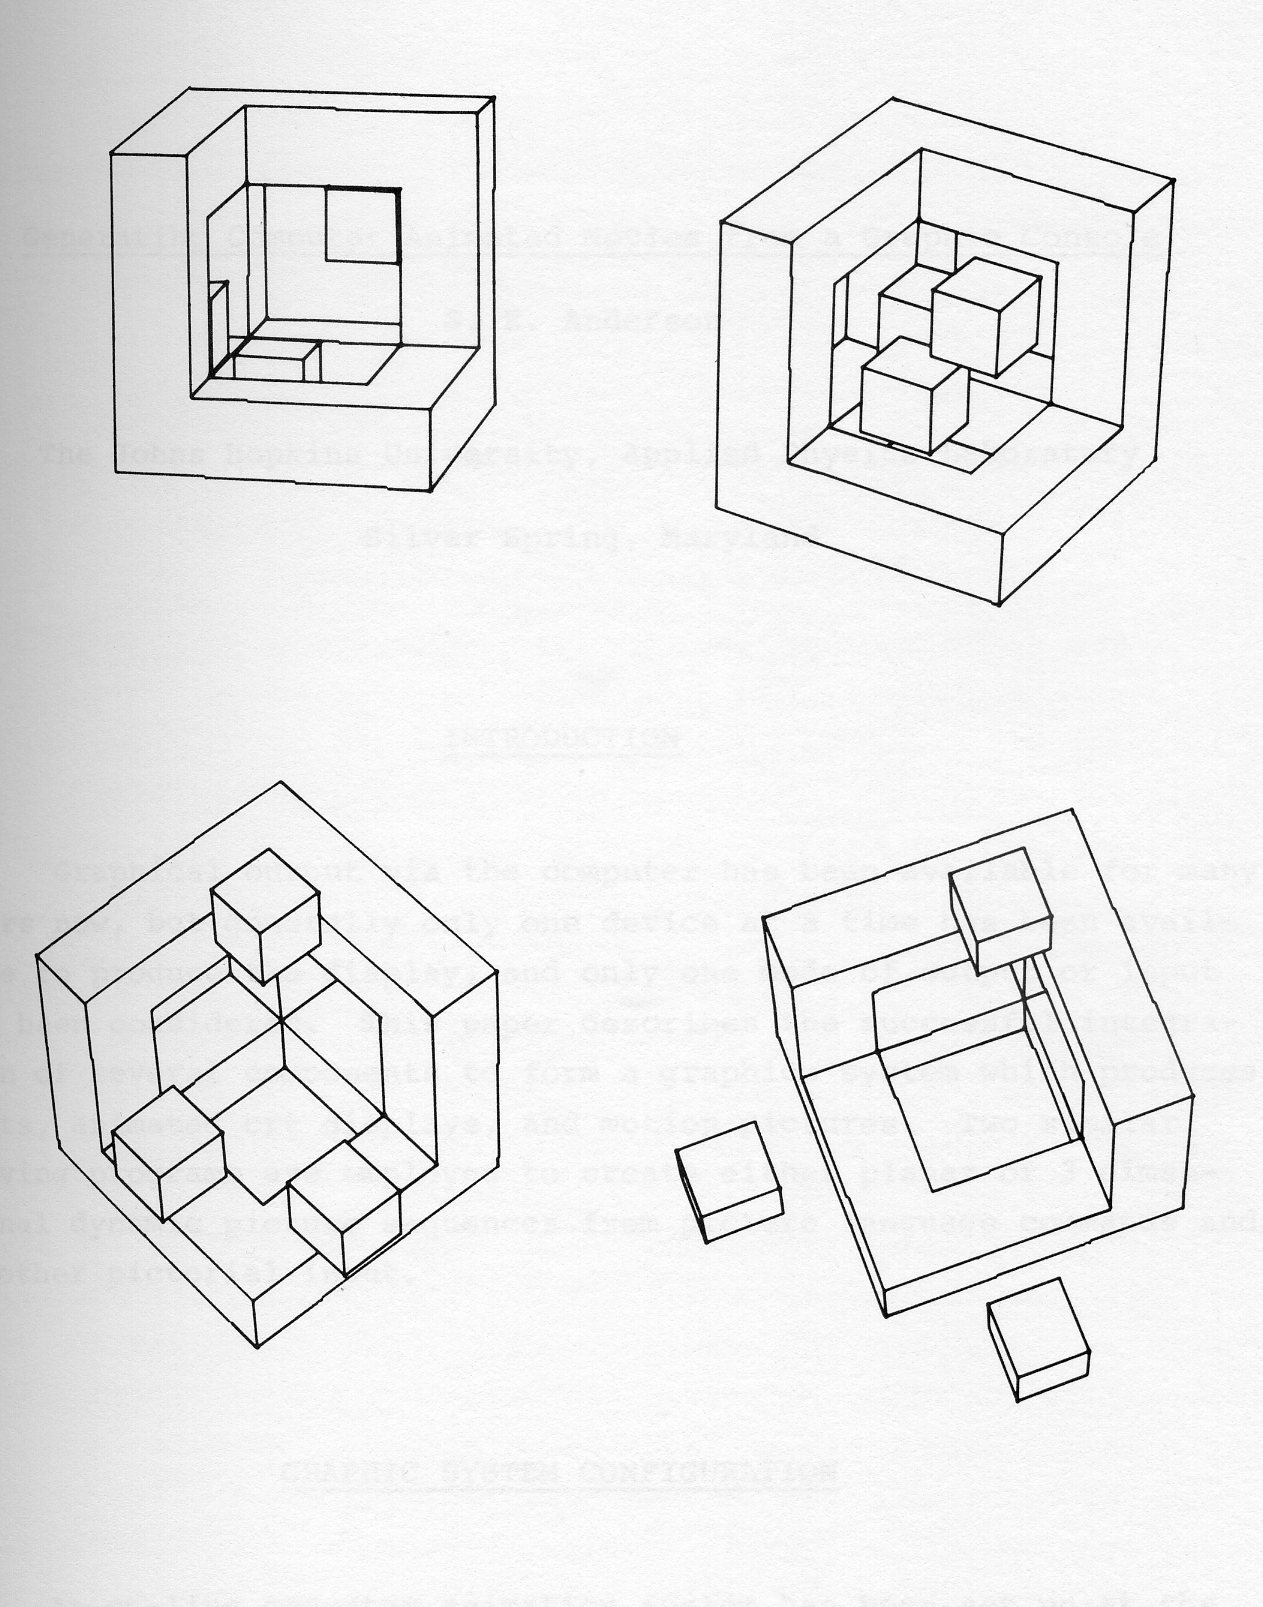
When the objects in a scene are simple polyhedra or quadric surfaces, the problems of object description, placement, or distortion are trivial [7]. But when the objects in the scene are intended to simulate a specific machine or structure such as a specific airplane or an artistic object such as a Brancusi sculpture, then the problem of object specification is very difficult. This problem has received considerable attention [8][9], but results are tentative, highly specialized or unsatisfying. Almost all attempts at computer art produce works that if not made by machine, we would consider amateurish. And those works which prove pleasing, due to mechanical complexity or grace, usually have a cold, impersonal, even repellent aura. Perhaps this is the desired effect, but this is also a very limited artistic range. In any instance where a static two or three dimensional computer presentation evoked a deep response, for example C. Csuri's famous Sine Wave Man, the artist or designer involved most probably worked long and hard to achieve the effect. Perhaps that is the nature of art and we should never hope to be able to program beauty.
The only computer generated art which we generally enjoy are the automatically generated movies. Even though the specific objects tossed about and distorted are individually not necessarily beautiful, the continuous motion, the precision, the surprise and the wonder are universally experienced. When viewing William. Fetter's simulation of an airplane landing on an aircraft carrier, we can almost feel the three g impact.
Over the past two years, the authors have studied the problems of three-dimensional modeling and while we have had some success in developing techniques for object modeling and placement, we have found our best efforts have been in the specification of three-dimensional animation. Only in the design of an animated sequence have we been able to demonstrate significant results either for artistic or mechanical design purposes. The experimental system that has evolved enables an engineer or artist to compose an animated sequence in a few hours and to see the finished result the next day. Certainly the equipment involved is costly, but nevertheless, the contribution of the computer is significant.
As soon as the design of a three-dimensional animation scene was attempted it became obvious that blind encoding is almost impossible. The quality of SC-4020 three-dimensional movies were initially tested by picture generation from a FORTRAN program where the viewpoint coordinates, the scene transformations and the scaling was controlled by nested DO loops. Such coding for elaborate motions of the eye and scene was recognized as cumbersome so a simple tab card language was developed. A specific sequence elapsed time in seconds is indicated and the sequence change in viewpoint spherical coordinates and scale are specified. The rotation and translation of each object in the scene is also encoded. The program, run in a 360/91, reads in the specified viewpoint and object changes, sets up the scene in the initial position and by linear interpolation over the time span of the sequence, repositions the scene for every frame, updates the viewpoint and changes scale. Each frame is generated on the SC-4020. As soon as an artist tried to use all this animation capability, he became confused. The task of trying to keep track of centers of rotation, the extent of translations, the best viewpoint for observation, proper scaling and also trying to keep the objects from intersecting each other irrationally is impossible. Even the process of writing down all the numbers involved looked like hours of work for even a trivial movie. This is the classic problem of any controlled process: the more control to be exercised over the process, the more difficult it becomes to control the process.
Fortunately, we had recently implemented a very powerful object manipulation system on an 1130/2250 with telecommunication to a 360/67. The object manipulation program enables a designer to read from cards a few simple or complex objects which he then positions, and distorts. He can also duplicate specific objects and change the viewpoint for perspective projection of the scene displayed on the 2250 screen. The scene is displayed in wire frame mode during manipulation and after every specified change the perspective picture is regenerated. After a few major changes, if the designer becomes confused, he can transmit the scene description to the 360/67 via TSS; a hidden line elimination program resident and pre-compiled in the 360/67 will then process the scene description and pass back to the 1130/2250 data to display the scene without hidden lines. The designer usually waits about twenty seconds to see the more realistic presentation.
Because both the movie specification language and the object manipulation system operated on objects in the same way, and had a common data structure and even used the same hidden line elimination programs, it was clear that the two were compatible. A small effort was then undertaken to add two functions to the object manipulation system. One was to have the system keep a record or object changes and successive viewpoint and projection scales. The other was to punch on the 1130 card punch, whenever it was called for by pressing a selected program function key, a sequence viewpoint change card or an object motion card. The act of cards so produced could now be run in the 360/91 to produce the movie.
Five basic separate software packages were used for our work. The display and control system for the 1130/2250 is called GSERV and was especially written to enable FORTRAN interactive display capability with minimum core consumption. This system required about 4000 words of core and enables the response to interrupts from a light pen, the alphanumeric keyboard, the program function keys and a Sylvania capacitance tablet. GSERV enables the display of points, lines or characters. Interrupts, when detected, cause the GSERV assembly language programs to pass to the main FORTRAN program a vector whose components describe the source of the interrupt. For example, if a program, function key is depressed, GSERV will identify not only that a PFK has been depressed but also which one. The elements for picture display may be detectable points or lines, undetectable points or lines, or blank lines. Coordinates may be integer or real scaled to the 2250 raster locations or the elements may be displayed in raster coordinates directly. A character set is also available for display, but this has not been extensively used for three-dimensional work. GSERV keeps track of the picture elements and one level of organization of these elements into entities. Higher levels of organization are maintained by the FORTRAN programs.
The 1130/2250 FORTRAN processing program, called MADEL, was also designed to use a minimum of the available core. One of the key notions of our three-dimensional work is that objects and scenes should be composed by manipulating specific volumes not the lines or points which compose the geometric description or the projected image of the volume. MADEL was written to study the problems of manipulation of a scene description from an interactive console therefore developing the capability of disk storage for additional subroutines and scene or object descriptions was ignored. Indeed it is not yet clear whether it would be best to store object or scene descriptions in a remote 360/67 or on an 1130 disk.
A basic scene description is entered into MADEL by tab cards. These cards are two lists: one is the labeled vertex points in space; the other is a topological map organizing lines into planes, and planes into bounded volumes which are organized into objects. MADEL automatically processes the input list and sorts vertex points into objects and determines which two surfaces can be associated with a line. Rotation, translation and linear distortion are functions only of the geometric coordinates so if only a particular object is to be manipulated, the coordinates of only that object should be processed. The copy function involves a search of the topological map as well as the coordinate list. The automatic sorting of data is therefore very useful and simplifies the original scene description which at present must be done by hand. With MADEL, we have entered the object description of a single cube and by patient manipulation of this cube and many copies we have composed complex structures. As previously mentioned, MADEL was modified to enable an artist working at the 2250 to depress a PFK to punch a card which sums up the current manipulations on the last object specified. The artist can depress another PFK to record the change in perspective viewpoint and scale. Punching a card clears the storage locations for the data recorded on that card so an artist has to be very careful or he can inadvertently lose his results. The artist can request cards faster than the machine can punch so as a check, card images are also printed. The printer usually can keep up with the animation designer so the print out can be trusted. Incorrect cards or missing cards can be determined from a quick correlation.
The telecommunication software is SCAT4 and COM1130. A detailed description of this package is available from W. Sands Hobgood, at the Thomas J. Watson Research Center. SCAT4 enables a FORTRAN program at the 1130 to send and receive data. COM1130 operates in a similar way for the host 360/67. In our application, the artist depresses a PFK to initiate the transmission of the current vertex list and the topological map. During transmission, the display is blank but the scene reappears after the entire model has been transmitted. The artist then manipulates the viewpoint and scale of the scene incrementally with the program function keys, and he can then transmit the current viewpoint and scale at any time. Again, during transmission, the screen is blank and remains blank until data for the picture with the hidden lines removed is received by the 1130/2250 and the picture is displayed.
The FORTRAN hidden line eliminating program, LEGER, is used in the 360/67 and in the 360/91 to generate the frames of the movie. The data structure and perspective projection schemes of MADEL and LEGER are identical. LEGER can be used to generate line drawings or shaded pictures with shadows cast from a remote light source. A detailed description of LEGER has been previously published [5]. LEGER was originally written to control a Calcomp plotter and the graphic potential of this program was made available for movie making on the SC-4020 by the development of Calcomp compatible software (CSS).
CSS acts as an interface between the SC-4020 manufacturer supplied FORTRAN callable subroutines, SCORS, and programs intended to operate with a Calcomp plotter. The operating system resident in the 360/91 allows a user to choose either 16 millimeter, 35 millimeter film output or 7 inch paper tape output on the SC-4020 or 28 inch paper output on the Calcomp plotter. We can also produce shaded pictures on the SC-4020. Such availability of graphic media has proven very helpful for debugging and object design. Details of the SC-4020 and Calcomp support systems have been printed in a special issue of the Research Center Newsletter [10].
It must be mentioned that work of this kind could not be undertaken without large available hardware and software. The authors are indebted to J. F. Jaffe, R. W. Ryniker, W. S. Hobgood, E. B. Horowitz, S. F. Seroussi and J. W. Meyer for their contribution to TSS telecommunications.
We would like to thank Dr. R. Hockney for his work on CSS and for hia deep personal commitment to the cause of computer generated movie making. We also appreciate the continued support and encouragement of L. A. Belady, F. Gracer and R. D. Tennison in this endeavor.
1. Warnock, John E., A Hidden. Line_Algorithm for Halftone Picture Representation, Technical Report 4-5, University of Utah.
2. Watkins, Gary S., A Real-Time Visible Surface Algorithm, Technical Report UTECH-CSc-70-101, University of Utah, June 1970.
3. Appel, Arthur, The Notion of Quantitative Invisibility and the Machine Rendering of Solids, IBM Research Report RC-1775, February 27, 1967.
4. Galimberti, R., and Montanari, V., An Algorithm, for Hidden Line Elimination, Comm. ACM, Vol. 12, 14, April 1969.
5. Appel, Arthur, Modeling in Three-Dimensions, IBM Systems Journal Vol. 7, 3, 4, 1968.
6. Woon, Peter, On the Computer Drawing of Solid Objects Bounded by Quadric Surfaces, Technical Report 403-3, New York Univeristy, 1969.
7. Sutherland, Ivan E., Computer Displays, Scientific American, June 1970, pgs. 58-59.
8. Gellert, George O., Geometric Computing, Machine Design, March 18, 1965 and April 1, 1965.
9. Wehrli, Robert, Smith, Max T., and Smither, Edward F., ARCAID-The Architects Computer Graphics Aid, Technical Report UTEC-CSc-70-102, The University of Utah, Computer Science Department.
10. Computing Center Newsletter, Vol. 3, No. 6, May 4, 1970, IBM T. J. Watson Research Center, Yorktown Heights, New York.
Graphical output via the computer has been available for many years now, but generally only one device at a time has been available to produce the display, and only one mode of output or input has been considered. This paper describes the successful integration of several components to form a graphics system which produces plots, animated crt displays, and motion pictures. Two similar driving programs are employed to create either planar or 3 dimensional dynamic picture sequences from picture language commands and/or other pictorial input.
An on-line computer animation system has been set up at the Applied Physics Laboratory of The Johns Hopkins University (see fig. 1). An IBM 360/91 is used to drive a 2250/3 cathode ray tube in a time shared environment. A program user can type in picture language commands from the alphanumeric keyboard, scan and edit this code using the light pen, then call for the dynamic sequence to be displayed. The programmed function keyboard switches are depressed to advance a selected number of frames in a movie editor mode.
When a picture sequence is considered to be acceptable, a permanent record is made by one of the following 3 devices:
Two major programs were written which accept this picture language: HICAMP (Hopkins Implementation of Computer Aided Motion Pictures) and HICAMPER (Hopkins Implementation of Computer Aided Movie Perspectives). They were adapted by the author from his previous work for the E.E. Dept. at Syracuse University, and are fully described in his M.S.E.E. thesis. HICAMP produces movies of planar, 2-D objects, while HICAMPER accepts similar commands to produce movies of 3-D objects in perspectives (see fig. 2). Both programs utilize a novel list processing concept to store pictures, which allows a selected sub-group, or an entire scene to be manipulated by a single command. Loops of instructions can generate hundreds or even thousands of frames of film, depicting complex motion of any sort, expressible by an equation. Simple motions (translation, rotation, or sizing) can occur separately or compounded together. Although the programs were written in FORTRAN for transportability to other computing centers, they are stored on disc in load module form. All instructions are read in as data cards, so that the compiler phase is unnecessary, resulting in very efficient real time operation. Basic figures, such as a circle, rectangle, or arrow are invoked by giving an easily recalled mnemonic with the desired location and dimensions. A full alphabet, along with special characters are also provided. Since the letters are treated as pictorial data, they can be manipulated in the same manner instead of being limited to several font sizes. Any rectangular area can be masked out or windowed in automatically. These areas can be changed dynamically, creating unusual wipes or dissolves for special effects. If the first and last views of a figure are specified, all interstitial views can be calculated by a linear interpolation when called for. This technique can even be used to produce cartoon styled movies.
The dynamic sequence of images is displayed on the IBM 2250 crt. The viewing area of this tube is a twelve inch square, but programming logic truncates all lines to a vertical height of nine inches. This allows a picture rectangle with a 3 to 4 height to width ratio, which complies with the border frame for 16 mm. film. The display thus has the advantage of simulating a movie editor, and the convenient 9 × 12 inch viewing area allows co-ordinates to be measured directly from the tube face if necessary.
The programmed function keyboard (an array of 32 push buttons) is used to control the action of the display. Several buttons allow a fixed number of frames to advance: 1 (single cycle), 6, 24, 96, or 9999 (essentially free run). Two other buttons specify the projection speed: either 10 or 20 frames per second. Finally, the light pen can be used to abort the program if necessary.
Alterations or additions to the picture language instructions can be readily made by the programmer without leaving the graphics terminal. The set of cards are initially keypunched and loaded onto a direct access device (disc). The IBM provided Data Set Edit program was implemented to provide interactive command updating. This program allows a data set to be scrolled through and displays 20 card images at a time on the crt screen. Any card may be selected by means of the light pen, and edited in any part by means of the alphanumeric keyboard. New commands may likewise be entered into a key-in area, and inserted after any existing card in the sequence. Once the data set has been amended, it may be rerun and checked once again for errors or additions.
To expedite the input process of complex or irregular diagrams a Pencil Follower Coordinate Digitizer is used off-line. This unit permits an unskilled operator to trace over a sketch or (see fig. 3) and record the x-y coordinate pair of any point onto a magnetic tape whenever a micro switch is activated. The pictorial figure to be copied is placed on an 18 × 40 inch table, and the shape is traced out manually with a free moving metal sighting ring wired to a high frequency source. An automatic servo system beneath the table surface accurately follows the inertia-less ring, and feed position signals to the magnetic tape drive with a resolution of 0.1 mm. An auxiliary 16 switch keyboard permits digital input to precede each pictorial group and assign it to a particular stack which may be referenced later. A processing program punches cards from the tape in the appropriate format for either HICAMP or HICAMPER, so that the figure can be manipulated under animated control. The former method for the procedure described above was to sketch the figure on cross hatched paper, read off the coordinates visually, and keypunch this data onto cards. The digitizer reduces the time involved in this process by as much as 2 orders of magnitude!
Stereoscopic animations can be produced by creating 2 slightly divergent views of a three-dimensional object using HICAMPER. Two viewing points are chosen at approximately the interpupilary distance (about three inches) apart, and perspective views corresponding to both left and right eye images are displayed on the crt screen (see fig. 4). When viewed through an image splitter (the author uses a pair of weak binoculars sighted from the objective lens end), an illusion of three-dimensional sight is perceived. The illusion seems especially real when the object is programmed to move about. This method, of course, can be extended to movies, but the position of the viewer is critical in the stereogram method above, so an anaglyph technique is used. Both left and right component images are superimposed on the film, but each is exposed through a separate polaroid filter. Each person in the audience wears a pair of corrective polaroid filter glasses to fuse the images together.
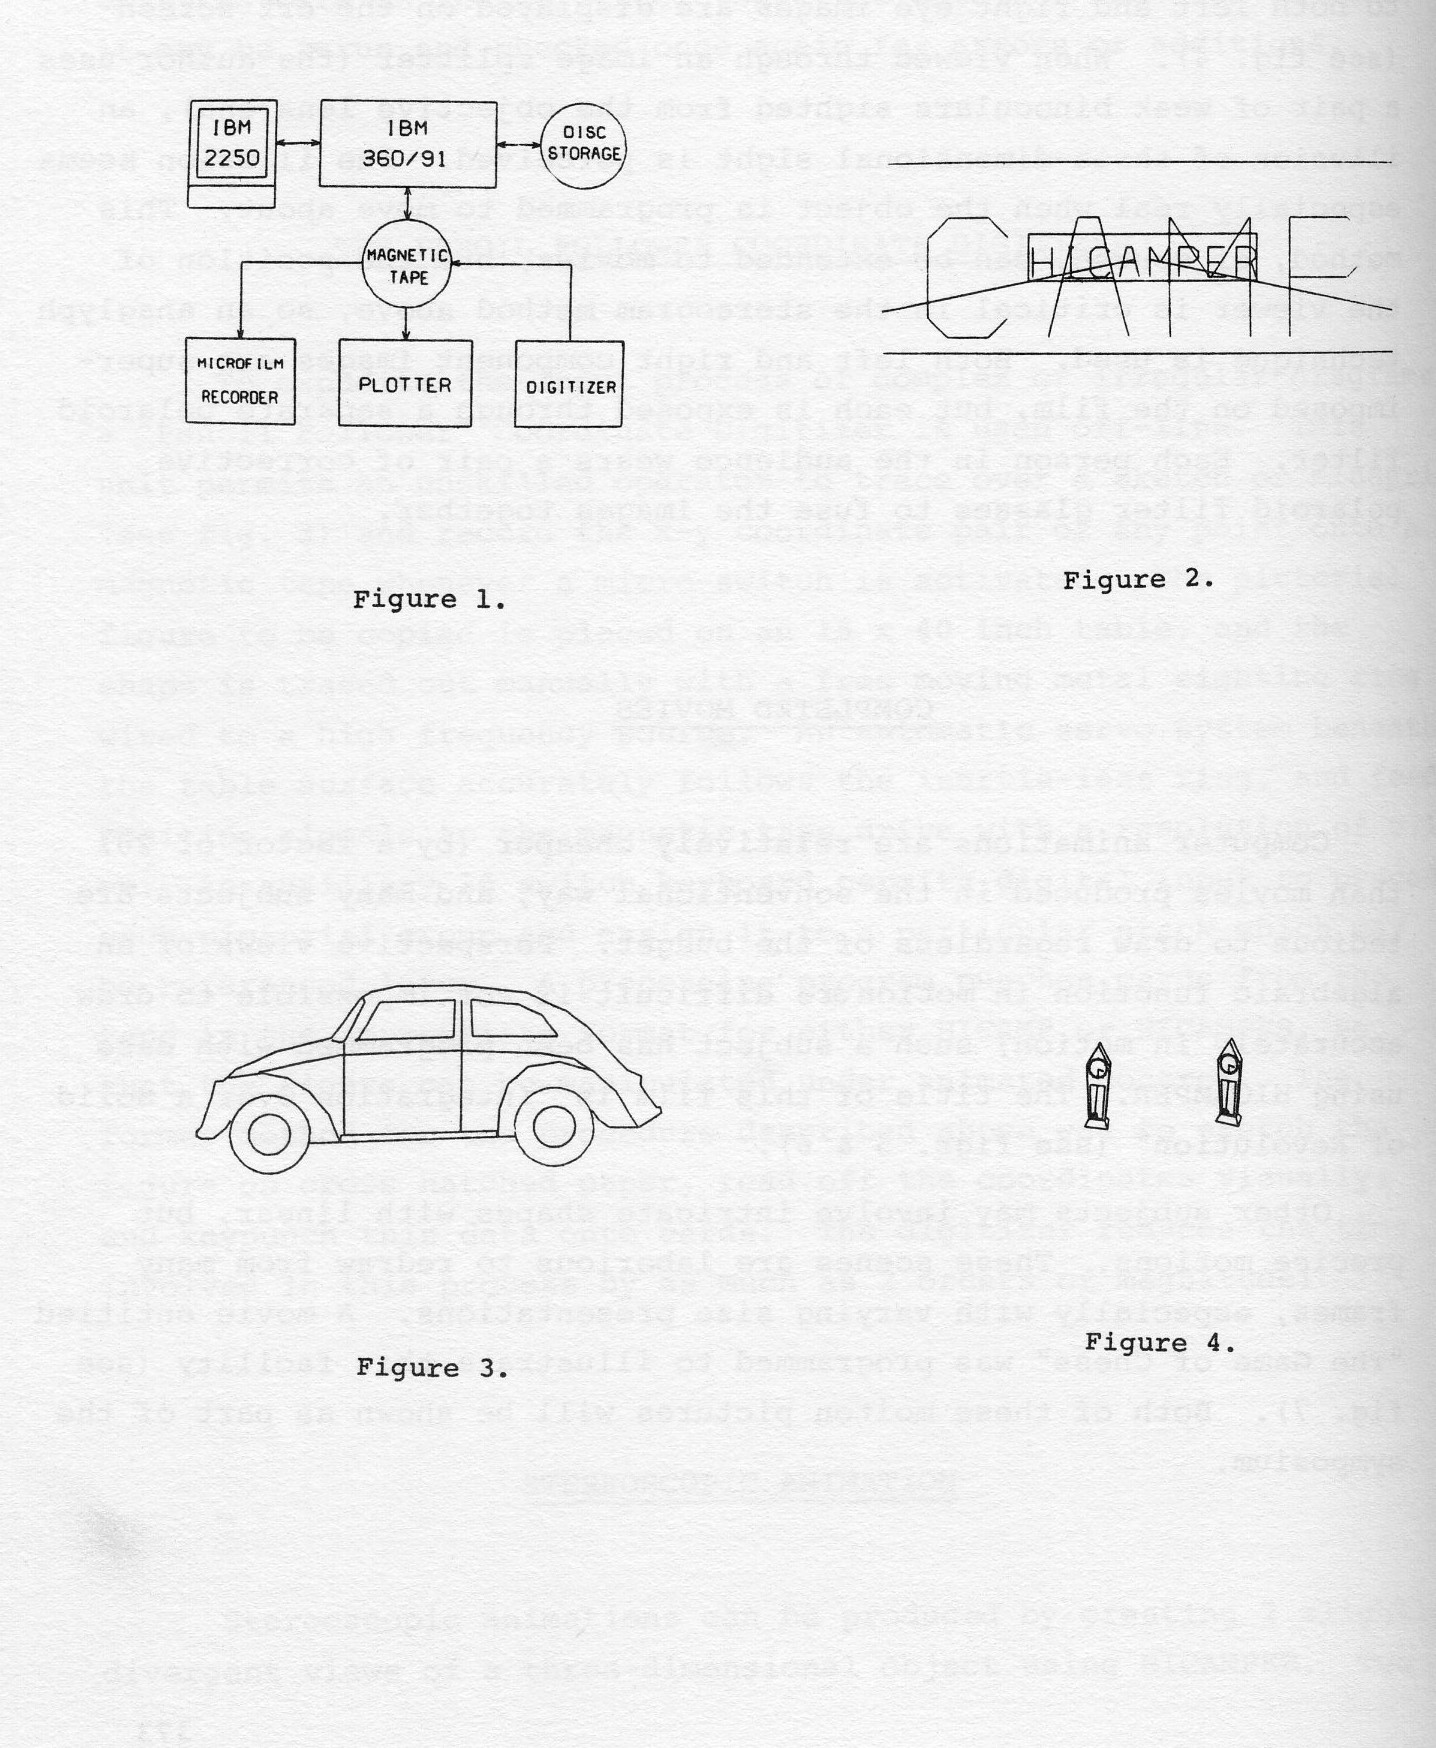
Computer animations are relatively cheaper (by a factor of 20) than movies produced in the conventional way, and many subjects are tedious to draw regardless of the budget. Perspective views of an algebraic function in motion are difficult if not impossible to draw accurately in motion; such a subject has been programmed with ease using HICAMPER. The title of this film is Integration Over a Solid of Revolution (see figs. 5 & 6).
Other subjects may involve intricate shapes with linear, but precise motions. These scenes are laborious to redraw from many frames, especially with varying size presentations. A movie entitled The Game of Chess was programmed to illustrate this facility (see fig. 7). Both of these motion pictures will be shown as part of the symposium.
1. Anderson, S.E,, A Graphical Programming Language for Computer Generation of Incremental Plots and Animated Motion Pictures, Master's Thesis, Syracuse University, 1968.
2. Anderson, S.E., C.A.L.D. and C.A.P.E.R. Instruction Manuals, Tech-Report TR-67-6, Syracuse University Electrical Engineering Dept., Syracuse, New York, 1967.
3. Anderson, S.E., A List Processing System for Effectively Storing Computer Animated Pictures, UAIDE Proceedings, Oct. 1968, pp. 205-219.
4. Weiner, D.D. and Anderson, S.E., A Computer Animation Movie Language for Educational Motion Pictures, Proc. of the FJCC, AFIPS, Vol. 33, 1968, pp. 1317-1320.
Two-dimensional information that is electronically captured, copied, multiplied, distributed, stored or retrieved, falls in either of the following two categories:
Corresponding to this classification, there seem to exist two technologies just loosely coupled with each other: computer technology, in particular computer graphics, and video technology, that is TV broadcast, video recording and play/back, etc.
Computer graphics is characterized by the construction and display of abstract information structures - either text or some line drawing, i.e. abstractions of the physical world. On the other hand video, having its roots in entertainment, captures the physical world as is, indistinguishably photographing life and our environment, whether man-made or not, in motion. Via the associated communication facilities, video information breaks down spatial and cultural barriers. In fact, visual information distribution via electronics is spreading so much that some people think it entirely possible to raise a new well-educated generation without ever using books. One really wonders whether this conjecture is just a futuristic idea or a sound projection based on a new methodology.
Our purpose here is, of course, not just to sell the idea of video, i.e. video beyond entertainment. What we would like to propose is to start, as soon as possible, resolving the differences between computer generated displays and the displays of real life. Fortunately, this is not as difficult as it seems: with TV raster scan imaging, computers can display all kinds of information, including line graphics. It is important to note, however, that the contrary is not true. In order to illuminate the case, we briefly mention a videographics system successfully marketed by IBM's Federal Systems Division. One version has A/N only, another has limited graphics, a third full graphic capability. In some of these applications, the system allows for the display of line drawing and includes graphics input devices like joy sticks or tablets as options. The capabilities offered are almost identical to standard computer graphics devices. From the computer's point of view, the graphics subsystem appears to be indeed a standard device since a scan converter is used to generate raster scan coded images. The scan converter in this system is a core memory having as many bits as are needed to create an image of acceptable resolution (for 525 line TV, this would correspond to roughly a quarter of a million bits). Thus the computer constructs images as if for a line drawing device, but the device itself is a standard TV monitor, essentially identical to your home set. Raster scan coded images are stored on packs of a disk storage acting as refreshing buffer for the terminals.
This approach first of all offers the advantage of being compatible with standard TV techniques. Since the display device is a TV monitor, signals can be mixed at the antenna terminal. These signals can either come from a computer or from a camera creating simultaneous layers of information on the screen. The growth into grey scale or color display is straightforward: an increase in the core memory capacity would accommodate these expansions. Switching from a black background to white is extremely easy and so is the computer control of the layers of information originating from different sources. Images can be stored, shared and distributed among users, using computer control by refreshing many devices from the same buffer or vice versa. Since mass produced devices are used, videographics has a definite cost potential as it gains acceptance. From the application point of view, the real advantage may be the possibility to handle area graphics. This is particularly important in computer generated animation and the computer display of simulated physical phenomena, applications not particularly suited to drawing representation.
There are, of course, disadvantages. The scan converter is expensive, and so are the associated character and vector generators. At the present time, the special hardware (including the scan converter) has to be time-shared by a certain number of display devices in order to be cost competitive. This brings about some interference with the expected response time of individual terminals. Nevertheless, one can predict the time when the special hardware becomes much cheaper and dedicated to a smaller number of terminals. Another disadvantage is that, as opposed to line drawing graphics devices, the quality of lines with videographics is lower since the drawn lines are arbitrarily subdivided by the horizontal raster lines. This simply means that line drawing graphics will remain with us in the future, particularly for applications where high quality drawings are mandatory.
In summary, we believe that the merge of the two technologies should start from both points of view of system architecture and application methodology. Cross fertilization as usual breeds new and unexpected ideas.
The remarks I would like to make concern the use of an on-line videographic medium in producing a finished presentation of graphical material. The actual content of the videographic presentation in question resulted from work done at Harvard University under contracts with IBM Research and NSF in which some of the graphical techniques of an interactive computer system, entitled THE BRAIN, were being documented using the system itself. The graphical output was generated on a Tektronix storage scope-scan converter unit which allowed simultaneous video recording on our 1-inch Sony video recorder.
Considerable time and effort was spent in preparing the graphical content of the presentation by programming the computer system to generate successive graphical frames; but the important point to note is that this preparation of the computer system would have been necessary whether the recording of the material was made on videotape, on Polariod slides, on the CALCOMP plotter, or on a movie film. And so one need only be concerned with the relative economics, time, and dynamics of the recording media after the computer system has been set up with the content of the presentation.
The 16 mm film which accompanies this paper is a direct copy of the actual videotape recording to which I have been referring. In fact there are places in the film where it is evident that this is a copy of video output; but what should be noted from the film is the dynamic value of presenting the graphical material in this form and its ability to get the point across as compared to a corresponding slide presentation or paper report on the same material.
During the early stages of working on this presentation, a version of the script was reviewed by some of the people in the IBM graphics research group who commented very politely, Yes - that's very nice. - but who, upon seeing it coupled with the actual graphic presentation via the computer remarked with much more enthusiasm, Now I really understand the points that you're trying to make!. So it was clear that the content of the presentation required a strong graphical boost in order to attain some degree of clarity. But what made the construction of the report a relatively easy and impressive job was the combination of the graphics with the video.
Once the content of the video script had been decided upon, it took a total of two hours recording and editing time to produce the final 30-minute videotape. Thus two hours of my time plus the computer time used during the recording, and the cost of the videotape reel comprised the total cost of the actual recording itself - or on the order of $2 per minute of videotape output. This figure can then be contrasted to the corresponding costs of producing a film once the script has been programmed into the computer.
Considering the convenience of viewing immediately what is being recorded, the cost factors involved, and the fact that the videotape can be reused, added to the edited, it seems logical that the combination of video with the graphics has significantly more to offer than does film with the graphics - at least on the non-professional level.
And yet working with the videotape during developmental stages of the graphical presentation does not preclude the possibility of eventually producing a film to allow for wider distribution of the end product. The film which accompanies this paper was copied from the videotape at approximately $10 per minute for the initial answer print and $50 total for each subsequent copy.
I would like to stress the fact that the production of the videotape recording - aside from suggestions and criticisms on the content of the material - was a one-man effort. This includes the computer programming, the audio script, and particularly the videotaping and editing. This is neither a pat-on-the-back nor an apology, but simply a statement that with this type of videographic setup it is possible for someone without any elaborate filming background and with no more video recording and editing knowledge than that gained by reading the instruction manual on how to operate the video recorder - can produce a presentable piece of graphical material at considerably less cost than a direct film and with considerably more editing flexibility than a direct film.
Given the appropriate content of the material, it is possible to significantly improve the dynamic effectiveness of the material over what might be obtained with slides or a paper presentation. And, lest I alienate forever all those people who believe The movie is the thing, one still has the option of turning the videotape into a film for wider circulation and availability.
The Moore School of Electrical Engineering, University of Pennsylvania, entered the field of computer animation in 1967 for the purpose of producing a 30-minute educational film on Electromagnetic Fields and Waves. The resulting three-color-and-sound movie represents the then state-of-the-art in computer animated film making. In his dissertation, Don Deily discussed the new techniques that were developed during the production of this film and suggested possible improvements in the animation process. Part II of Electromagnetic Fields and Waves is now nearly complete, and its production has embodied and extended many of these suggested improvements. The movie-making system now in use is significantly more advanced than that of two years ago.
In order to give a complete picture of how computer animated movies are made at the Moore School, we will first give a brief outline of the hardware involved, followed by an evolutionary overview of our software system. Next, we will give a more detailed look at the software extensions, discussing specific features that we feel make our system particularly effective. And, we will conclude with some remarks on the results of using this system and our goals of the future.
The interactive movie-making system operates on a computer complex consisting of:
The Spectra 70/46 is a virtual memory, paged, time-sharing system. Our installation has 2 million words of virtual memory, eight 590 disk drives (equivalent to IBM 2314), four 9-track tape drives, and a communications controller. The Spectra 70/46 has a (fullword) cycle time of 2.88 microseconds, a floating-point add time of 27.69 microseconds, and a floating-point multiply time of 186.55 microseconds.
Attached to the Spectra's communications controller are 6 teletypes, an RCA video data terminal, and the remote graphics terminal (DEC-338). The graphics terminal is interfaced via a 201B dataphone over a voice-grade, 2400 baud, synchronous, full-duplex communications channel.
The DEC-338 is located remotely from the Spectra 70. The configuration of the display terminal includes:
The large computer handles most of the computation and all of the user's programming; it also contains the communications control software for interface with the DEC-338 and produces the final output tapes for SC4020 production. The display computer contains a fixed program to handle communications, all user inputs (typed, hand-drawn, or function key), and all output from the Spectra 70.
From its beginning in 1967 the purpose of the MOVIES project at the Moore School has been twofold:
The basic software used in producing the first Moore School movie, Electromagnetic Fields and Waves: Part I, was the SCORS package. This was a minimal interface between a FORTRAN program and the SC4020 microfilm recorder. It included the ability to do scaling, text, and line drawing in FORTRAN, but the only form of output was a magnetic tape for the SC4020. With this system, the only way to check the correctness of images was to have the tape processed into film and then view the film.
This form of output was immediately found to be inadequate, since it was both expensive and time-consuming, often introducing more than a week's wait for the film. A quicker output mechanism was introduced in the form of a rough picture on the computer's on-line printer. Using asterisks and periods, a crude outline of images could be seen immediately. Also introduced at this time was the ability to get a CalComp plotter drawing of any image. Using these two intermediate outputs, the programmers on the first movie were able to check the accuracy of their images and frames fairly conveniently and quickly.
Other extensions to the basic SCORS package were also made. A better form of windowing and scaling was added specifically to facilitate movie production. The ability to generate an image once and save the SC4020 code for later use was added. This saving process applied to both static backgrounds and entire sequences. The concept of a two-dimensional virtual camera was introduced and general purpose routines for moving this virtual camera were added. A very fast tape-output buffering program was written to decrease I/O wait time. The first movie was made with the basic SCORS package and these extensions.
During the development of this first movie system, it was obvious that the above extensions to SCORS were insufficient for a truly general movie system and, indeed, were probably insufficient to produce Part II of the Fields and Waves movie. At least four things had to be added to this initial system:
Between the production of the first movie and the production of the second, all four of these objectives were met. Joel Katzen wrote a three-dimensional virtual camera programming system that allows a programmer to define and position bodies in three-space, and to independently define and position a virtual camera in three-space. Working in concert with this programming system is the hidden-line system written by Dan Callahan. This allows for the removal of hidden edges of solid objects in three-space. Finally, routines were written to replace the CalComp output functions with DEC-338 output. This new output consisted of frames displayed on the CRT of the DEC-338 as the Spectra 70 was computing them. Added at the same time was the ability to store these frames on a DEC-tape. This enabled the programmer to view his images again, off-line from the Spectra 70, and without the need for re-computing.
With this last addition, the programmer, for the first time, was able to debug entire scenes without having them made into film. Now he could be certain not only that his images were correct, but also that the objects had the correct motions: individually, relative to one another, and aesthetically. This kind of debugging had been impossible with either line printer or plotter output. In addition, this debugging with the DEC-338 was faster and cheaper than the plotter output.
Having achieved a powerful computer-animated movie system within the Spectra 70 and successfully interfaced it to the DEC-338, the obvious next step was to convert the 338 from a mere passive output device to a truly interactive computer animation terminal. Several new routines were added to the software on the Spectra 70 to provide a flexible interface to the communications software that already existed. Then a fixed program was written for the DEC-338. This program handles all of the previous output functions of the 338 and how handles the various inputs from the user, too, providing him with a convenient method of interacting with his own program.
The resulting system for making computer-animated movies is very usable: the programmer is given a large and powerful array of software with which to define and manipulate his scenes, and he is given the ability to interact directly with these scenes as they are being produced. We think, that the quality of our second movie and the effective way that it was produced will further demonstrate the viability of this interactive, animation-terminal approach to movie making.
The first major addition to the extended SCORS software used for the first movie was the three-dimensional conceptual camera system. The objectives of this system were to provide a conceptual camera that was a reasonable approximation to its physical counterpart, and to provide a system for its use employing conventional terminology that would be easily learned.
The resulting conceptual camera system allows a user to define figures in three space, and to manipulate the conceptual camera around them. This is done by having one fixed reference coordinate system to which both bodies and camera relate. There are then ten independent body coordinate systems and one camera coordinate system. Any number of objects may be defined within one body system, but only ten completely independent body systems may be used. Objects are defined point-by-point with respect to a particular body system, and the body and camera systems are defined with respect to the fixed reference system.
Having defined his objects and their positions and the camera and its position, the user can now specify both body motions and camera motions. The basic body motions available are XTRANS, YTRANS, ZTRANS, ROTX2Z, ROTY2Z, and ROTY2X. These motions may also be combined to produce more complicated composite motions. The basic camera motions available are those associated with a physical camera: PAN, DOLLY, TILT, CRANE, ZOOM, TRUCK, and ROLL. Again, these motions may be combined to produce composite motions. All of these motion names are the names of FORTRAN subroutines in the conceptual camera system that will produce the desired effect on the bodies and camera.
In addition, several camera subroutines are available to perform often-used special effect motions. These subroutines (motions) are DOLLYF, CRANEF, and TRUCKF, and they are used to translate the camera while it is centered on a particular body system. For example, in an ordinary DOLLY, the camera is simply translated either left or right, while the camera orientation remains unchanged. If, during the DOLLY, the camera is to remain centered on a particular body, it is necessary to do a compensating right or left PAN. This compensating motion is done automatically by calling DOLLYF. A similar compensation is done for the other following motions.
Two other camera motion routines are available: PATH and PATHF. PATH is used to have the camera traverse a particular path through three-space without changing its orientation during the course of the motion. PATHF is the corresponding following motion: the camera travels on the specified path, but the camera orientation is adjusted frame by frame to remain centered on a particular body. There is an analogous routine available for specifying the motion of a body along a particular path: PATHS.
Finally, there is the ability to have all motions be faired. That is, the camera and bodies will not reach the constant velocities associated with PAN, TILT, etc., instantaneously. Rather, they will undergo an initial acceleration and a final deceleration over 16 frames at the start and end. This is an aesthetic consideration that has proven very useful.
The second addition to the extended SCORS package was the ability to do hidden line calculations on bodies in three space. This work is an adaptation of the algorithm of Philippe Loutrel of New York University for the removal of hidden lines of convex polyhedra. It allows a user of the conceptual camera system to specify that his final output frames are to have the hidden lines of individual objects, and the lines hidden by occluding objects, removed. This requires specifying additional information such as vertices and connecting edges for all bodies.
As with the conceptual camera system, the hidden line computations are done entirely in FORTRAN and the implementation is meant to be easy to use by the movie programmer. Early results indicate that it is effective but rather slow. Much of this slowness, however, is attributable to the multiply and access time of the Spectra 70/46 and to the fairly inefficient code produced by early versions of its FORTRAN compiler.
The most recent addition to the computer animation software in the Spectra 70 is the facility for interaction with the DEC-338. This interaction is enabled by a few basic communications-handling routines that are used by higher level subroutines that a movie programmer may call. All of these higher level routines are written in FORTRAN IV, with only the physical-level communications programs written in Spectra 70 Assembly language.
There are two basic types of communications from the Spectra 70 to the DEC-338: character strings and 12-bit binary strings. The character strings are usually messages from the programmer or the system to the operator at the terminal; the binary strings are usually display commands to produce individual movie frames. Either type of message can be initiated by a user's program.
There is also software for messages from the DEC-338 to the Spectra: for interrogating the status of the communications interface and for interpreting messages received. Again, the DEC-338 can send either binary information or character strings. The usual message, however, is character strings to be interpreted either as data or control instructions. Typically, data is entered into a user program through the FORTRAN NAMELIST processor. Standard subroutines convert the information sent from the DEC-338 into proper NAMELIST format and then initiate a NAMELIST READ. Program logic is usually modified by changing the values of control parameters with another NAMELIST input string. This kind of interpretation is just one of the possibilities: any user program may bypass the NAMELIST operations and interpret each character string directly. Thus a user is completely free to structure his input in any way he chooses.
The software system in. the DEC-338 consists of three interconnected programs for doing three separate tasks:
When a user wishes to use the DEC-338 as an interactive animation terminal in conjunction with the Spectra 70, the Interactive Movie Monitor Program (IMMP) is loaded and started. The IMMP is a fixed program designed to allow easy interaction between the movie programmer and his program running in the Spectra. It is capable of handling user inputs from light pen, function keys, and teletype and transmitting them to the Spectra. It will also receive and process all outputs from the Spectra, including messages and display processor instructions.
Control of the IMMP's functions is through the twelve pushbuttons provided with the DEC-338. When started, the IMMP waits for the first user command. This may be an interrogation of the Spectra 70 for a message, an indication that a message will be sent from the DEC-338, or a command to wait for the Spectra to send something. Once communications have been established, the course of interaction is jointly determined by how well the program is performing in the Spectra, how often that program requests an input from the user at the 338, and how often the user at the 338 wishes to interrupt his program to change something. Therefore, the IMMP is not programmed to expect a standard interactive sequence; but, rather, depends on the user's use of the pushbuttons to control its actions.
Several of the IMMP's actions merit additional comment. First, it can selectively store movie frames received from the Spectra onto a DEC-tape. In addition, these frames are stored in a compressed format that allows them to be viewed (via the PLAYBACK program) at speeds up to 24 frames/second and higher. At all times, the user has control over which (if any) of the frames the Spectra sends will be so recorded. The algorithm used in the compression process makes a frame-to-frame comparison of the information contained in successive frames and only stores on tape the differences between the two frames. It has been able to reduce the amount of data needed to reproduce a given frame to 10% of its original size. Typical compressions are from 50-20% of original size.
Another interesting IMMP action is its handling of teletype input and output. Any user messages typed into the IMMP are handled as completely free format: there are no restrictions on what may be typed or where. In addition, there are limited editing features available to modify what has been typed in before it is sent to the Spectra. Output messages from the Spectra can be either displayed on the display scope, or they can be printed on the on-line teletype for a hard copy record of the interaction.
Finally, the IMMP is able to call on the PLAYBACK program while still on-line to the Spectra 70. This enables the user to view an entire sequence of frames at projection rates (or slower) to be sure that the motions he has specified are aesthetically correct, in addition to being spatially correct. He can then return to the IMMP and resume his interaction with his program. This feature has been found to be very useful in debugging long sequences and scenes in a movie.
When the user wishes to utilize the DEC-338 as a movie playback system, the PLAYBACK Program is loaded and started. PLAYBACK is a program that transforms the DEC-338 into a special-purpose movie projector using DEC-tapes as input (film) and the CRT as output (screen). The program can show up to 8 movie scenes from one tape, at speeds from single frame to better than 24 frames a second. PLAYBACK runs stand-alone or may be called as a subprogram to the IMMP in conjunction with the Spectra (Spectra programs remain idle while waiting for the return to the IMMP). Like the IMMP, PLAYBACK depends on the use of pushbuttons to control its actions.
A maximum of 8 individual movie scenes may be stored on a single DEC-tape (stored in compressed form by the IMMP). Each scene may be accessed and played back individually or in sequence starting at a selected scene. Sixteen different frame rates are available; the rates are selected by pushbutton. These rates are (in frames per second): single frame, .05, .1, .2, .33, .5, 1, 2, 4, 5, 8, 10, 20, 24, 33, and tape speed. Tape speed is the upper limit on movie playback rates. At tape speed, the movie frames are projected on the CRT as fast as the tape can transfer them.
The PLAYBACK program was adapted from a scheme implemented by Noel Bernstein; the compression and coding scheme is easily adapted to any computer. Our current system compresses frames by using a word-by-word difference technique. When a sequence of words does not change from one frame to the next, it is not stored on tape. Instead, only sequences of changed words together with their locations and word count are stored on tape. PLAYBACK expands the data on tape by constructing the new display file from the preceding file until a word count and location are encountered. Then, the specific number of changed words are taken from the tape data and added to the new frame display file.
Other control words are also stored on tape. There is a control word and word counter used to repeat a frame several times. There are control words to indicate the end of a frame, the end of a scene, and the end of the movie film. The PLAYBACK algorithm uses these control words for positioning and timing information at run time.
Another interesting feature of PLAYBACK is its ability to automatically trigger a single frame camera by setting panel switches on the DEC-338- At the conclusion of each frame's display, a digital-to-analog converter can be triggered to cause a single frame movie camera to take from 1 to 7 shots of each frame. The frame rate setting of the pushbuttons is used to time out between frames to allow the persistence of the screen to die out.
Finally, PLAYBACK can call on (or return to) the IMMP. Once the user has finished checking his scenes on a movie tape, he can exit to the IMMP to resume or initiate interaction with the Spectra.
The ANIMATOR system, designed by Patti Talbot, is a collection of programs that enables anyone, not just programmers, to produce movies via computer. The system consists of six subprocessors that together allow a user to define and produce a complete movie segment. There is no formal programming language to learn in order to use ANIMATOR. Rather, control of the system and subprocessors is by pushbutton and light pen.
The first function of ANIMATOR is the drawing of pictures. This is done by sketching on the face of the CRT with a light pen and tracking square. Several constraints are available, such as horizontal and vertical line drawing, and lines may be entered through the teletype, if desired. Each drawing may be given a name and stored in a DEC-tape Image library. These library images may then be used in other pictures to form composite pictures, or they may at any time be recalled, changed, and stored again.
The second function of ANIMATOR is the definition of motions. Motions are defined independently of any picture, and may thus be bound later to any picture. The motions currently available are rotation, translation, and zooming. It is also possible to combine the motions in two ways: sequentially and in parallel. Sequential combination results in first one motion being applied for a certain number of frames, and then the next; parallel motions all occur in each frame. A typical parallel motion is that of a wheel rolling: the wheel is both translating and rolling every frame.
Defined motions and pictures may be combined to form movie scenes. A scene consists of one or more pictures and their associated motions. Many scenes may be further combined to form entire movie segments.
Both movie segments and scenes are produceable elements. That is, the user can request that any scene or movie segment he has defined be transmitted to the Spectra 70 for intermediate (debugging) production or final (SC4020) production. This is done by passing the output of the ANIMATOR system to a special IMMP program which transmits it to an acceptor program in the Spectra. This acceptor program then expands the scene and movie segment definitions into actual movie sequences by applying the motions to the pictures a frame at a time.
If the user wishes to see his scene immediately, he requests that the output be sent back to the DEC-338. Then he can use the PLAYBACK program to analyze his results just the way he would if he were running interactively with a FORTRAN program. In order to make changes, however, he returns to the ANIMATOR system instead of communicating with the program running in the Spectra. Thus, the Spectra is not used at all while he is thinking and making changes. After he has made all of the necessary corrections, he then re-initiates communications with the Spectra for another production run.
Several sequences in Part II of the Fields and Waves movie were produced using this system.
The production of Part II of Electromagnetic Fields and Waves has given us considerable experience in the use of the interactive movie making system. This experience makes us believe that the system we have is perhaps the best available for making educational films by computer. Independent of the interaction, the movies system represents an efficient, flexible, and powerful way to make a high-quality film. The addition of the interactive animation terminal greatly simplifies the debugging process and can be useful in the creative process also.
There is, however, room for improvement. First, there is a need for a language developed specifically for movie production. The use of FORTRAN for the specification of images and scenes is clumsy at best. A more natural method, incorporated within a higher level language, would be very desirable.
Second, there is the need for more analog inputs to image and scene specifications. Hand-drawn figures are one example of analog input (which we already have); a second is the description of a motion by an analog device such as a tablet stylus or joy stick. This would eliminate the need for many a torturous time-dependent-function specification in FORTRAN and should be very easy to use.
Finally, it should be possible to carry out every phase of a scene's production, from conception to output tape, from the remote terminal. Except in the limited case of the ANIMATOR system, this is not currently possible with our system: there must be a FORTRAN source program at some point.
The realization of these three improvements is our goal for producing our third movie.
1. Bernstein, Noel: A Compression and Real-Time Movie Playback Scheme for the DEC-338 Computer, Proceedings of the DECUS Fall 1969 Symposium.
2. Deily, Don: Principles for Producing Computer Animated Motion Pictures, Ph.D. Dissertation presented to The Moore School of Electrical Engineering, University of Pennsylvania, Philadelphia, December 1968.
3. Katzen, Joel: A Conceptual Three-Dimensional Camera for Computer Animation, Master's Thesis presented to The Moore School of Electrical Engineering, University of Pennsylvania, Philadelphia, May 1969.
4. Loutrel, Philippe P.: A Solution to the Hidden-Line Problem for Computer-Drawn Polyhedra, IEEE Transactions on Computers, Vol. C-19, No. 3> March 1970.
5. Talbot, Peggy Anne: ANIMATOR - A System for Using the DEC-338 as an Input Terminal for Movie Making, Master's Thesis presented to The Moore School of Electrical Engineering, University of Pennsylvania, Philadelphia, August 1969.
The following is an outline summary of a talk on the evolution of computer animation as given at the UAIDE Meeting by Roger Nagel.
Computer animation is created by viewing static graphic images rapidly in time. Thus it is sometimes referred to as dynamic graphics. Because of the dependence on computer graphics, the early work of Sutherland in creating sketch pad is generally considered the first major development. While Sutherland was not motivated to create animation he did define the basic components of a graphic system and demonstrate the feasibility of dynamic graphics.
There is no clear decision on which of the many early computer generated films was the first. Certainly the people who were working on Stromberg Carlson equipment had a head start. However, the film which I feel is typical of the early works is the Orbiting-Satellite made by Zajack at Bell Telephone Laboratories.
In the beginning computer animation was made with very unsophisticated software. Generally available were
A typical film of this vintage was Pretesting environments by Alien Bernhaltz which was an architecture research film, achieving a 3-D effect through motion.
Lee Hendricks of Sandia Corporation was able to make a hardware modification to a 4020, and with the above kinds of software produce her color film Butterflies.
A host of computer animation's languages began to appear among them were
The above is of course only a representative list. The languages were usually extensions of a generally available computer language like Fortran.
Certain basic capabilities can generally be found within an animation language they are
The hidden line problem is to remove the lines from a wire frame picture which should be invisible, e.g., At the 1968 UAIDE meeting several different solutions were presented. Among the systems solving the problem were.
These three papers appear in the 1968 UAIDE Proceedings.
Certainly an important development in computer animation is the capability of on-line interaction. The concept of an immediate response to commands and Viewing animation is real time adds an important ingredient to the process of creating animated films. Ron Baecker designed a system called GENYSIS which demonstrated the power of interactive animation. By providing a natural method of input to the animator and responding in real time to requests for animation, Baecker was able to train an artist to create good quality animated film in a short amount of time. The innovations of the GENYSIS system provide the basis for most of todays interactive graphic systems.
A number of T.V. quality animation systems have been developed and are being used at present. Among these are
The chief function of these systems is that the output picture is a raster of points on a grid of about 500 × 500. Also particular to this type of output is fully toned output as opposed to line drawings. This produces of course the most realistic looking animation. It is therefore used most in animating visual simulation.
It is possible to produce very effective computer animation in a hybrid computer system. This has been done to great success by Computer Image Company on special purpose equipment of their own design. The Adage corporation has also produced a number of hybrid computers useful in computer animation.
This paper discusses the application of micrographics for software documentation, dissemination, and retrieval. Software documentation is accomplished thru a computer program called DOCUMZ which evolved from six separate documentation aid programs. The DOCUMZ program has been used for about one year on some twenty different computer program developments. As a result of this experience, several attractive development philosophies have been isolated. These are presented with their good and bad characteristics. Because these philosophies are strongly dependent upon hardware, software, and internal procedures of a company final judgment is withheld. Software dissemination is accomplished thru traditional (hardcopy) reports and microfiche. Although microfiche is the preferred, vector, not all users (those who receive documentation) are equipped to use microfiche as the only form of software documentation. Software retrieval is accomplished by scanning the microfiche for frames containing SC4020 font. The digitizing of these pages recovers both the source data and the DOCUMZ control cards which are embedded in the source data as comments.
Software documentation has almost as many meanings as there are writers and users of that documentation. Even the general outline seems to vary even with a single individual. Many organizations that produce software have evolved general guidelines to documentation. Such guidelines tend to impose standardization. About two years ago the Autonetics Division of North American Rockwell combined six simple computer programs which assist programmers in producing graphical program documentation into a single integrated package called DOCUMZ. This program has two purposes 1) to encourage automatic graphical documentation, and 2) to give the software documentation a standardized appearance. At the present time some twenty programs have been documented using DOCUMZ.
In developing DOCUMZ the following programmer mode of operation was assumed: 1) The programmer creates the DOCUMZ data separately from the program being documented. 2) When the DOCUMZ data is correct and the program operational the DOCUMZ is merged with the program in the form of Fortran or PL/I comment cards. 3) The program descriptive test is written and typed, allocating page numbers to the DOCUMZ graphical output. 4) These page numbers are then added to the DOCUMZ control cards and the source program resequences. 5) The program source decks are finally processed by DOCUMZ to produce the graphical output for the final documentation. There are several features to the above mode of operation that are considered improvements over the previous mode which used six independent programs. First, the DOCUMZ control data becomes an integral part of the program. Once merged with a source program it need never be removed, second, by being included in the source deck as comments, it appears on all listings. It is therefore available for updating whenever the source program is changed. Third, comments within the code (outside of the DOCUMZ control data) may reference the DOCUMZ data to provide even greater continuity between the program and its documentation.
One of the moat useful documentation aids is the deck setup procedure called DKDOC which produces a graphical representation of a deck setup. The decks (see Figures 1 and 2) are enchanged by a dot pattern which tends to make them appear more solid than the individual cards. Each card contains 80 print positions and may be divided into any number of fields, represented by a vertical line with the card column number to its left. Conflict between the operating system and the system control cards shown in the deck setup is avoided by using the DOCUMZ tree form in which data is coded between columns 2 and 72. This also eliminates the need of using pseudo control characters in column 1 which are changed to the desired control character prior to output.
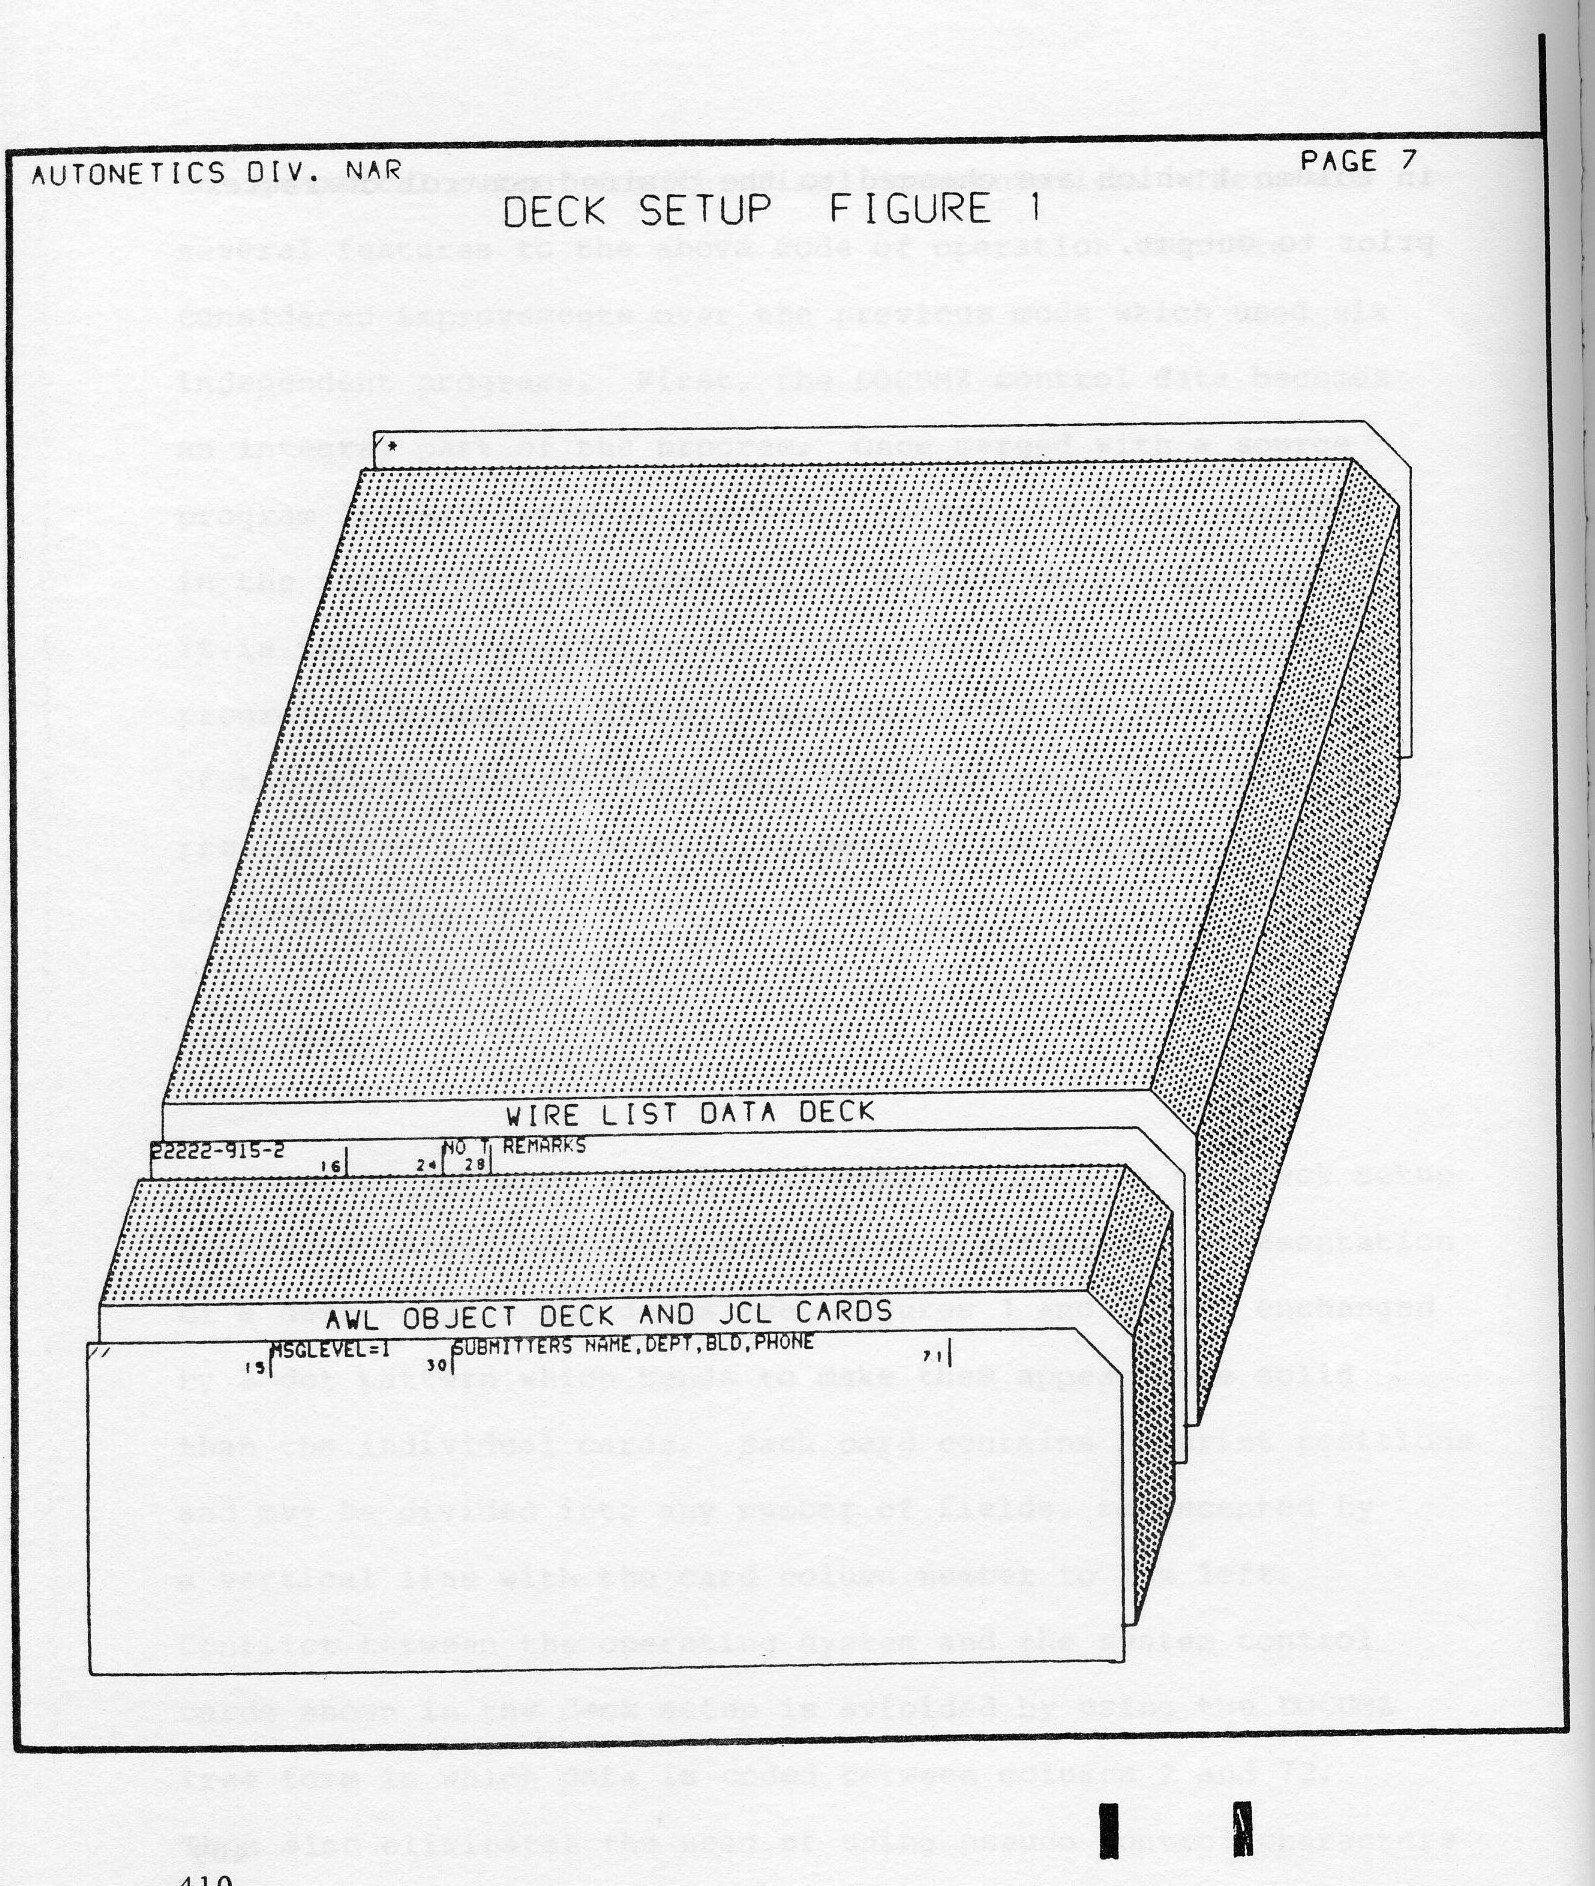
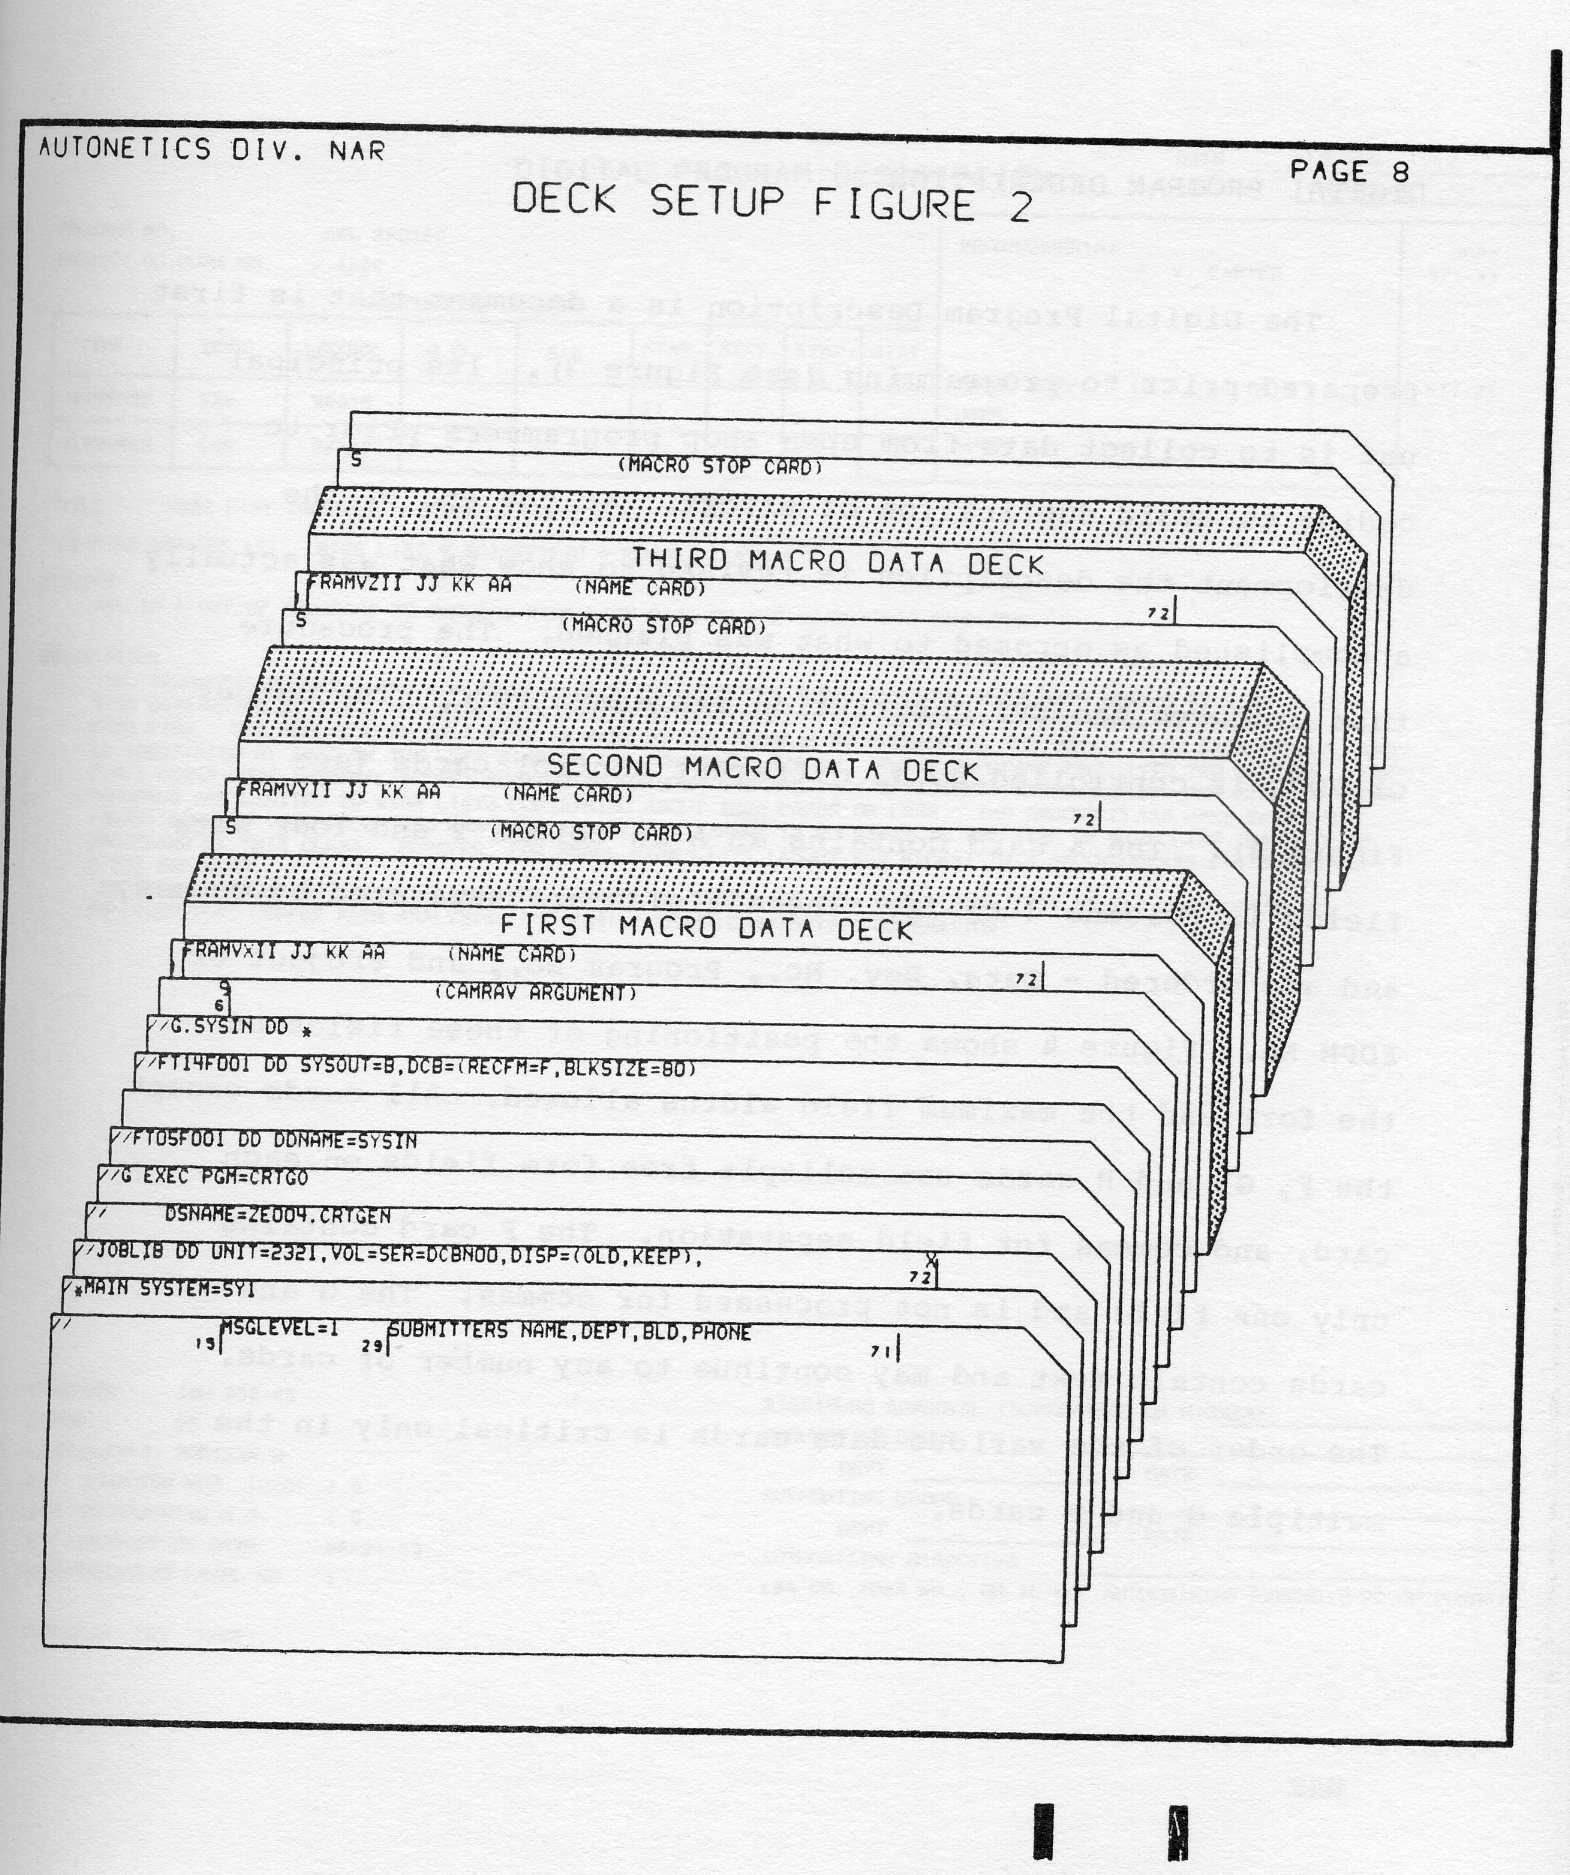
DIGITAL PROGRAM DESCRIPTION
The Digital Program Description is a document that is first prepared prior to programming (see Figure 3). Its principal use is to collect data from open shop programmers prior to coding to avoid duplication of effort. At the end of the development the description is revised to show what was actually accomplished as opposed to what was planned. The procedure that produces the CRT description was named PDOC. The output of PDOC is controlled by 13 different control cards (see Figure 4). The A card contains an A in column 2 and four data fields in columns 3 to 72. These fields are separated by commas, and are ordered - Data, Rev, No., Program No., and Project or EDPM No. Figure 4 shows the positioning of these fields on the form and the maximum field widths allowed. All cards except the F, G, and H cards use multiple free form fields on each card, and commas for field separation. The F card contains only one field and is not processed for commas. The G and H cards contain text and may continue to any number of cards. The order of the various data cards is critical only in the multiple G and H cards.
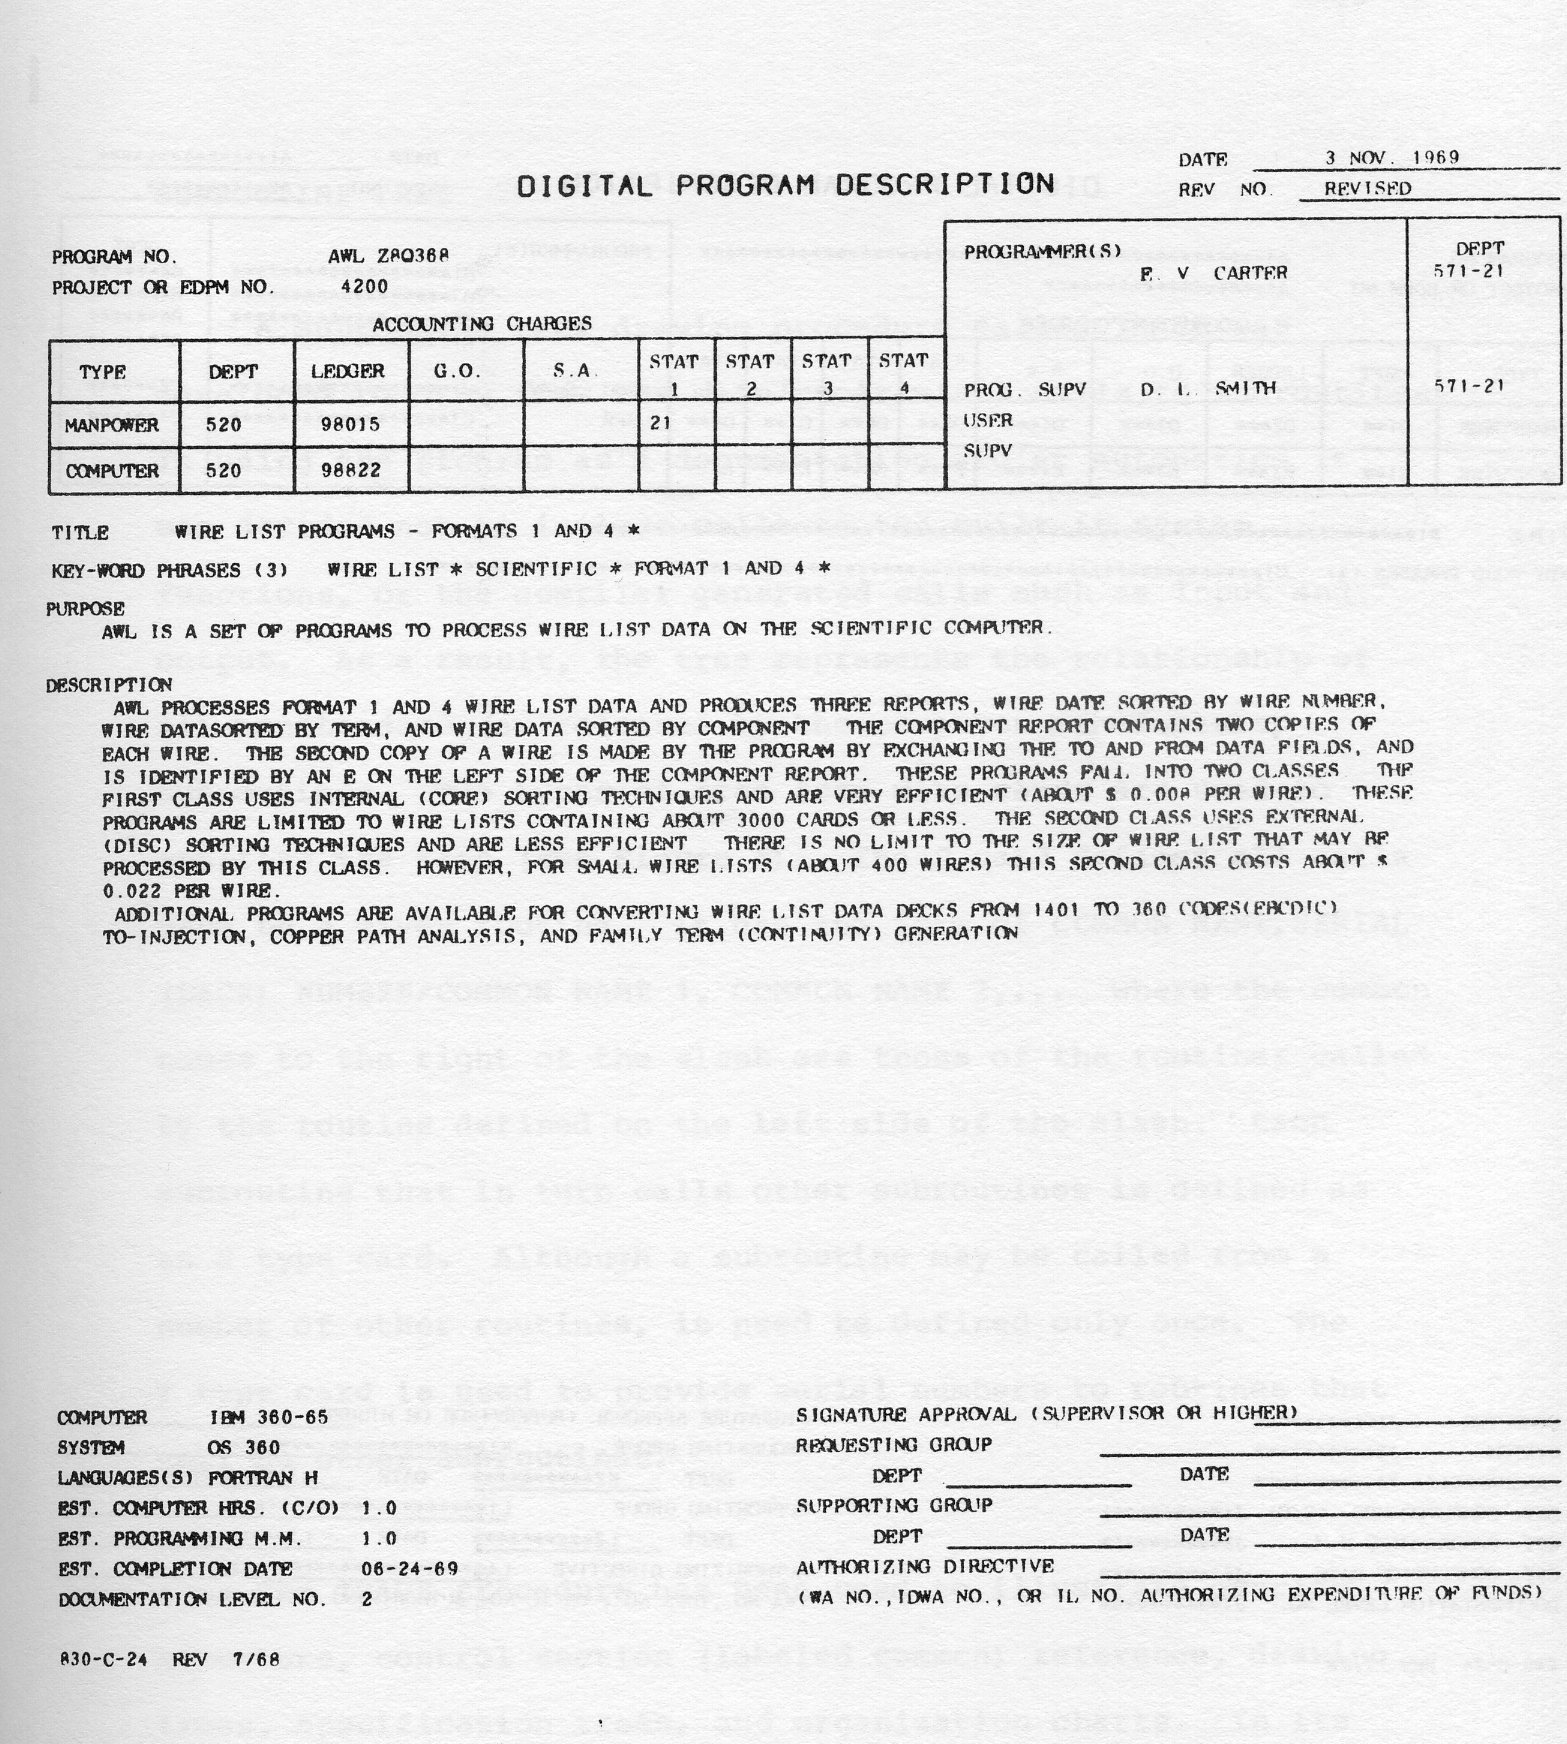
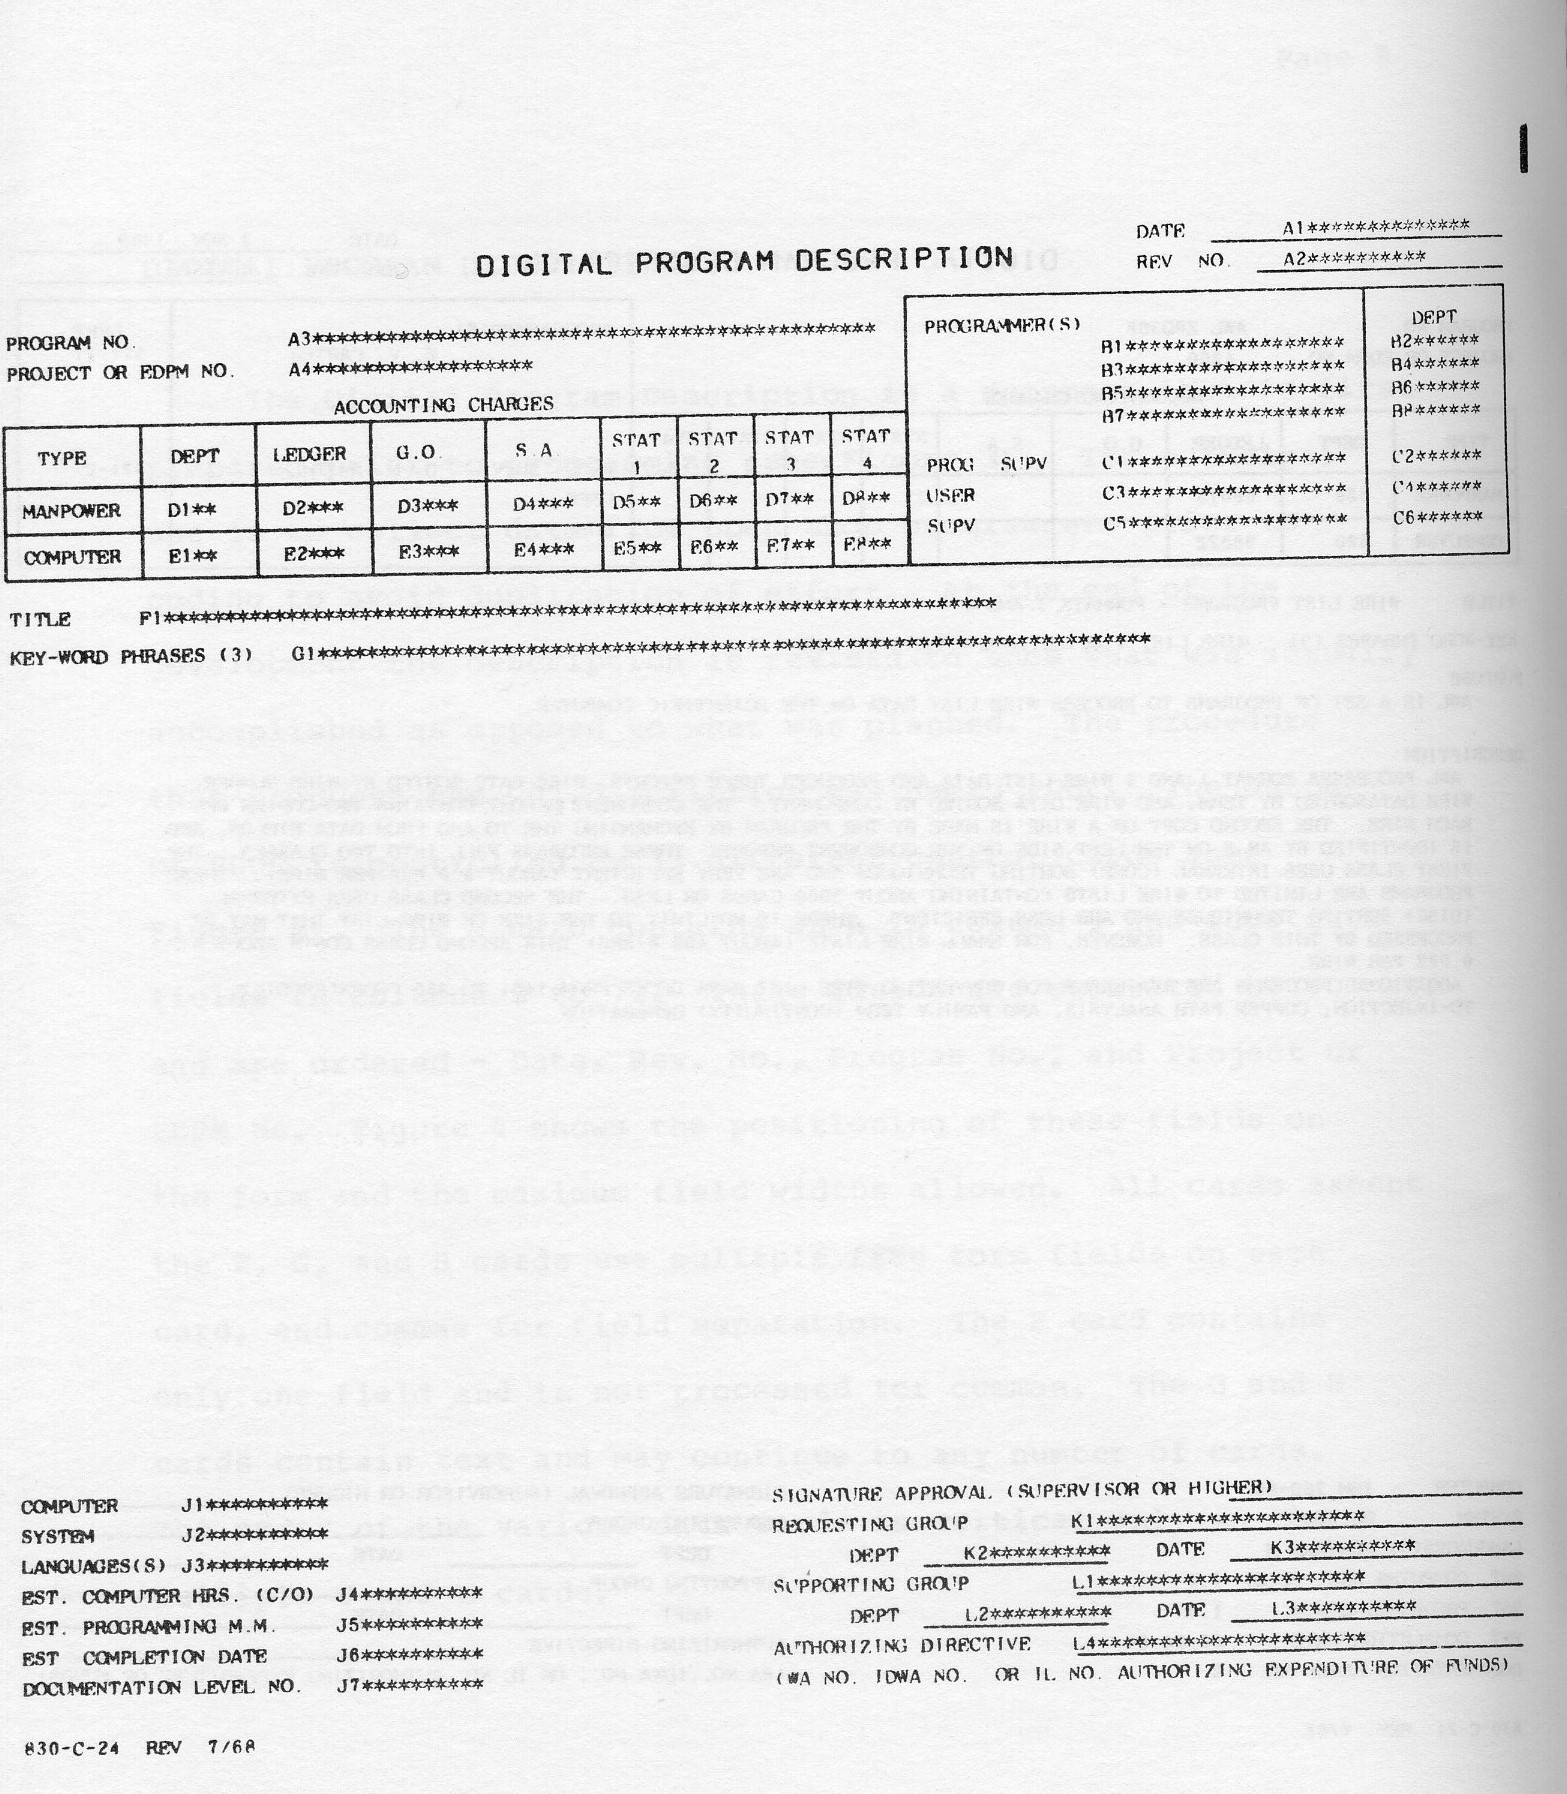
A subroutine tree drawing procedure called TRACE was developed to draw from the main program all calls to subroutines. In using the program as a documentation aid at Autonetics it was decided not to include calls to the built in system functions, or the compiler generated calls such as input and output. As a result, the tree represents the relationship of all nonstandard (as released by the computer manufacture) subroutines. Two types of free form data cards are used to generate the tree (see Figure 5). The S card defines all calls made by a given routine. It has the form of COMMON NAME, SERIAL (DECK) NUMBER/COMMON NAME 1, COMMON NAME 2,... Where the common names to the right of the slash are those of the routines called by the routine defined on the left side of the slash. Each subroutine that in turn calls other subroutines is defined as an S type card. Although a subroutine may be called from a number of other routines, it need be defined only once. The T type card is used to provide serial numbers to routines that call no other subroutines.
The TRACE procedure has been used to illustrate overlay structure, control section (labeled common) reference, drawing trees, specification trees, and organization charts. In its present form it is somewhat restrictive in that the common name is limited to eight characters, and the serial number limited to twelve characters. However data can usually be arranged so to produce a reasonable looking tree. Figure 6 is an example of an organization chart.
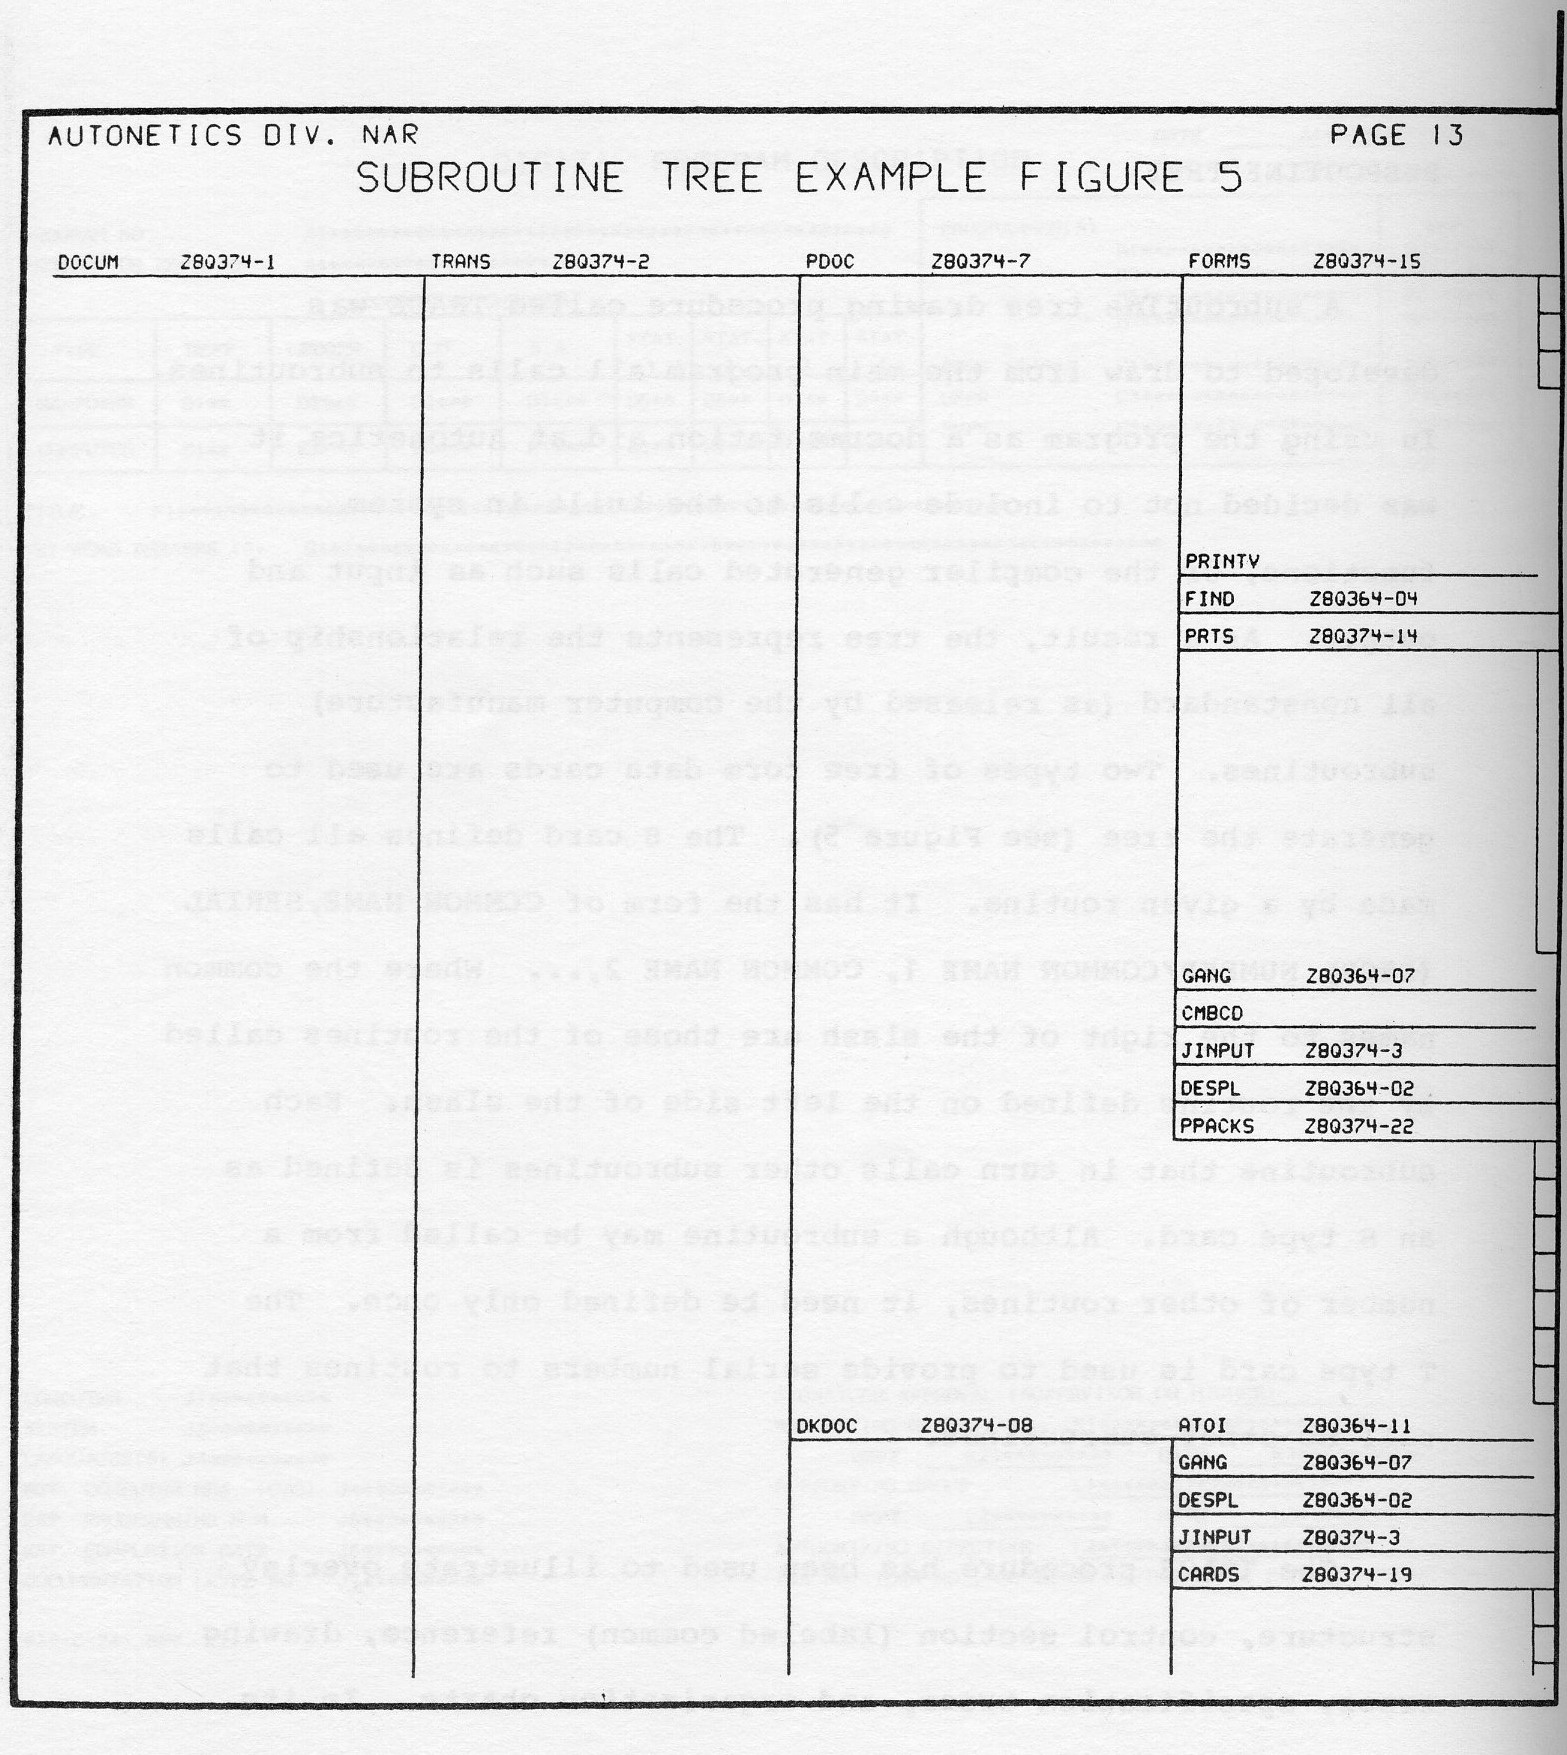
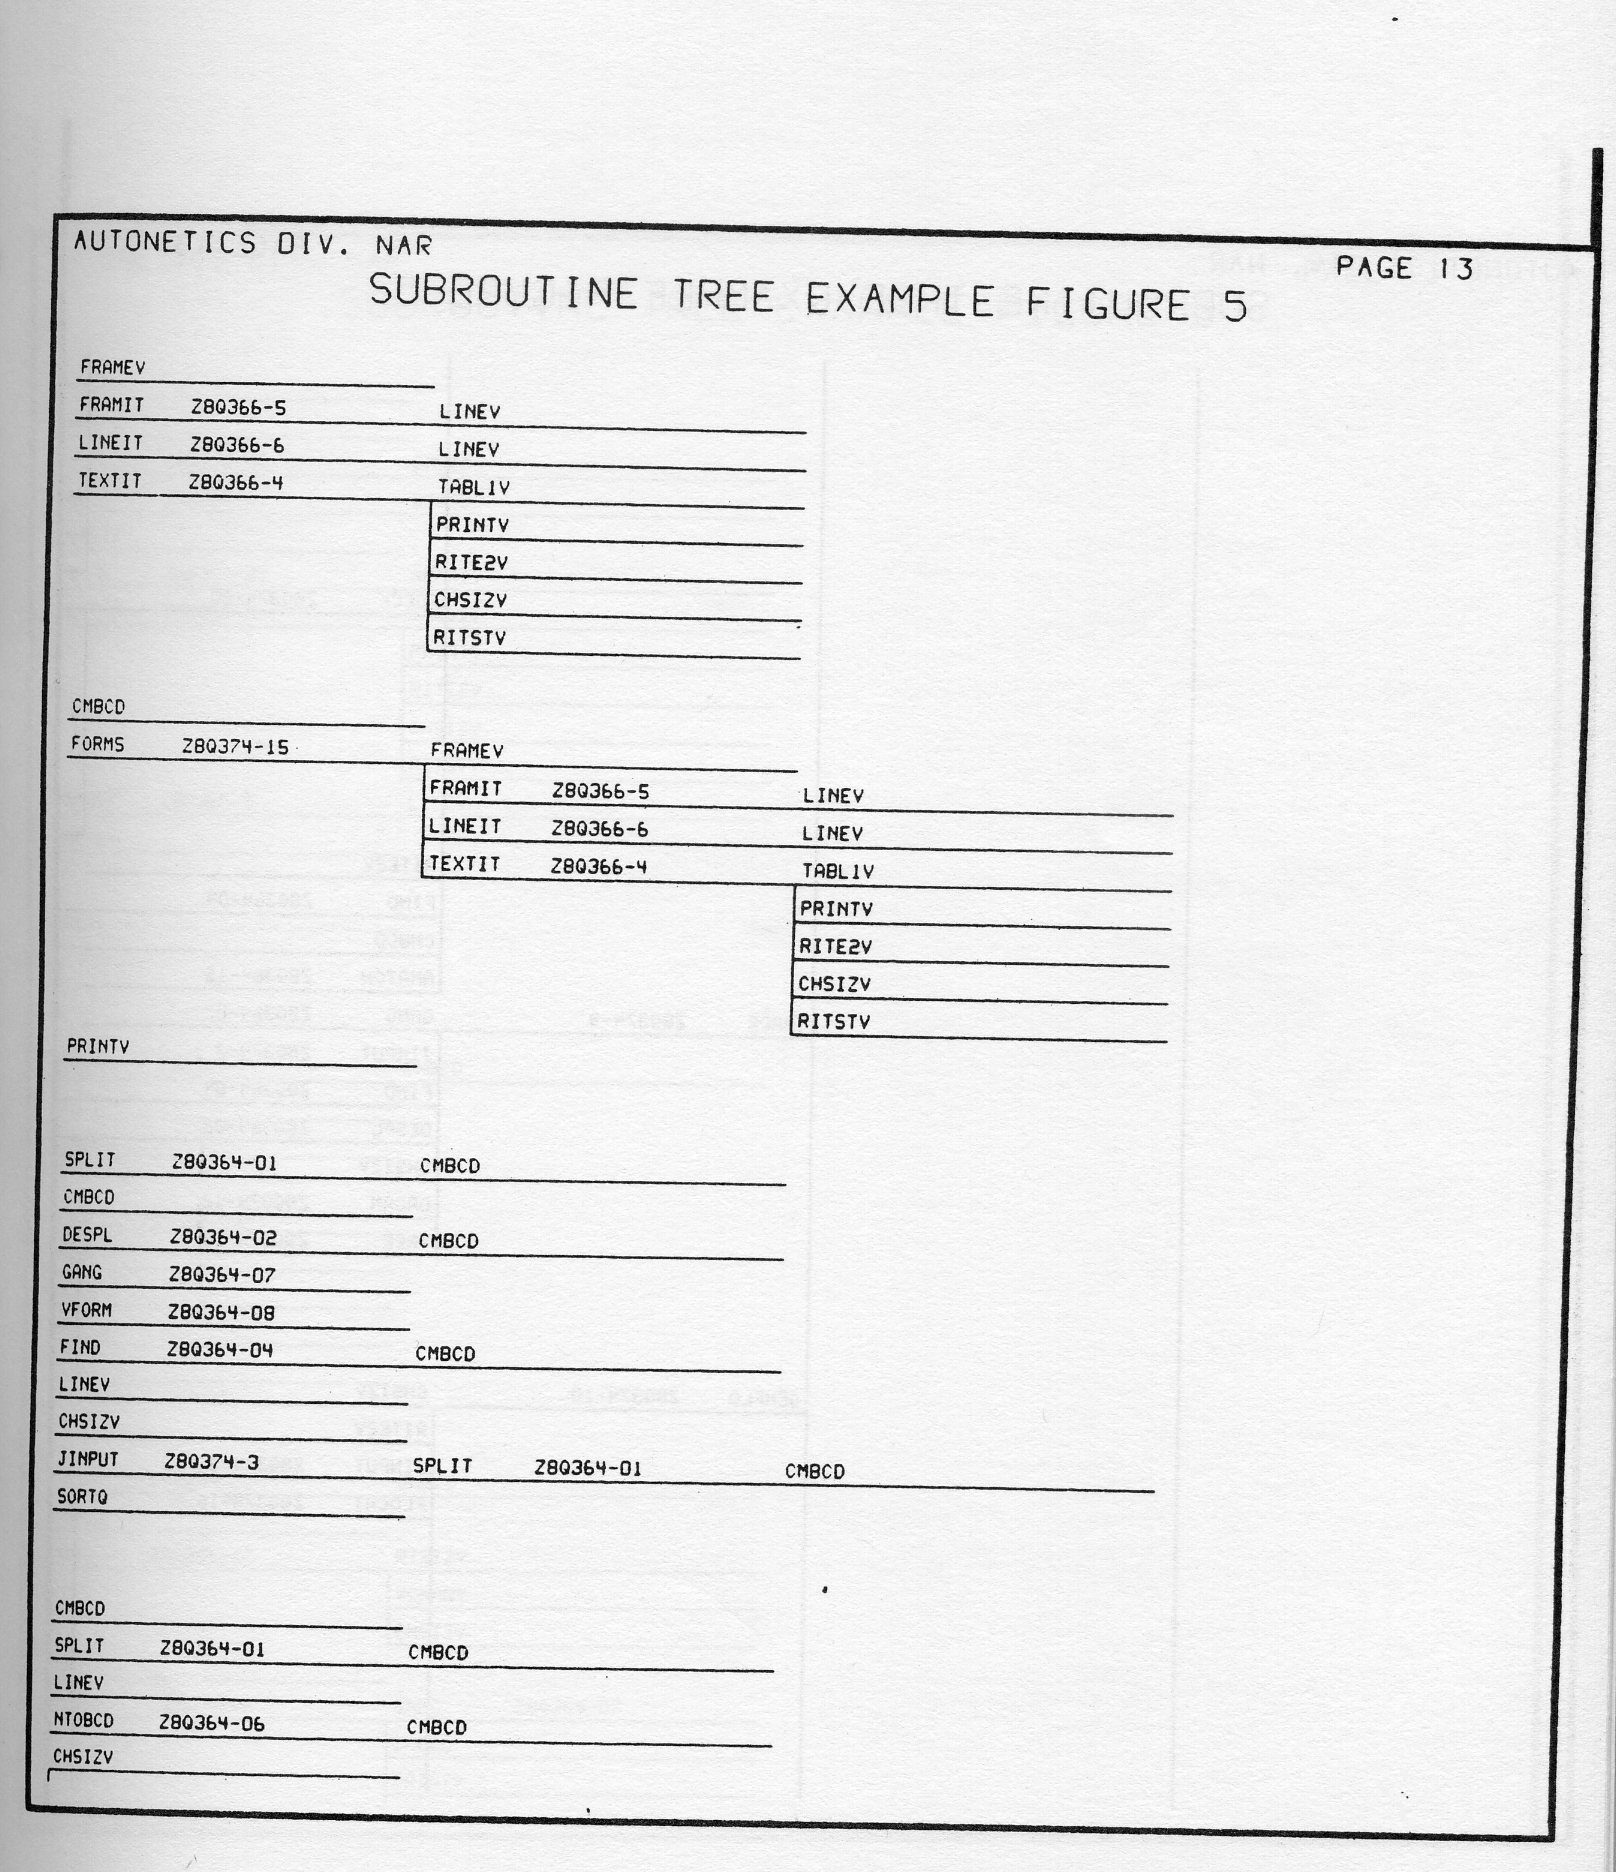
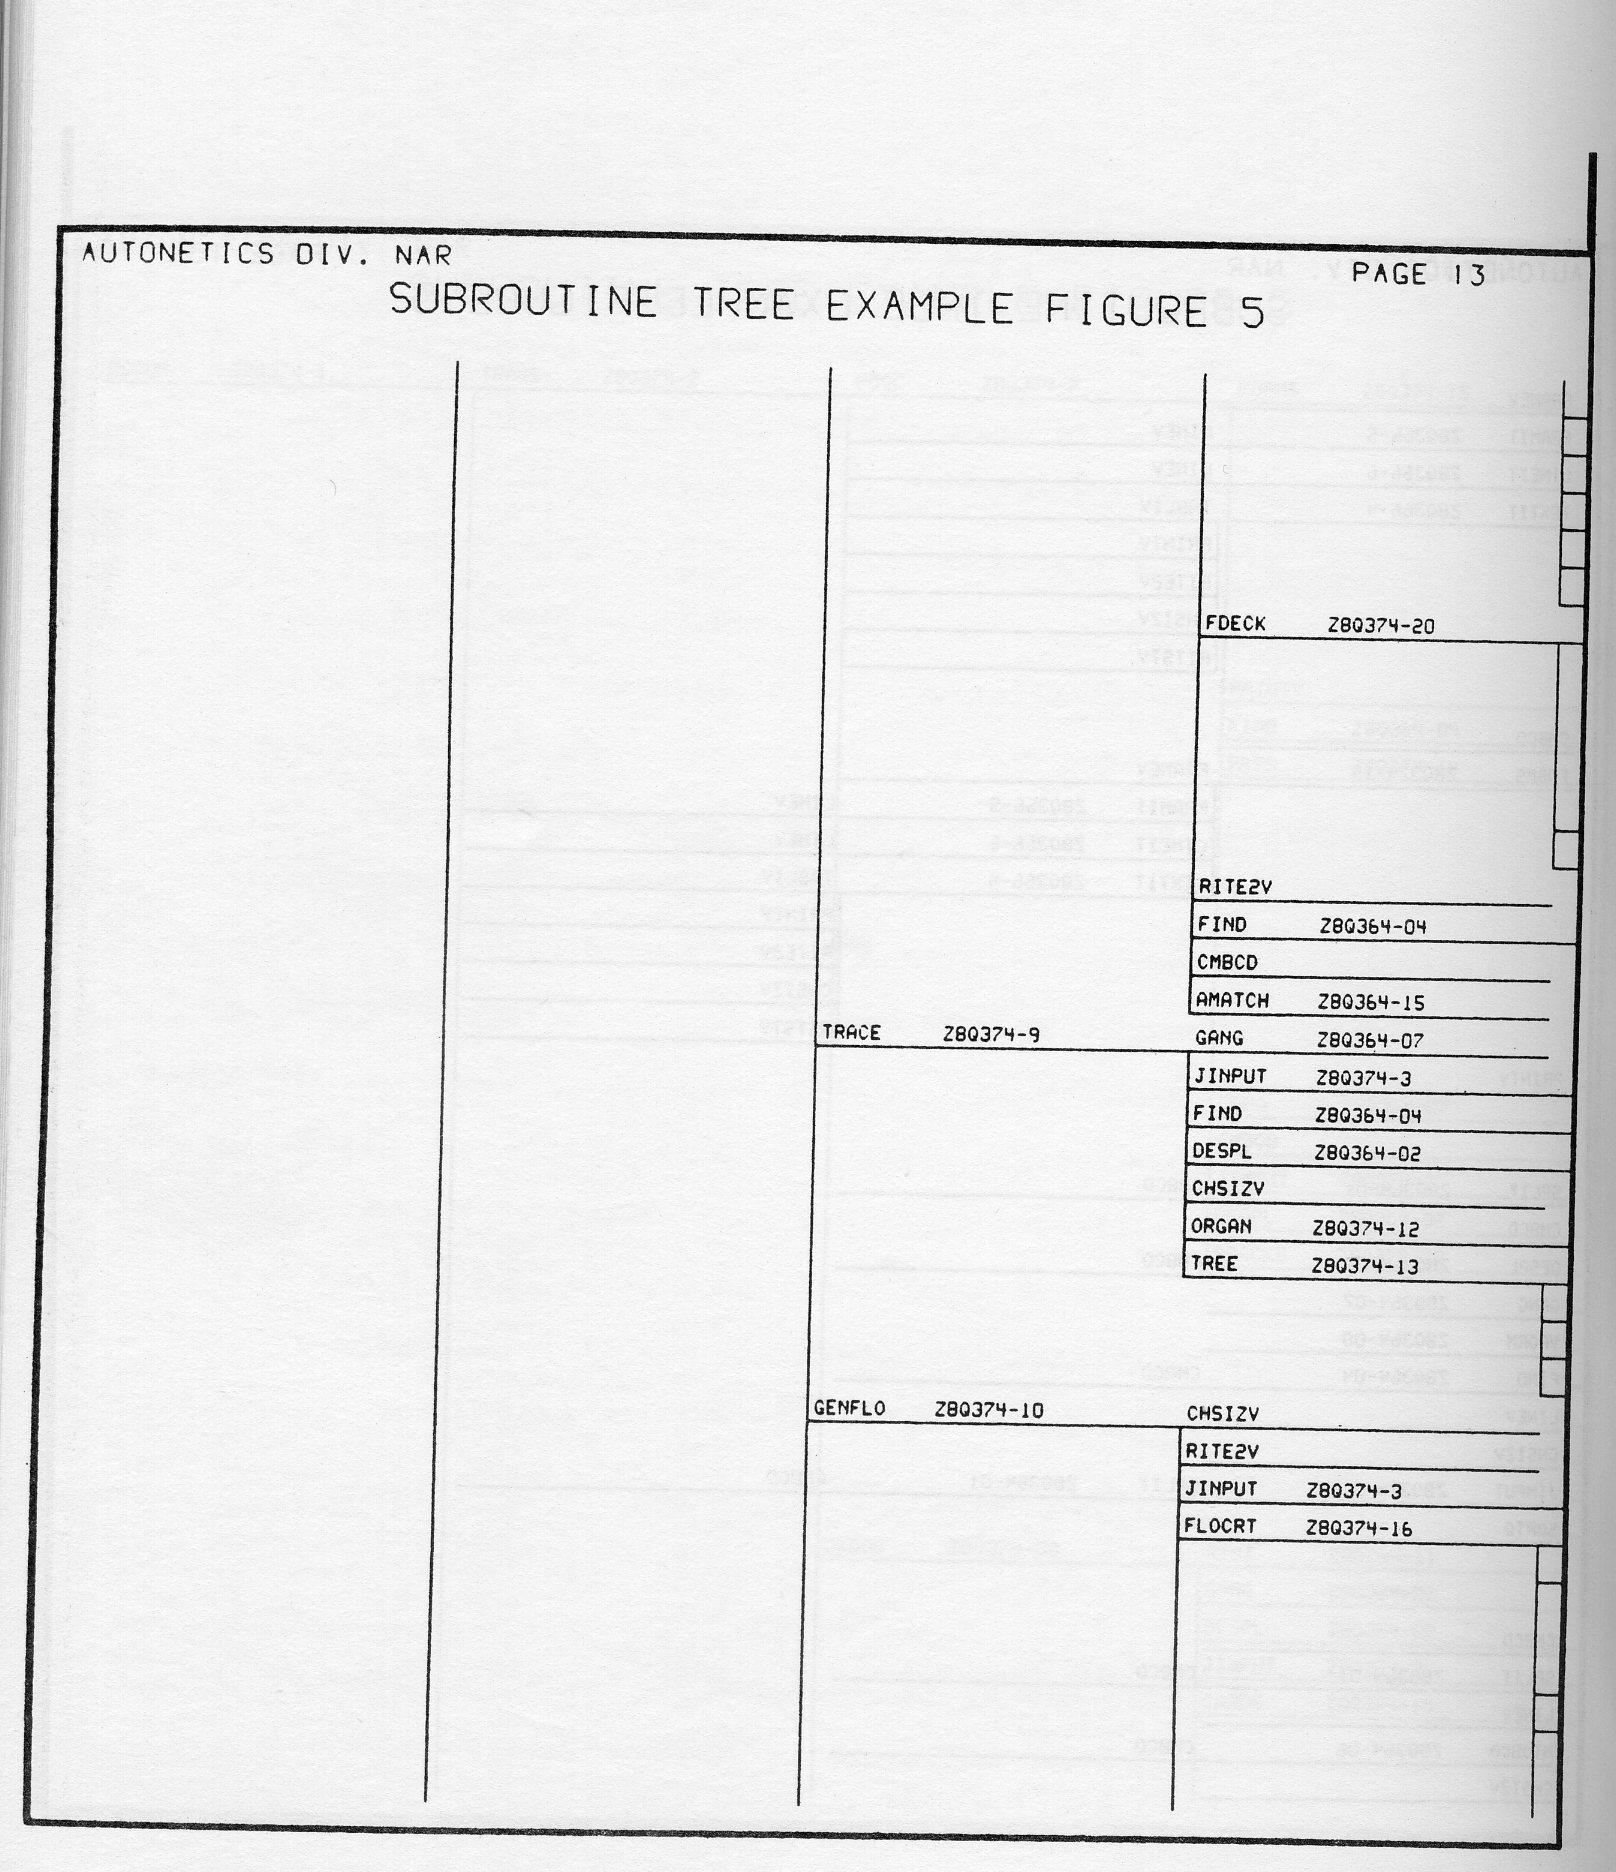
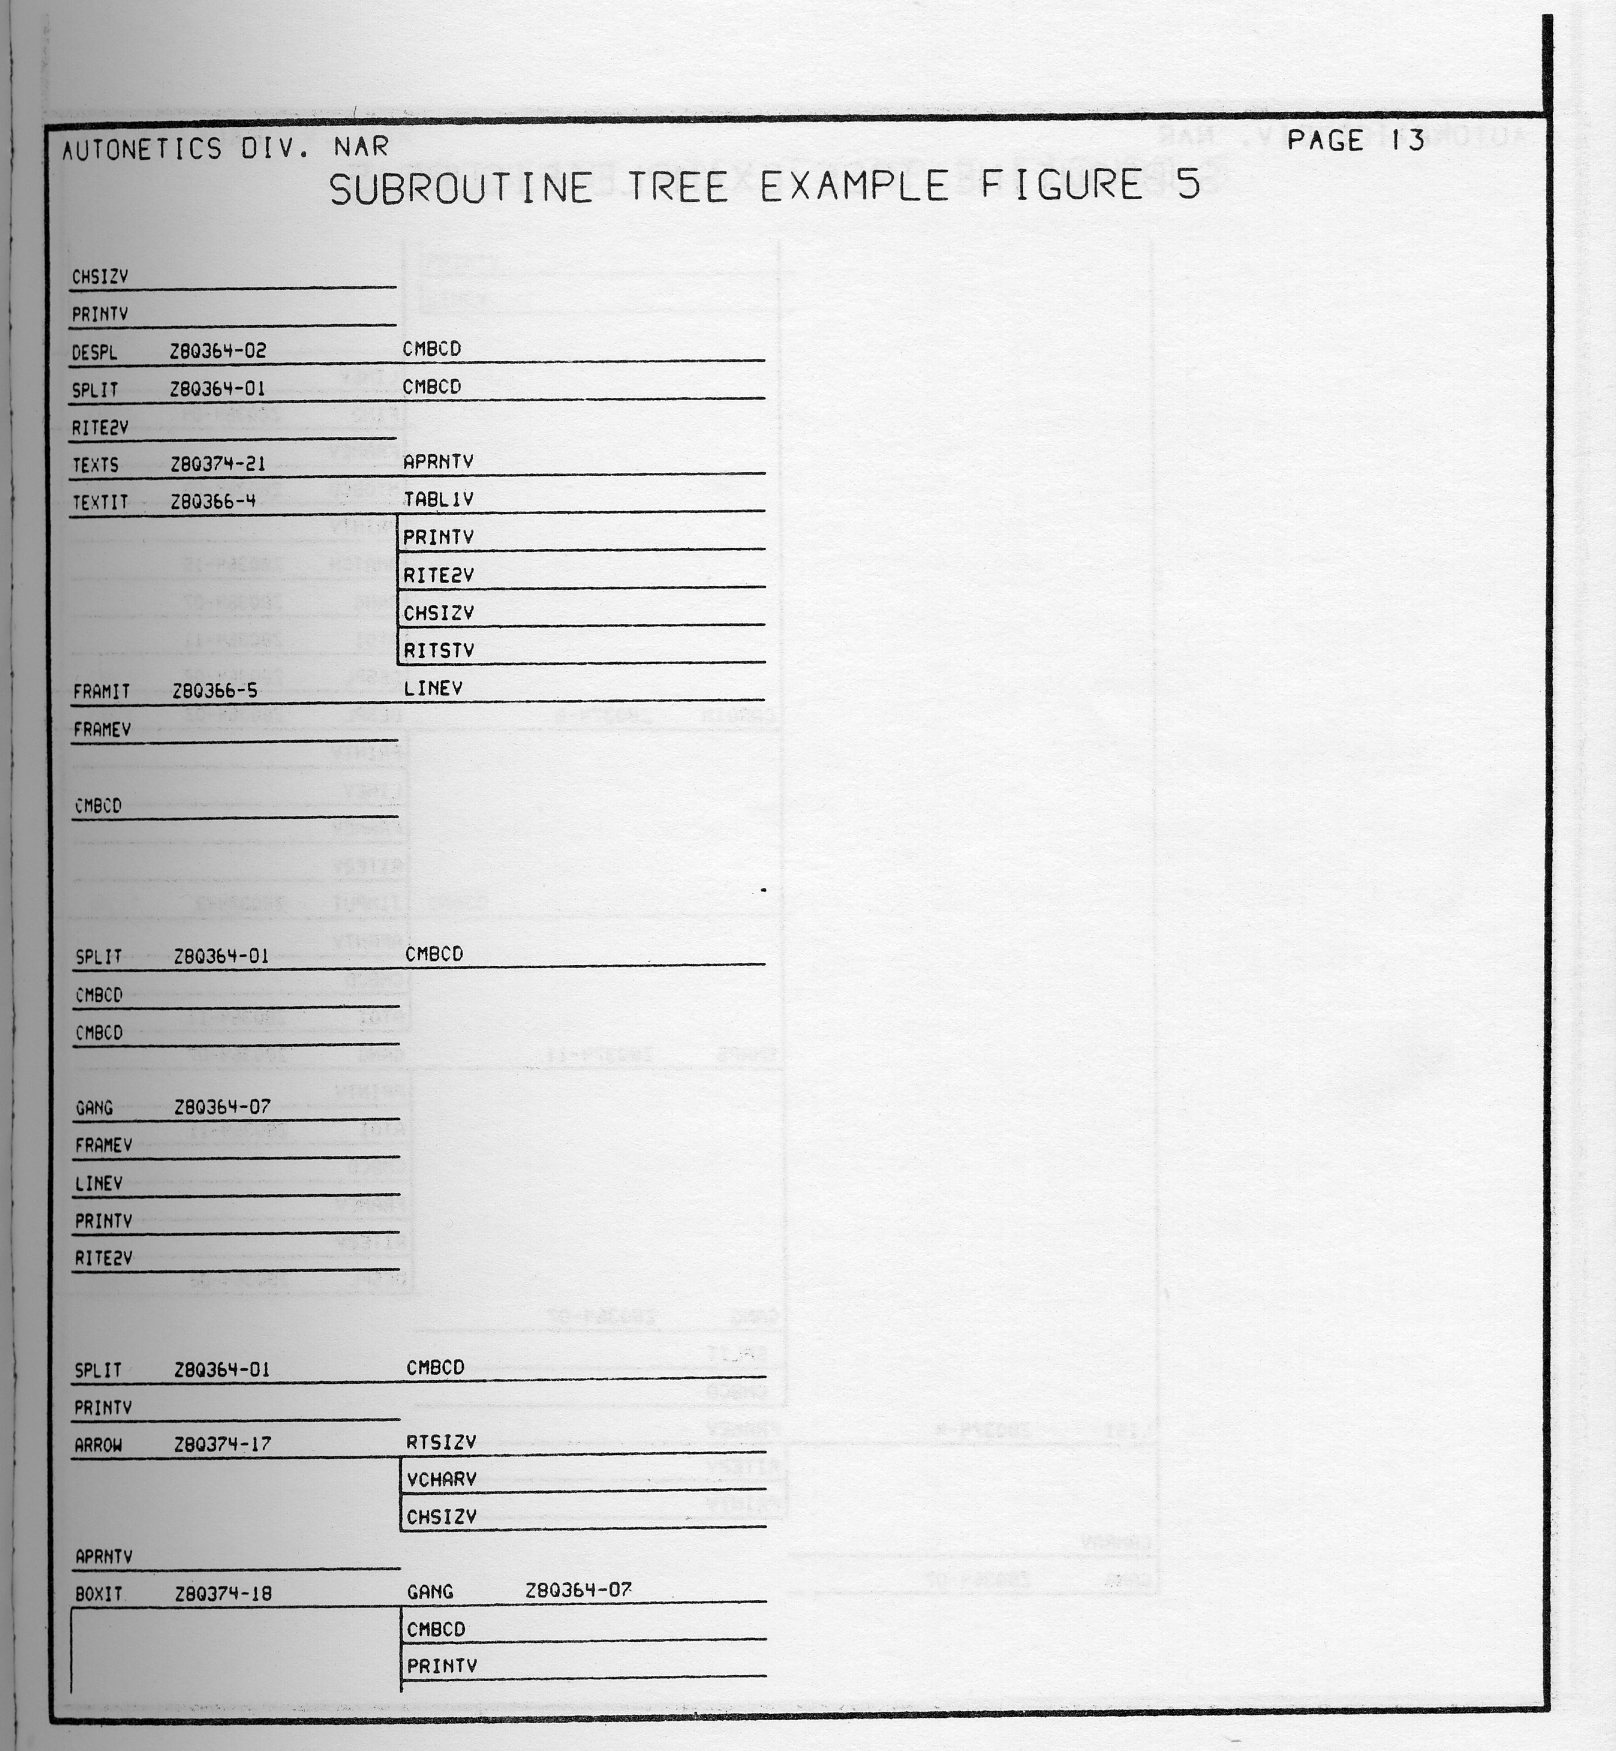
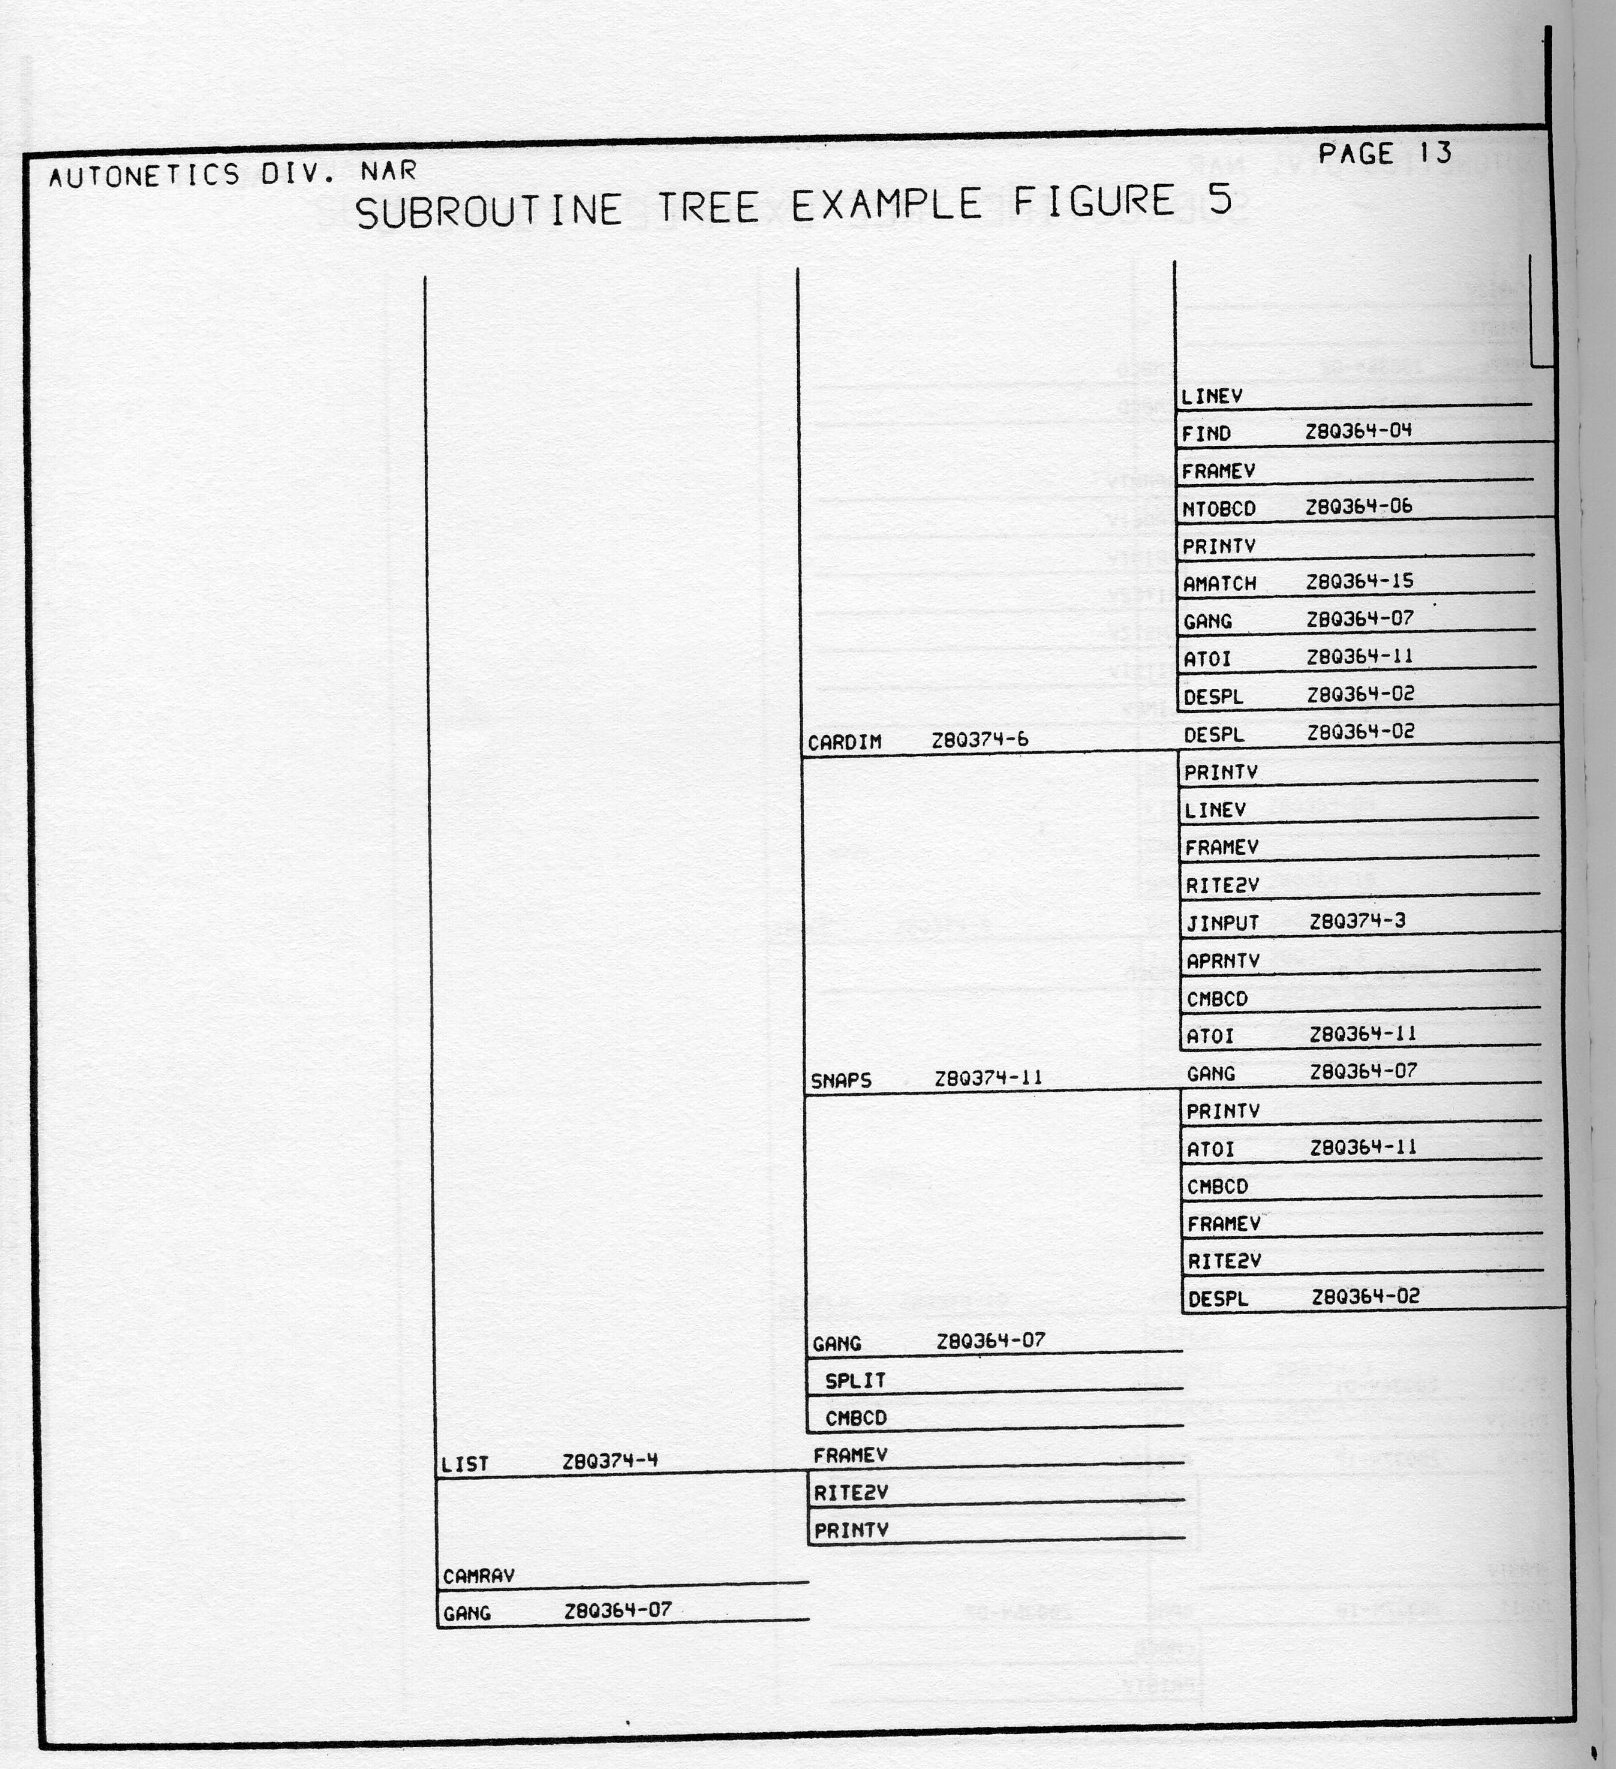
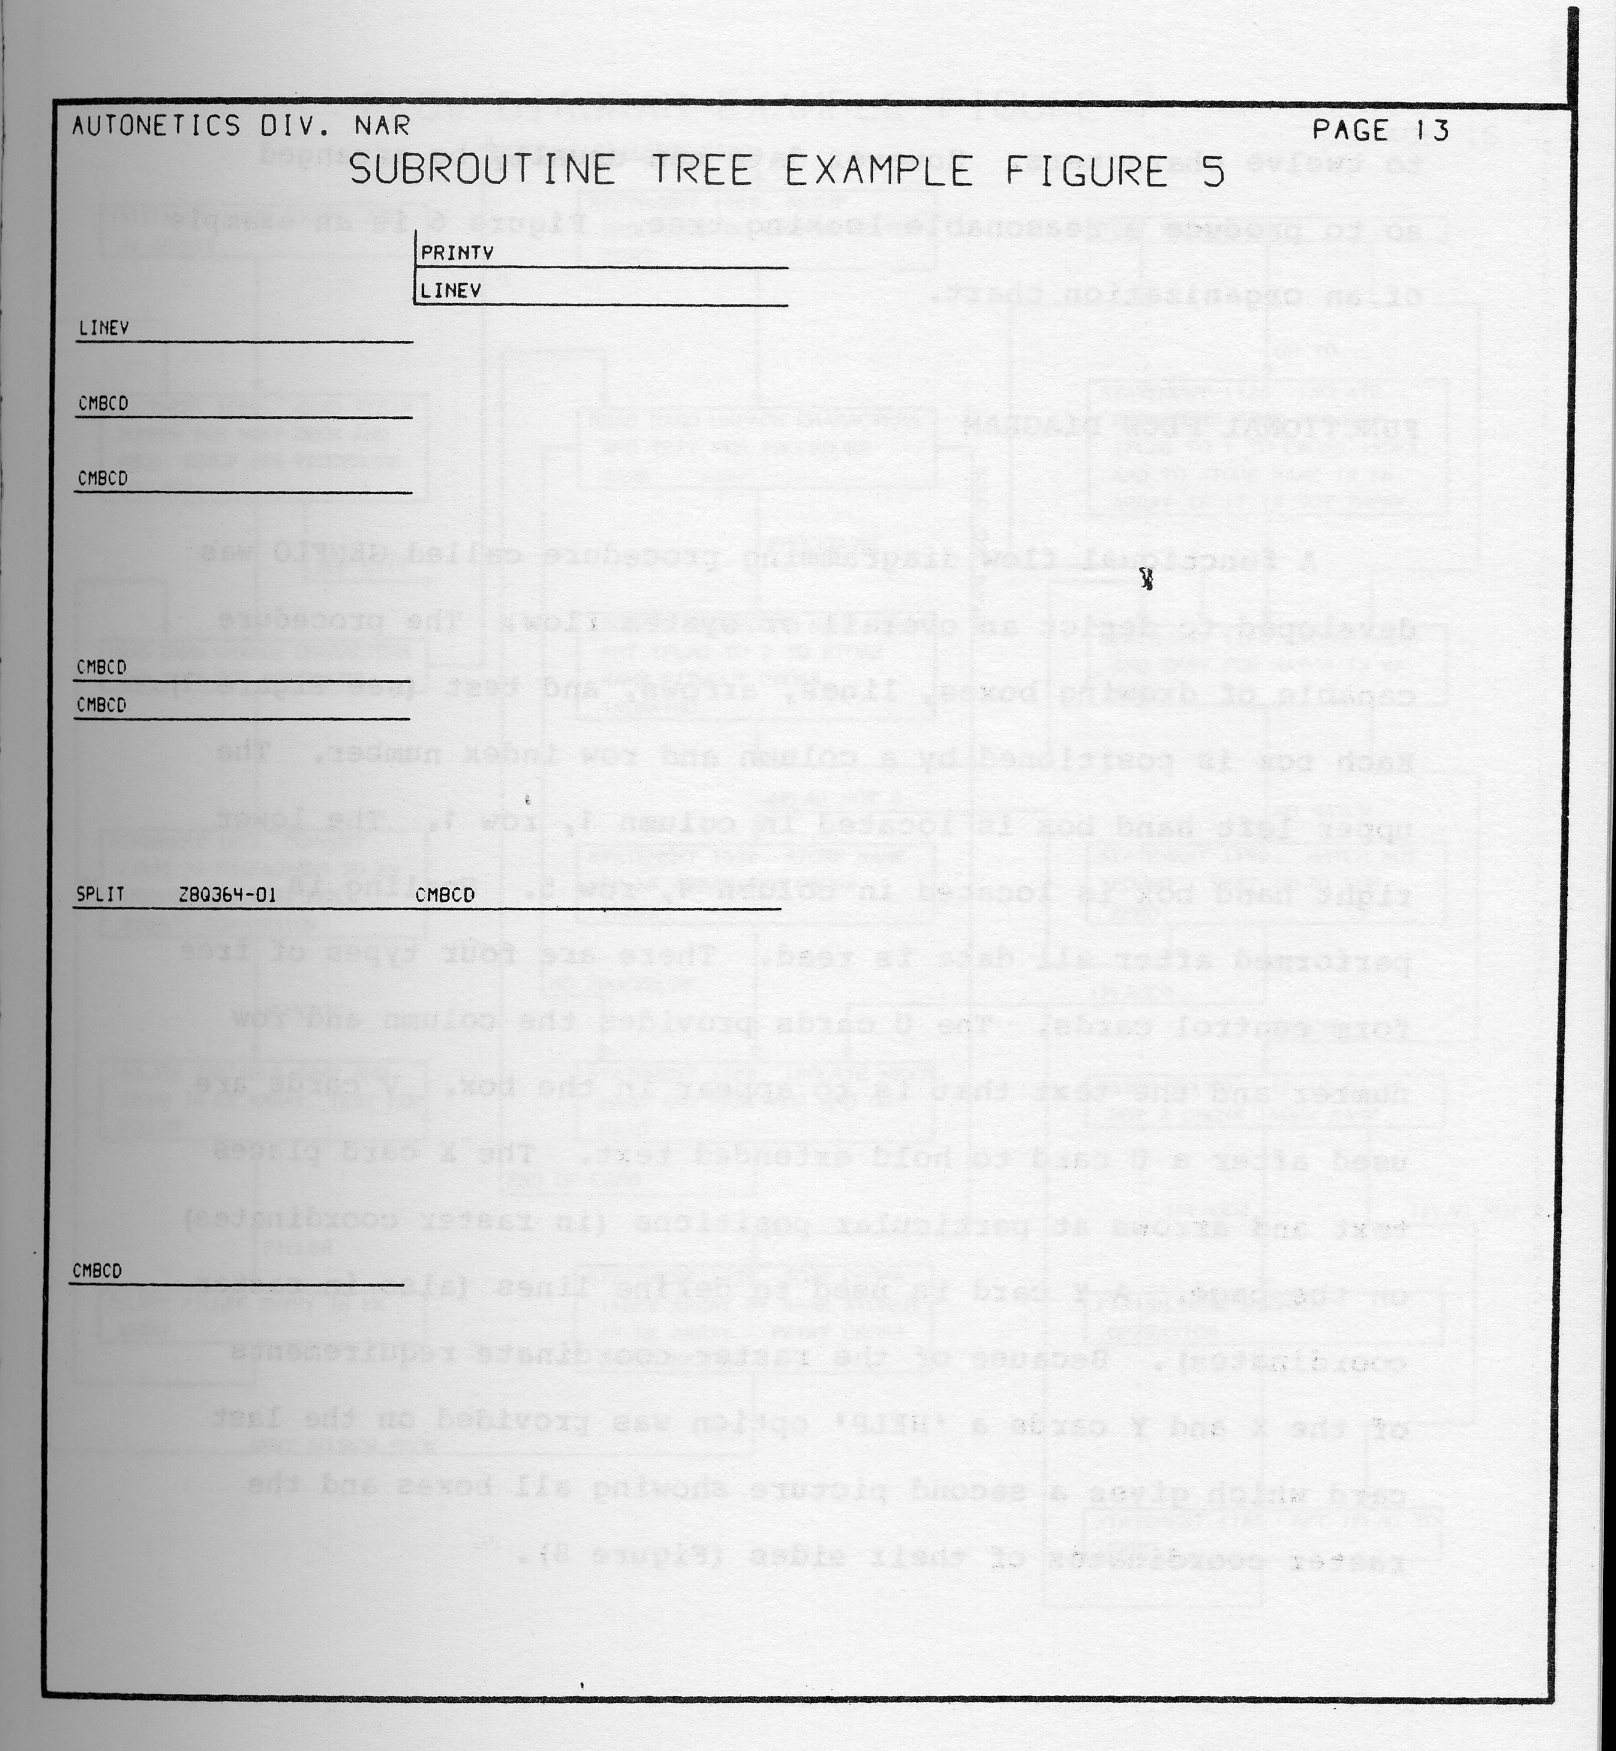
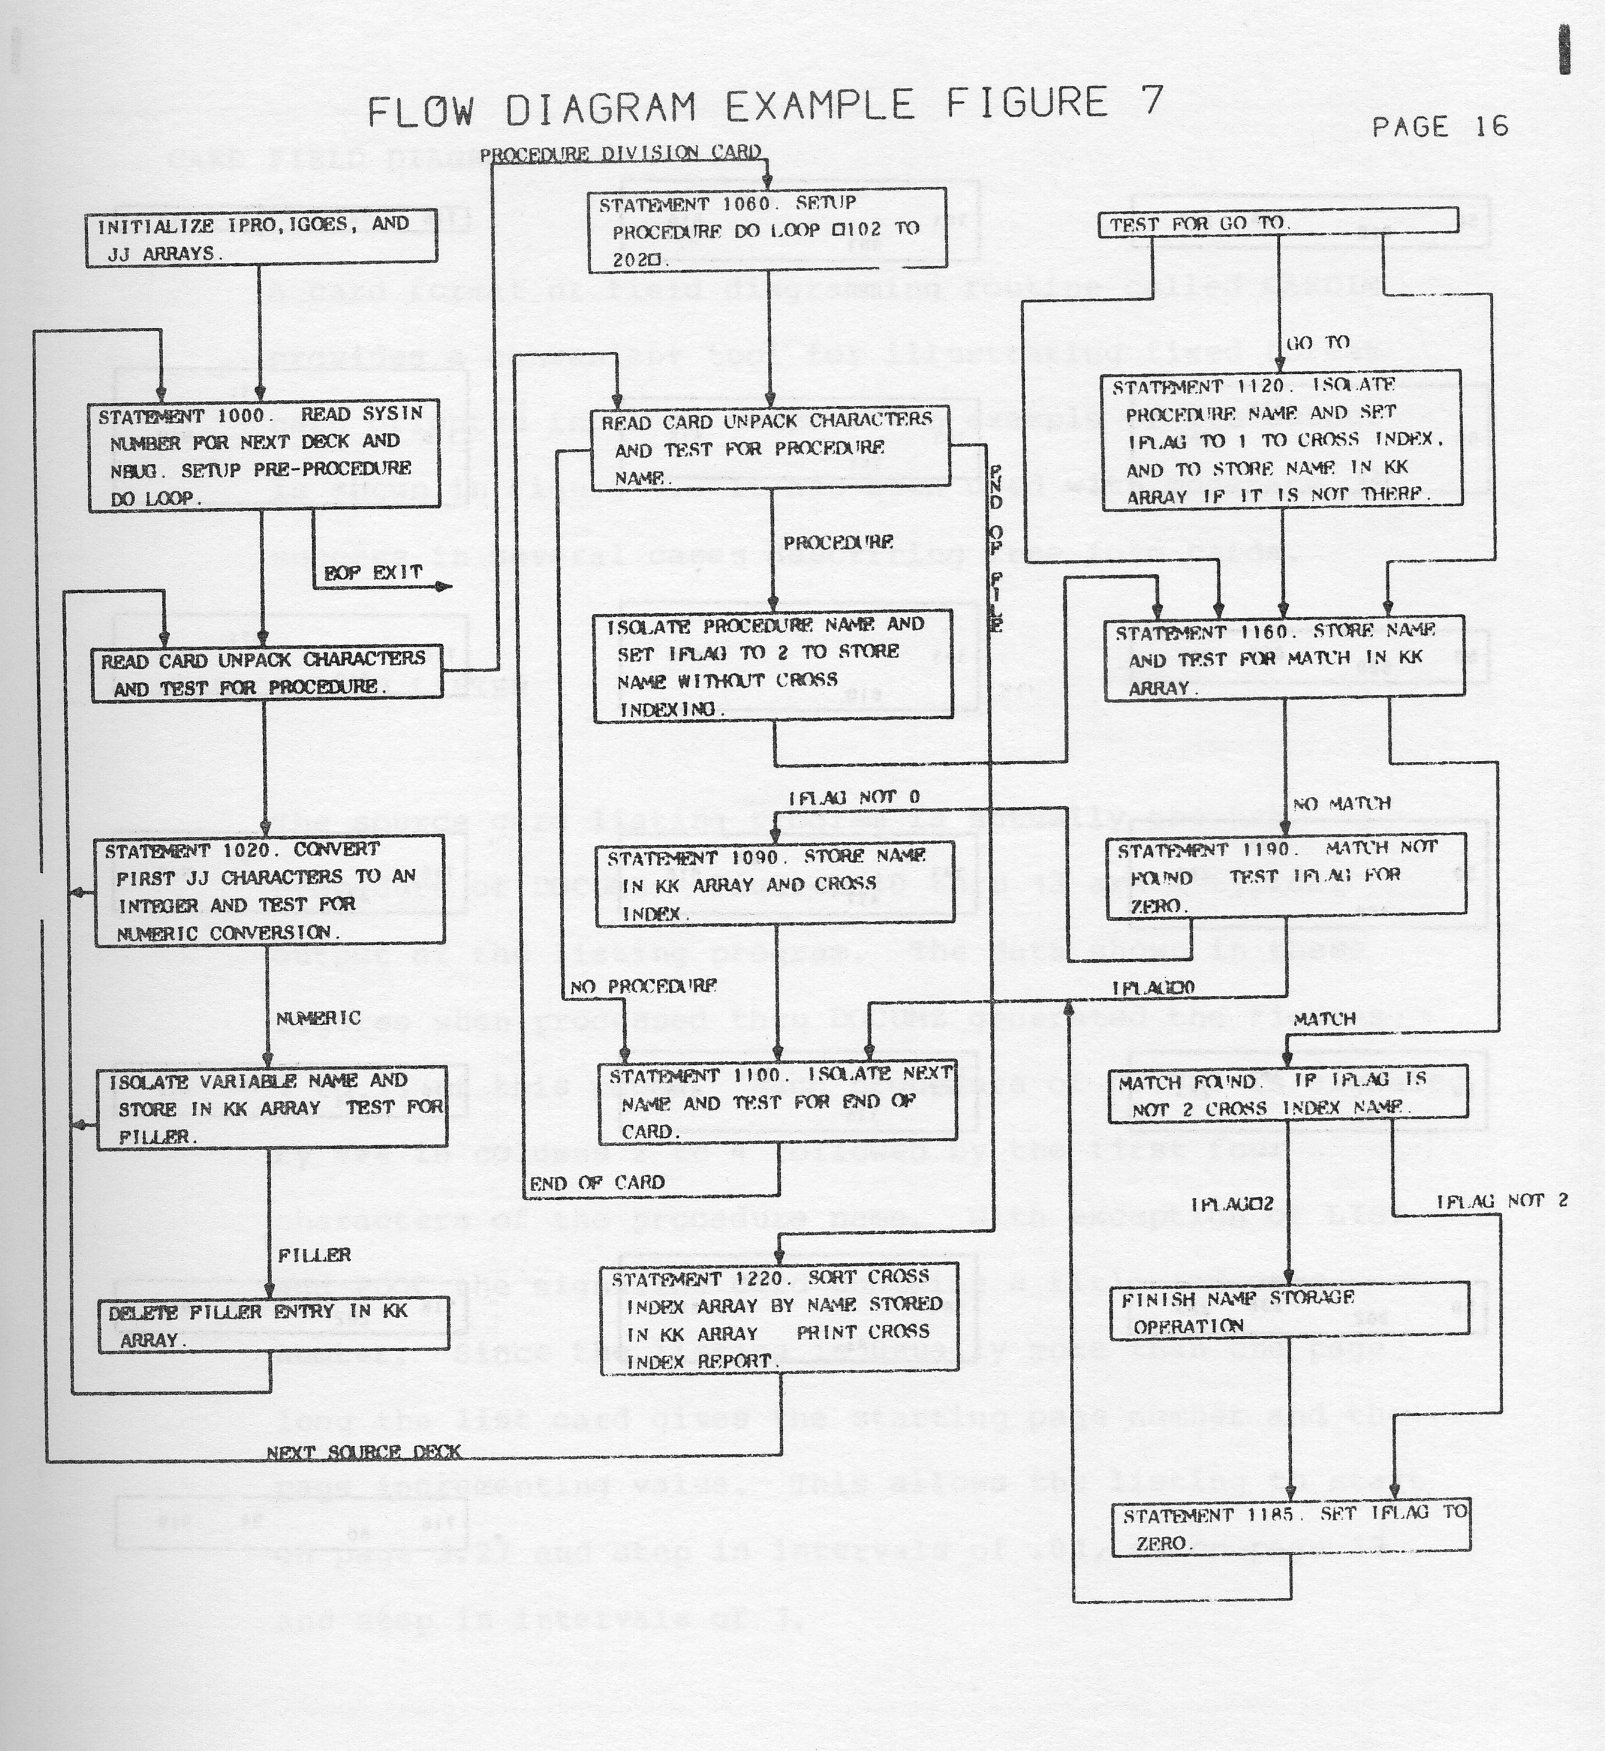
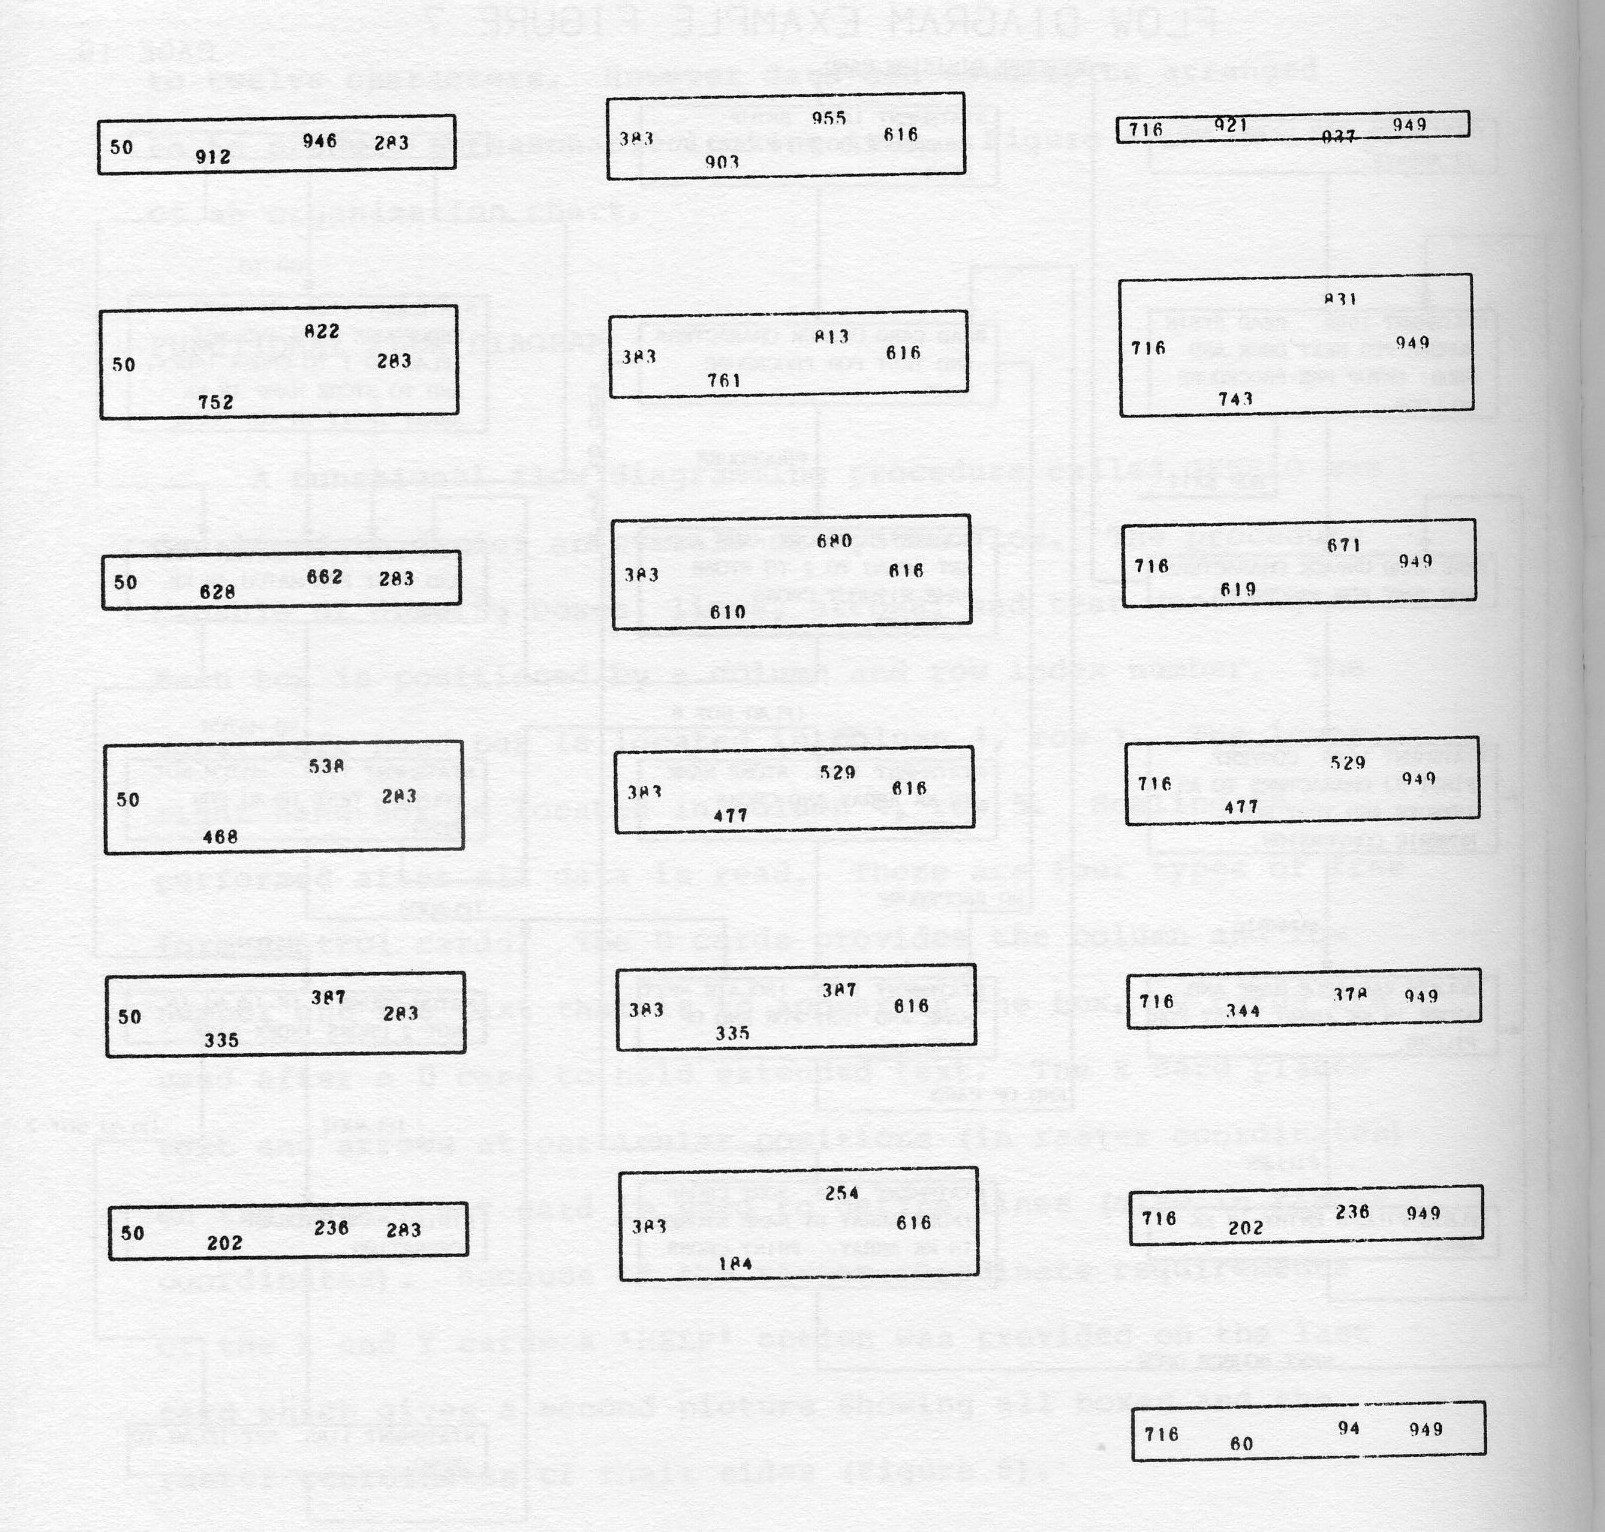
A card format or field diagramming routine called CARDIM provides a convenient tool for illustrating fixed format card oriented input or output. An example of its output is shown in Figure 9. It has been used with moderate success in several cases describing free form cards.
The source card listing program is actually the hub procedure of DOCUMZ. Figures 10 thru 13 are a typical output of the listing program. The data shown in these figures when processed thru DOCUMZ generated the figures 1 to 13 of this paper. Each procedure of DOCUMZ is signaled by *** in columns 2 to 4 followed by the first four characters of the procedure name. With exception of LIST and PDOC the signaling card contains a title and page number. Since the listing is usually mote than one page long the list card gives the starting page number and the page incrementing value. This allows the listing to start on page 3.27 and step in intervals of .01, or on page 17 and step in intervals of 1.
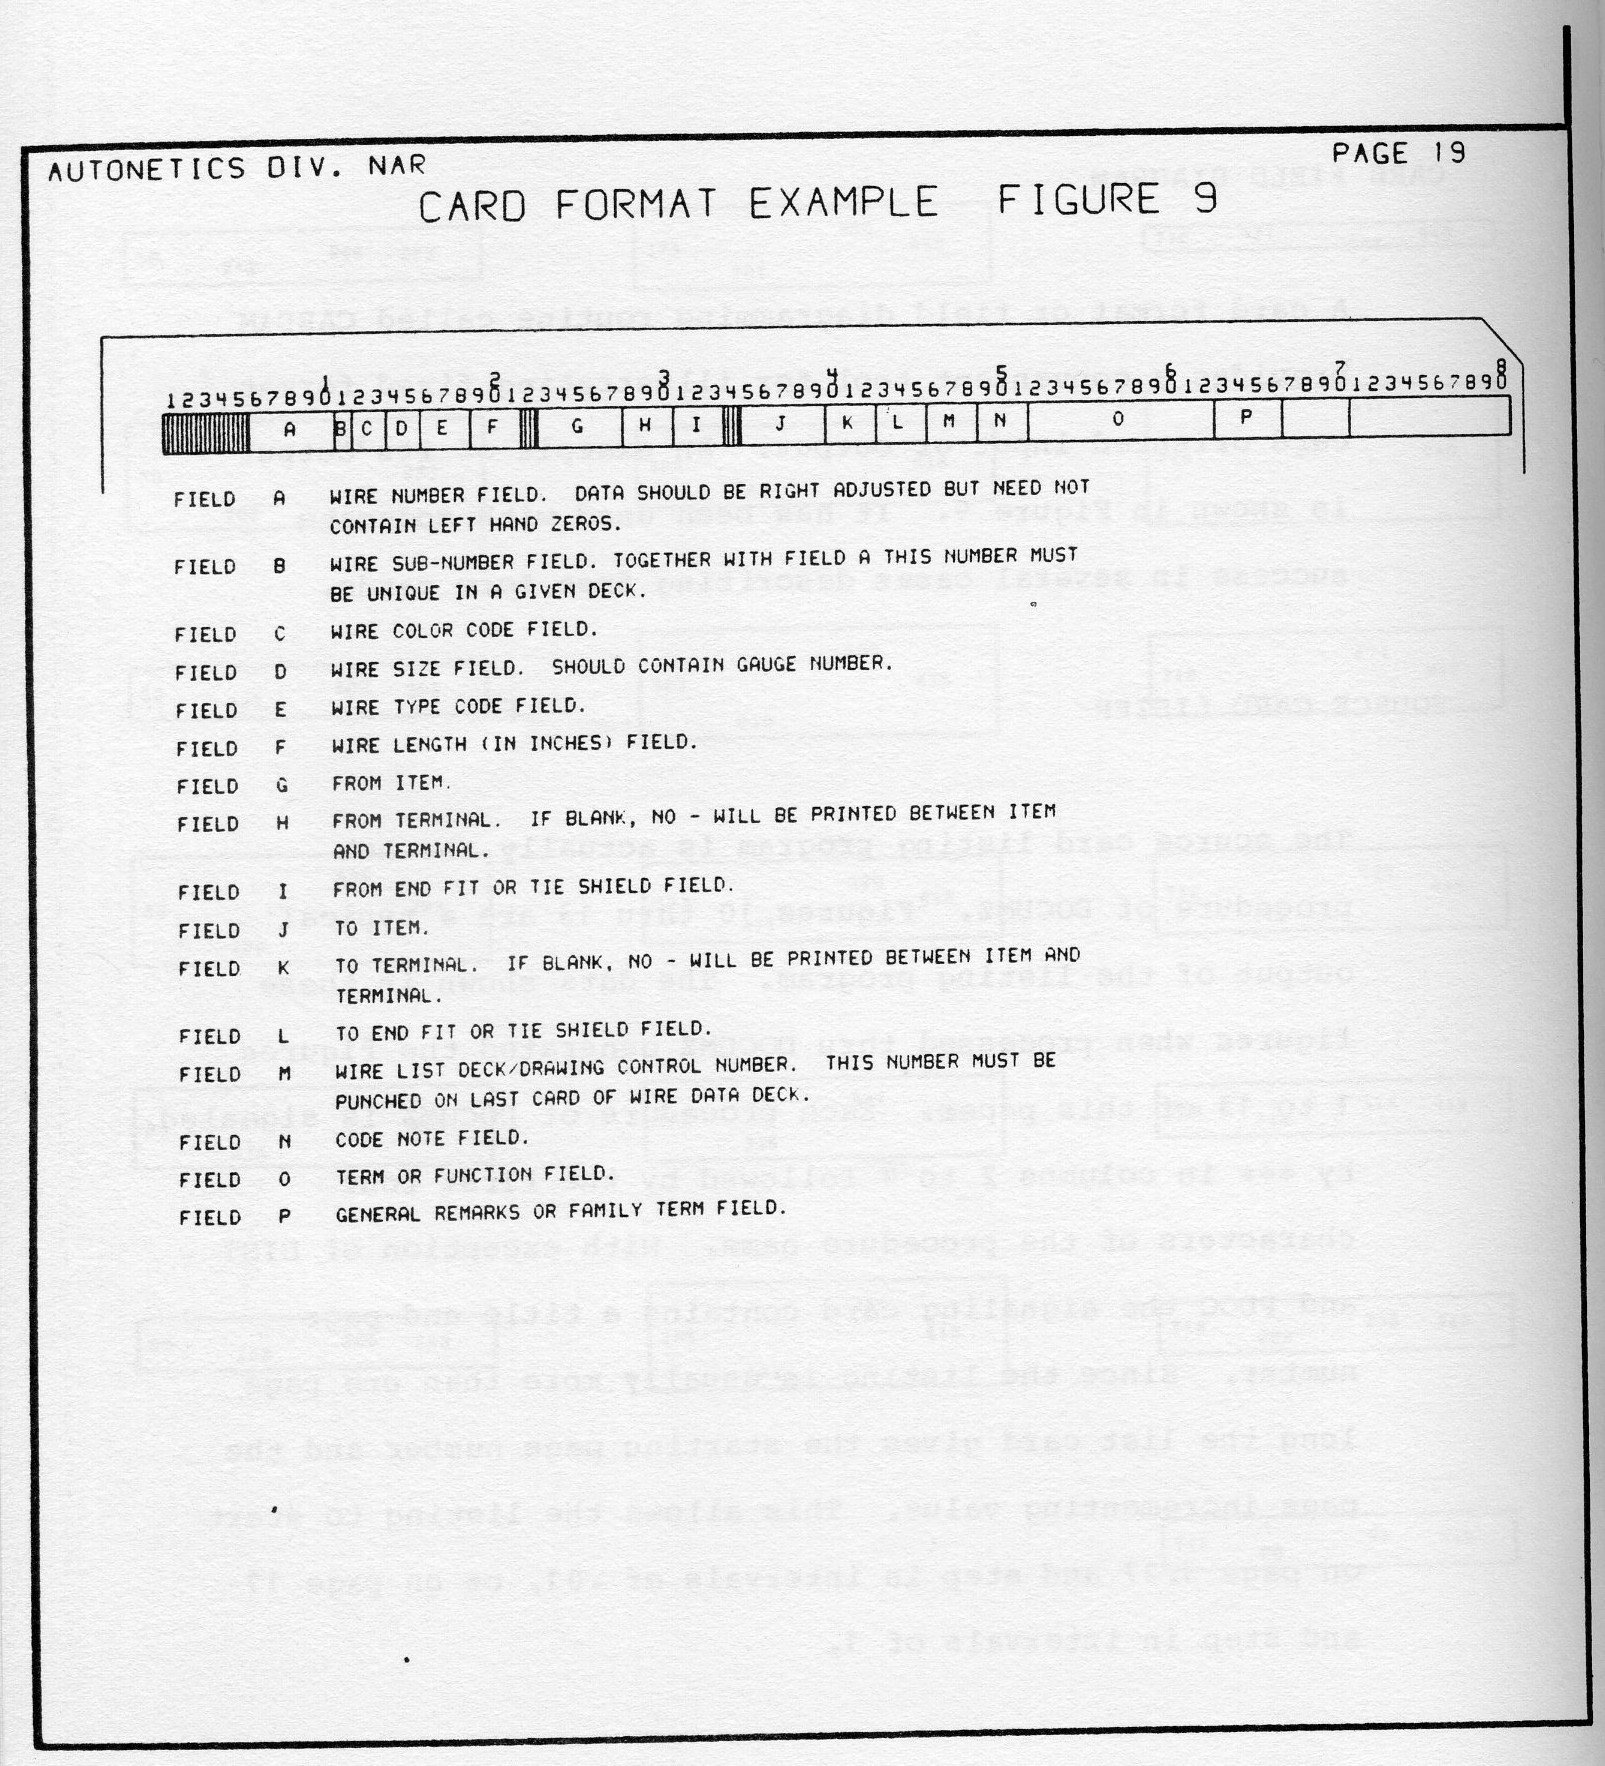
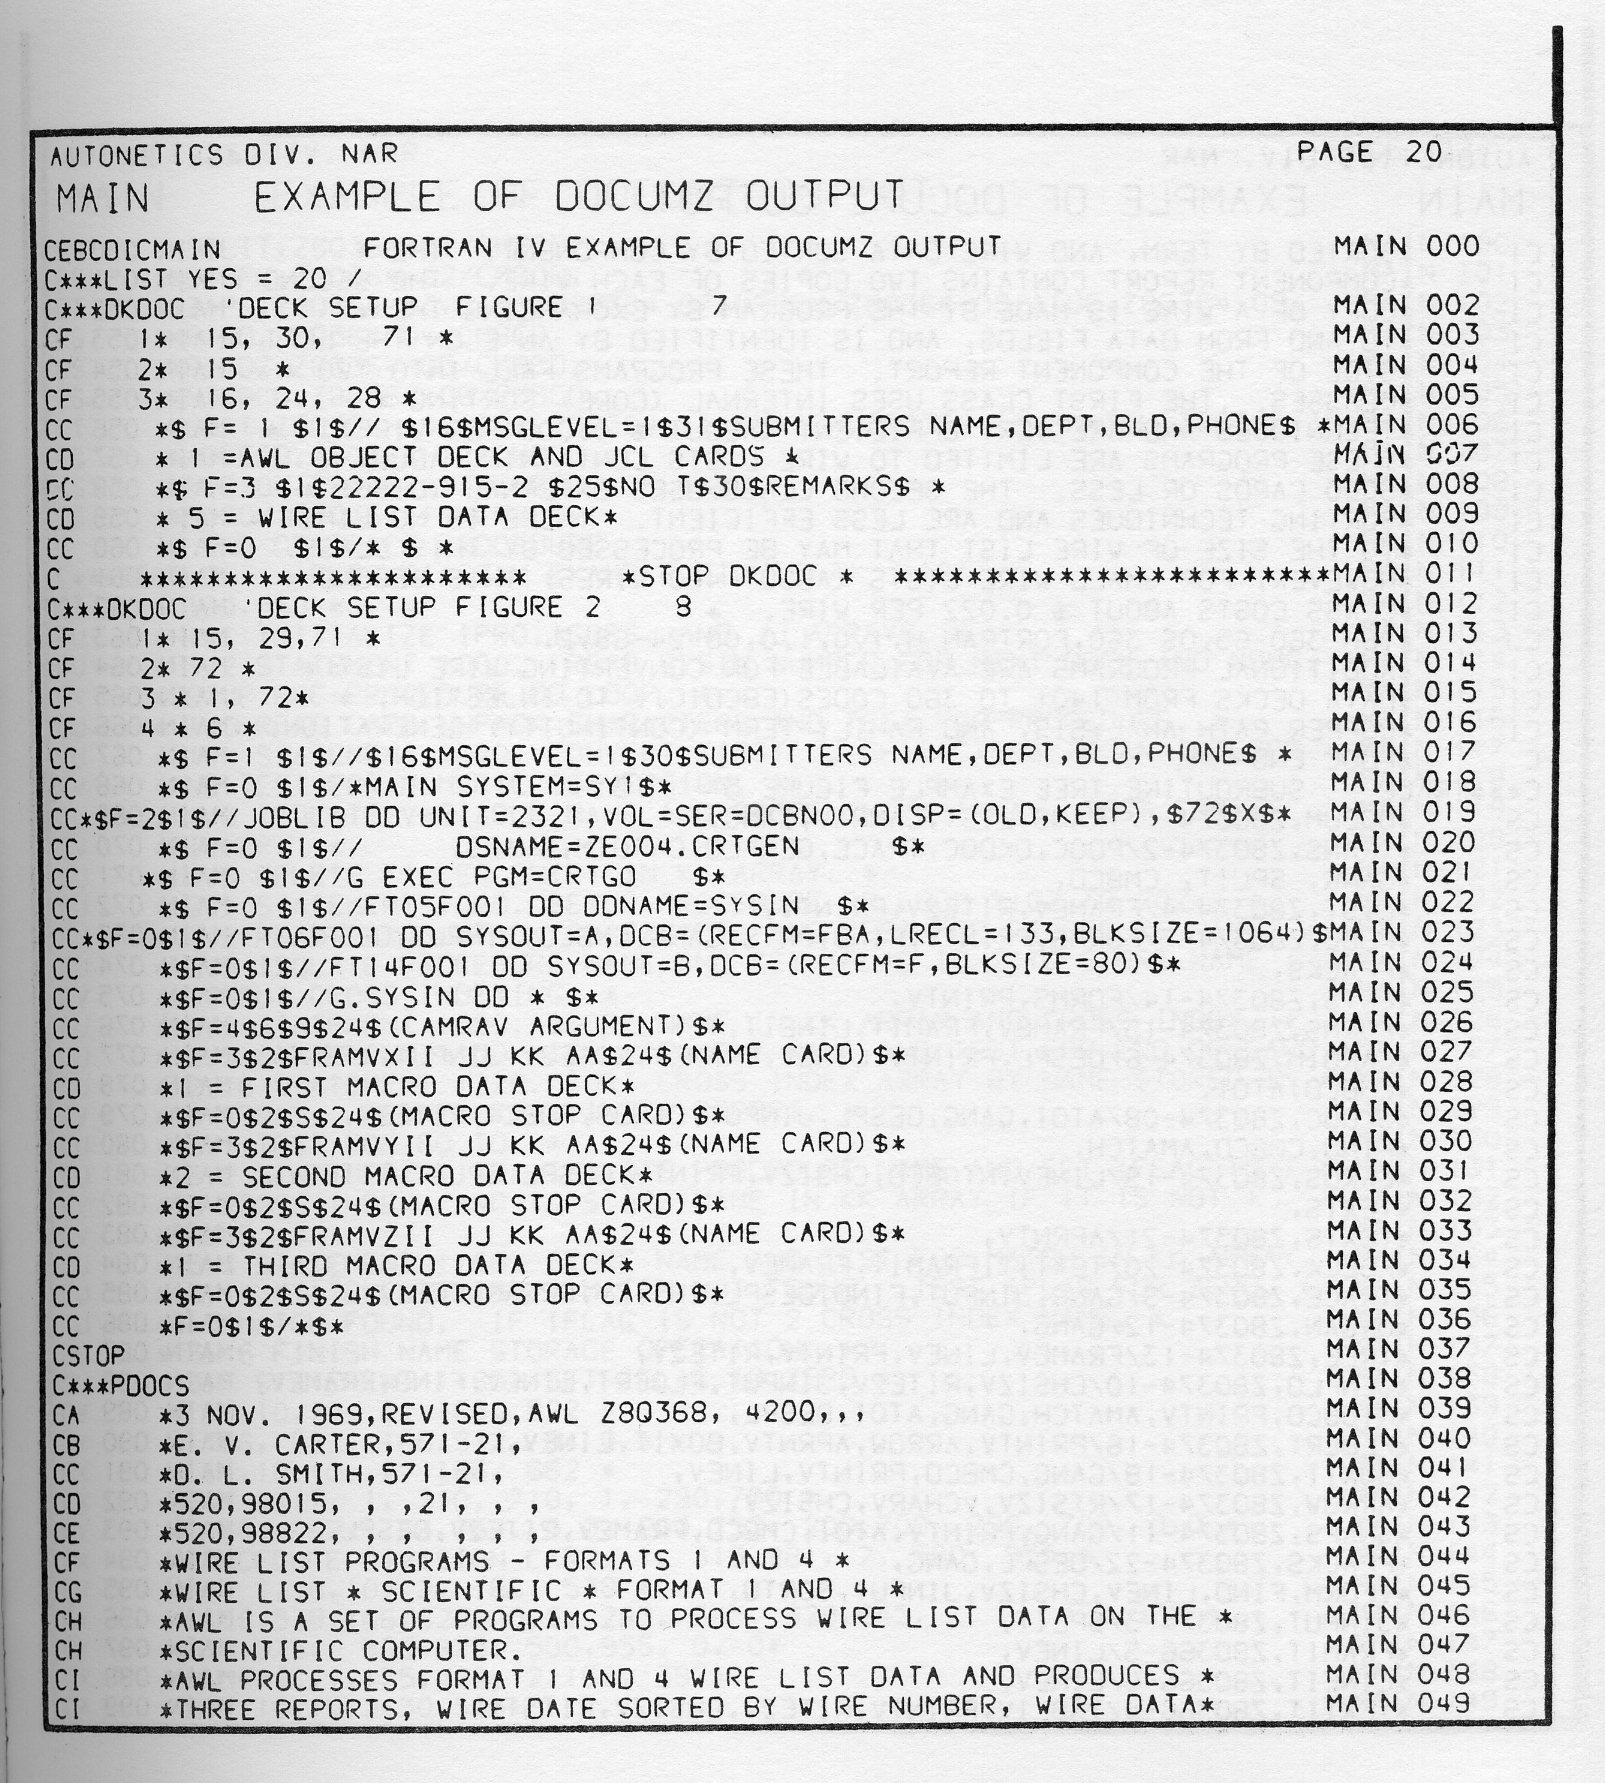
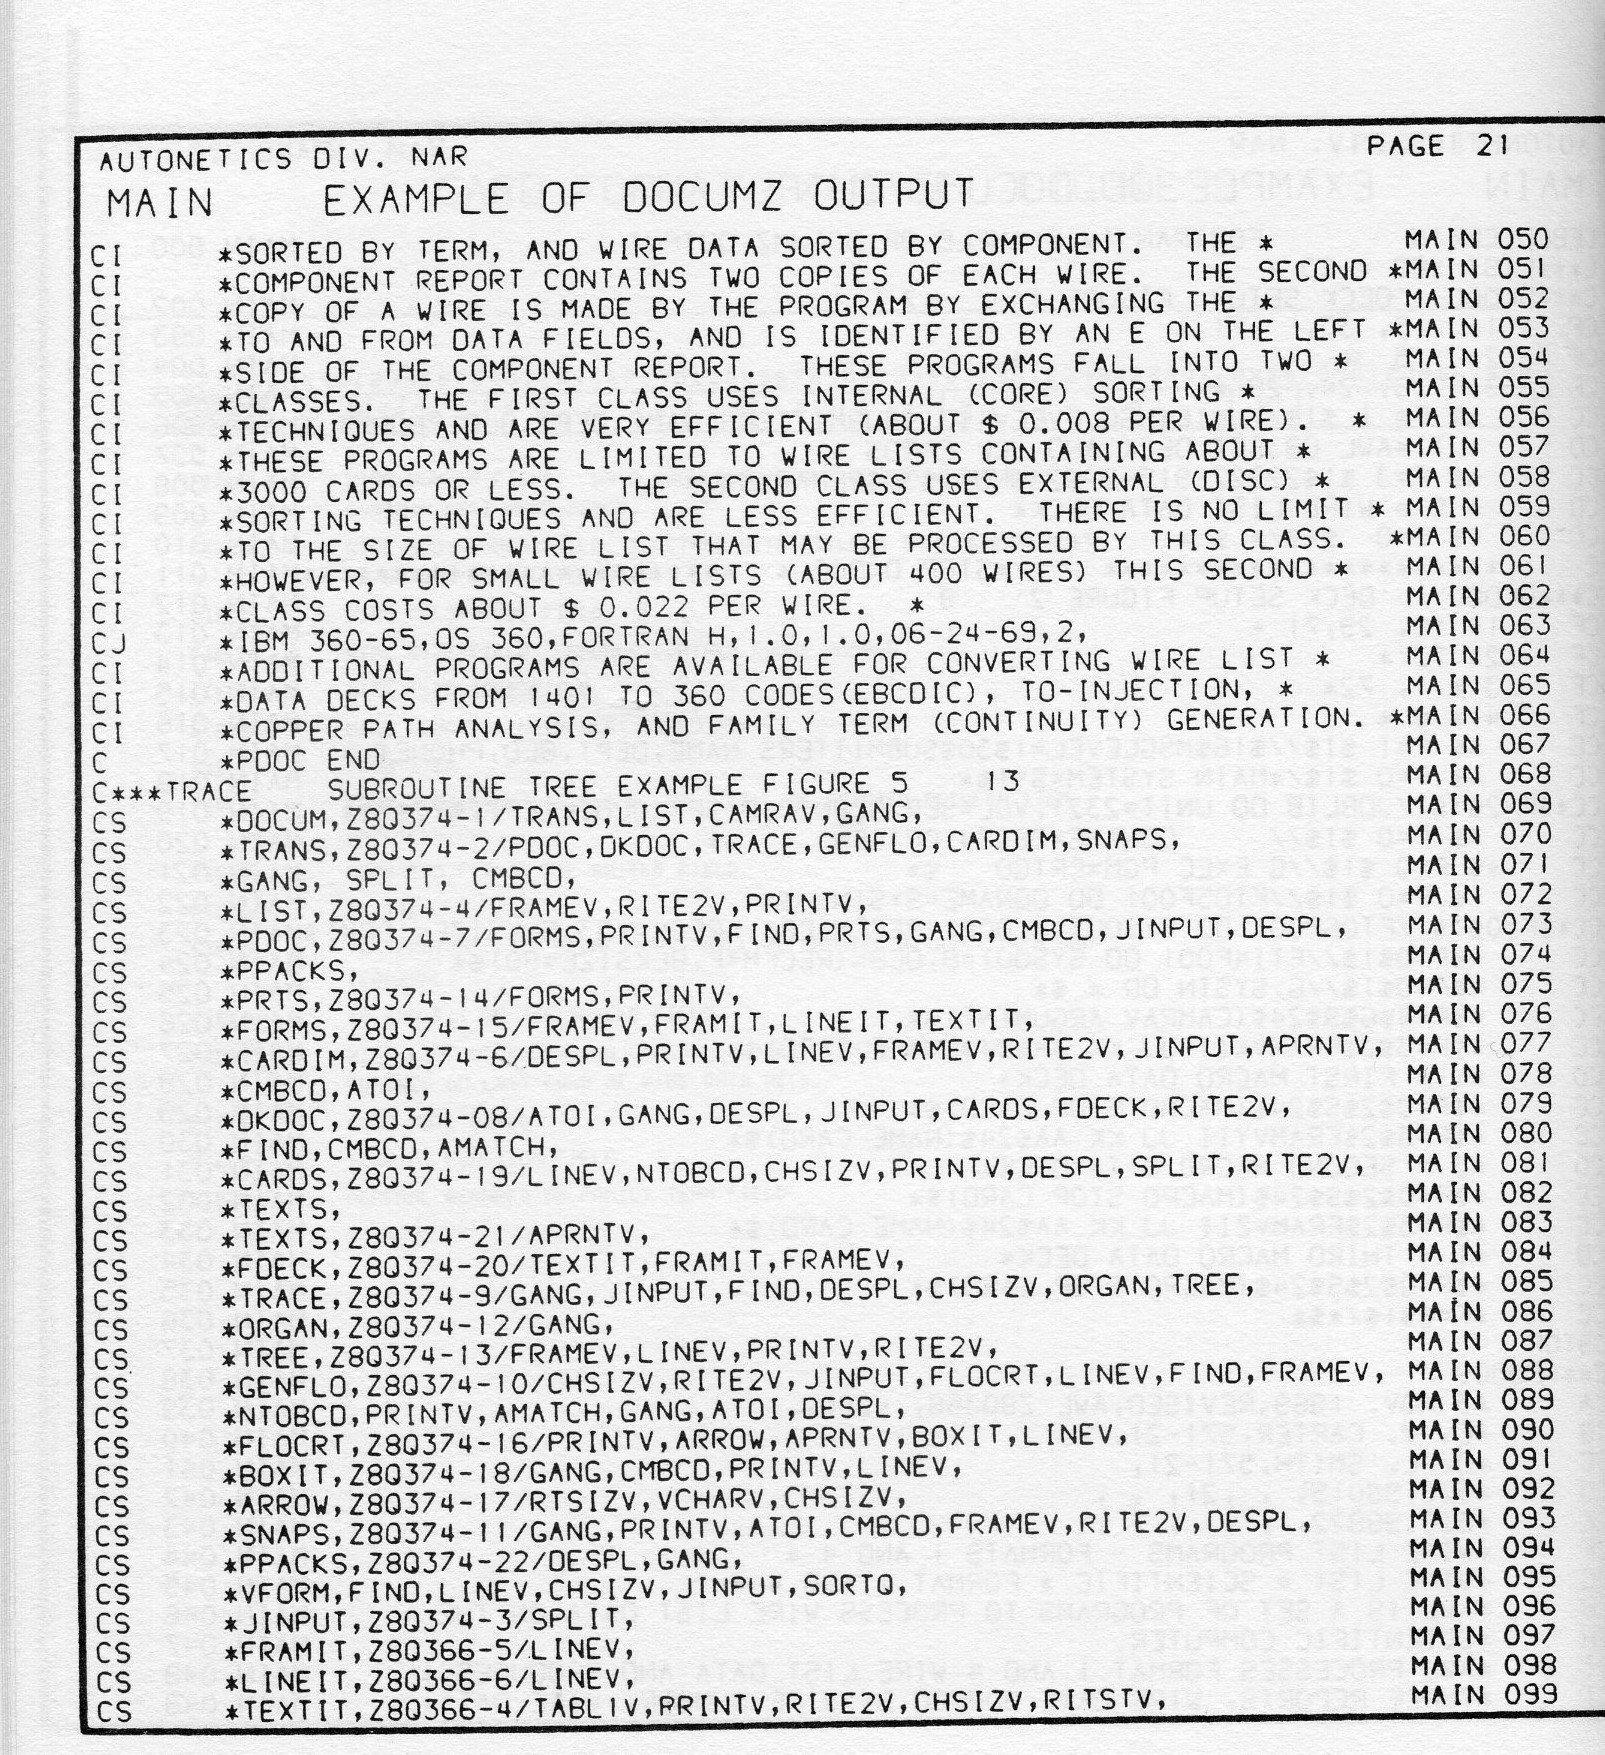
Although the present micrographic recorder at Autonetics produces 35mm, film strips this is not the desired end product of the integrated documentation package. These strips are awkward to store and to view. However, they can be copied onto microfiche which has great potential as an information media. The cost of reproducing a microfiche from a master is comparable to the cost of the postage for mailing the 4" × 6" microfiche. In terms of density, a single microfiche can store 68 pages of text and pictures. If the pages were source code listings produced by DOCUMZ, a single microfiche would hold the data contained on 3400 punched cards. Twelve microfiche would hold a full 2400 feet of 9 track tape, recorded at 800 bits per inch, containing unblocked card records.
Because of the relative low cost and high density of microfiche, greater dissemination of computer programs can be achieved under present day budgets for production and storage. A programmer could file some 2000 average program documents and listings in a single desk drawer. This is equivalent to over forty IBM card cabinets, or 150 full magnetic tapes.
Recent developments in optical scanning have led Autonetics to investigate the possibility of using the microfiche program document as the prime source of program code. That is to say, if the microfiche listings could be read and converted back to punched cards there would be little need to keep source code in either punch card or magnetic tape form. Multiple copies of programs could be stored in dispersed locations to safeguard them from loss due to fire or flooding. Multiple configurations of a single program could be maintained without serious concern of mixing the second revision documentation with the fourth revision source code. A survey of companies producing computer microfilm equipment has indicated that microfiche scanning and code retrieval is within today's state-of-the-art. Two companies surveyed stated that they could market such equipment by 1971 if a user's market could be established.
Another feature of microfiche codes would be an added protection against copyright violation, should microfiche code retrieval be controlled in a manner similar to that used in the motion picture film industry then a copyright might well prevent unauthorized retrieval. In the film industry a written release is required to copy a film. A few years ago a company which had changed its name tried to get an old film copied. A release signed by an officer of the newly-named company was unacceptable, even when accompanied by copies of the legal papers which changed the company's name. The film was copied when the company dug up a letterhead containing the old company name and wrote a second release. Such copyright practices could assist in the protection of copyrighted programs.
The DOCUMZ program development has been evolutionary in nature. As such it has grown in bursts cf activity followed by relatively long periods of production operation. At the present time it is in a period of production operation, but there are several areas under investigation for the next burst of development.
These are as follows:
The ultimate goal of the DOCUMZ development is to have these documentation tasks performed by the compilers as an option. Today this may sound a long way off. However, I can remember working with Fortran compilers several years ago that would not optimize code, list symbolic machine language equivalent of the Fortran, nor cross reference variables. Therefore, it does not seem so unreasonable that in several more years graphical documentation generating compilers will be developed.
A small darkroom was initially set up for processing the hardcopy and was later used to house the processor for the 16 mm and 35 mm film output. The photographic requirements remained minimal as the processor is a small table-top one needing additionally only cold running water and a 5-amp socket. The processor will take 400 foot rolls of either 16 mm and 35 mm film and to change from one to the other, a drive wheel is all that has to be altered. It has given very good results and the only attention necessary is the regular replacement of the (auto windshield) wiper blades.
After some months of operation a need arose for producing plots of a size comparable to those on hard copy, but with a greater range of densities using overstriking (multiple exposure) than is possible on hardcopy. The latter effectively saturates after approximately five overstrikes. As the number of such plots would be low, say not more than 10 separate pictures on any one run, the simple solution appeared to be a slide-holder capable of holding a standard 8" × 10" sheet of film with an emulsion suitable for achieving 10 or more visibly distinct density steps. The initial application was for hill-shading techniques carried out by the Experimental Cartography Unit of the Royal College of Art. The film chosen was Ilford N7E.31 developed in a 1:19 dilution of Technol for four minutes. Having a Melinar polyester base the stability of this film is very high.
It was also realised that this system could provide a direct means of making overhead transparencies. The original film was unsuited to producing intense black lines with few overstrikes by definition of what was originally desired, and this was now important. A Kodak photo-typesetting emulsion was tried but not unnaturally proved too slow, and a compromise has now been reached with Ilford Orthoset G5.52. The frame repeat feature on the SD-4020 helps to provide multiple exposure at virtually no increase in computing time on the host computer for this type of work. In case other users are unfamiliar with this particular hardware option which repeats groups of frames, a brief explanation will now be given. A bit is set in the Frame Advance word which triggers a counter of tape records being read. When this bit is again detected in another Frame Advance word the tape is backspaced by the number of records counted. The SD-4020 then re-processes this data. Further bits in the word determine the number of repetitions, up to a maximum of 31 times, with a maximum of 511 records between repeat commands.
In addition to the above direct black and white transparencies, coloured ones may easily be produced from them using colour diazo material and an ordinary dyeline printer available in most large drawing offices. These machines usually have to be run at very low speed to attain satisfactory results and production suffers. The advantage is uniformity in large areas of colour, but as the colours arise from original black or opaque regions, SD-4020 output tends not to make excessive demands in this direction.
A much more versatile solution has now been discovered using the Visual Aids Kit made by the Varityper Corporation, a subsidiary of Addressograph-Multigraph. In this system the diazo material is supplied either as a single or double-sided clear sheet, or emulsion on silver or white-backed paper. Instead of having distinct sheets for different colours, various colour dyes are used on the same diazo material. It is thus possible to develop up areas of a sheet with several colours, which provides a means of highlighting parts of the projected image. It also enables anaglyphs or stereo pairs to be made from, for example, computer generated contour maps. Spectacles made using red and blue Wratten filters have been used with moderate success in obtaining an impression of map relief. A small light-box is available for the exposure of the diazo material and this obviates the need to access a dyeline machine within a separate division. It has been possible to train the operators of the SD-4020 in the technique of programming sufficiently for them to undertake the total preparation of overhead transparencies from sketches supplied by users. This involvement undoubtedly raises interest in the work and thereby the quality of all SD-4020 output.
Finally, it is possible to use the transparencies to make background overlays, contained within a four-inch square for use in the forms-flash holder. Contact prints have to be made, but it is possible to employ the light-box referred to above in this connection. A further extension is to use the original in a photo-etching process (not in-house) with thin copper-foil mounted on a clear, adhesive sheet of plastic. Either a male or female mask can be made and mounted in the forms-flash holder. When flashed, the mask will produce clear and opaque areas on the output. The opaque areas formed by the mask may be lightened using neutral density filters in the forms slide. An example of this output is shown in Appendix A. The land mass was the piece of foil remaining behind after the outer part or sea area had been peeled off the plastic backing. The coastline itself, i.e. lines drawn by the SD-4020, was where the photo-etch chemicals attacked the copper and dissolved it away.
The Still Camera was manufactured by a small engineering company at a cost of $200 as initially only one was ordered. However, it is believed that an order for 10 would probably have come to little more than the price of two. It was found necessary in operation not to withdraw the plate cover completely in order to prevent light getting in from the side. A mark was made across the plate approximately 2" from the inside edge to indicate the extent to which it was to be withdrawn during exposure. The glass was an 8" × 10" × 0.1" photographic plate cut to 8" square. It was stuck to the frame with Dow-Corning sealant and painted round the edge with black paint to make sure it was light-tight. A working drawing is given in Appendix B.
For the programmer to make use of the Still Camera a routine named STLCAM is provided which may be called in addition to, or instead of, the Frame Advance command. Although the frame advance mechanism can still operate, the drive performs no useful function. The first entry to STLCAM outputs a message to the SD-4020 operators to mount the Still Camera when the SD-4020 comes to a stop. Before writing the stop command to tape the software buffer on the host computer has to be emptied to ensure all plotting commands up to that point have been output. The stop command can be a single file-mark (tape-mark) or a special End of Job command (octal 37) present on some SD-4020's. A count must be output for the operators as to how many stops and hence separate pictures are to be expected. This is due to the fact that when the End of Job is operative, the logic does not then recognise End of File - at least on our machine - and parities are invariably indicated as it runs over into old data. When the count has been satisfied the End of Job condition is switched off and the tape comes to a normal termination which in our case is when multiple file-marks in successive records or blocks are read. The count, relayed to the operators, is of further use in planning as to when these jobs can be conveniently run.
The object was to determine what colour effects could be obtained from the standard tube as supplied with the SD-4020 without permanently affecting normal operation and keeping hardware modifications to a minimum.
Colour films such as Ektachrome EF used in the cine-camera supply cassette on an SD-4020 will give light-blue traces on a blue-black background. The crossing and overstriking of lines unfortunately produce marked changes in density and this restricts the usefulness of colour film output. However, for those applications that can make use of it, it is sometimes useful to be able to distinguish between parts of ihe picture as clearly as possible. At one stage it was hoped that a plastic scintillator absorbing in the blue followed by re-emission at the red end of the spectrum could be utilized to generate different colours. This proved unsuccessful although there were indications that the process was occurring at the edges of the material. The technique adopted was where a red colour filter was placed in the forms-flash unit, and a suitably modified copy of the cine-camera shutter made to permit a second filter to be inserted in the light path. The cost of the shutter (Appendix C) was $50 and installation straightforward when carried out by the customer engineer. The background colour is produced by flashing the forms-flash unit and this modifies the blue trace wherever it occurs. The recorded colour of the trace on cine film may be varied still further by selecting the hardcopy camera thereby interposing the second translucent filter in the cine-camera shutter. It is important that the two cameras can be selected and advanced as two distinct functions in the software otherwise as many frames on hard copy will be required as for microfilm! It is also necessary that the shutter does not have to operate for alternate points, but rather for groups of points and lines. This saves wear, but more particularly time, which is of the order of l/10th second for alternate camera selection.
Earlier in the year, difficulties were encountered when prints of animated movies from originals were required. Commercial Film Laboratories, although undoubtedly the best as far as conventional film processing was concerned, could not always be counted on for optimum processing or printing of computer generated film. With its low information content or, put another way, its large amount of unexposed background, stringent demands are made on all the processes involved in achieving a good quality result. In-house processing proved to be the best solution to one half of the problem with much improved turnround as an added bonus. It was hoped that printing could be solved equally effectively.
Diazo printing is one of the most attractive methods, due to the fact that exposure and dry developing occur within the same unit and at several feet per minute. The material is about half the cost of silver film and does not require darkroom operation.
The first difficulty was surmounted when perforated 16 mm diazo film was obtained from GAF and tests showed excellent printing quality at 20 feet per minute. The Motion Picture industry was at that time also interested in this system for making rushes. The company primarily concerned later ran into financial problems and ceased to exist.
Unfortunately, no diazo printer/processor with sprocketed feed is available as far as is known and consequently registration presents the only, but major drawback to successful implementation. I only hope that this section of the paper as it stands now may help to publicise the need, though specialised, for such printers: or perhaps even reveal the existence of one.
In conclusion, I must add that the original difficulties encountered in obtaining satisfactory prints have to some extent disappeared since:-
Generally speaking, for best processing-and printing results, I would advise undertaking the work yourself and optimise a simple system for your own stock. Second choice is to find, if at all possible, a photographic department of an allied organisation interested and willing to experiment: and thirdly to use a commercial film laboratory sending stock for processing of which they have experience.
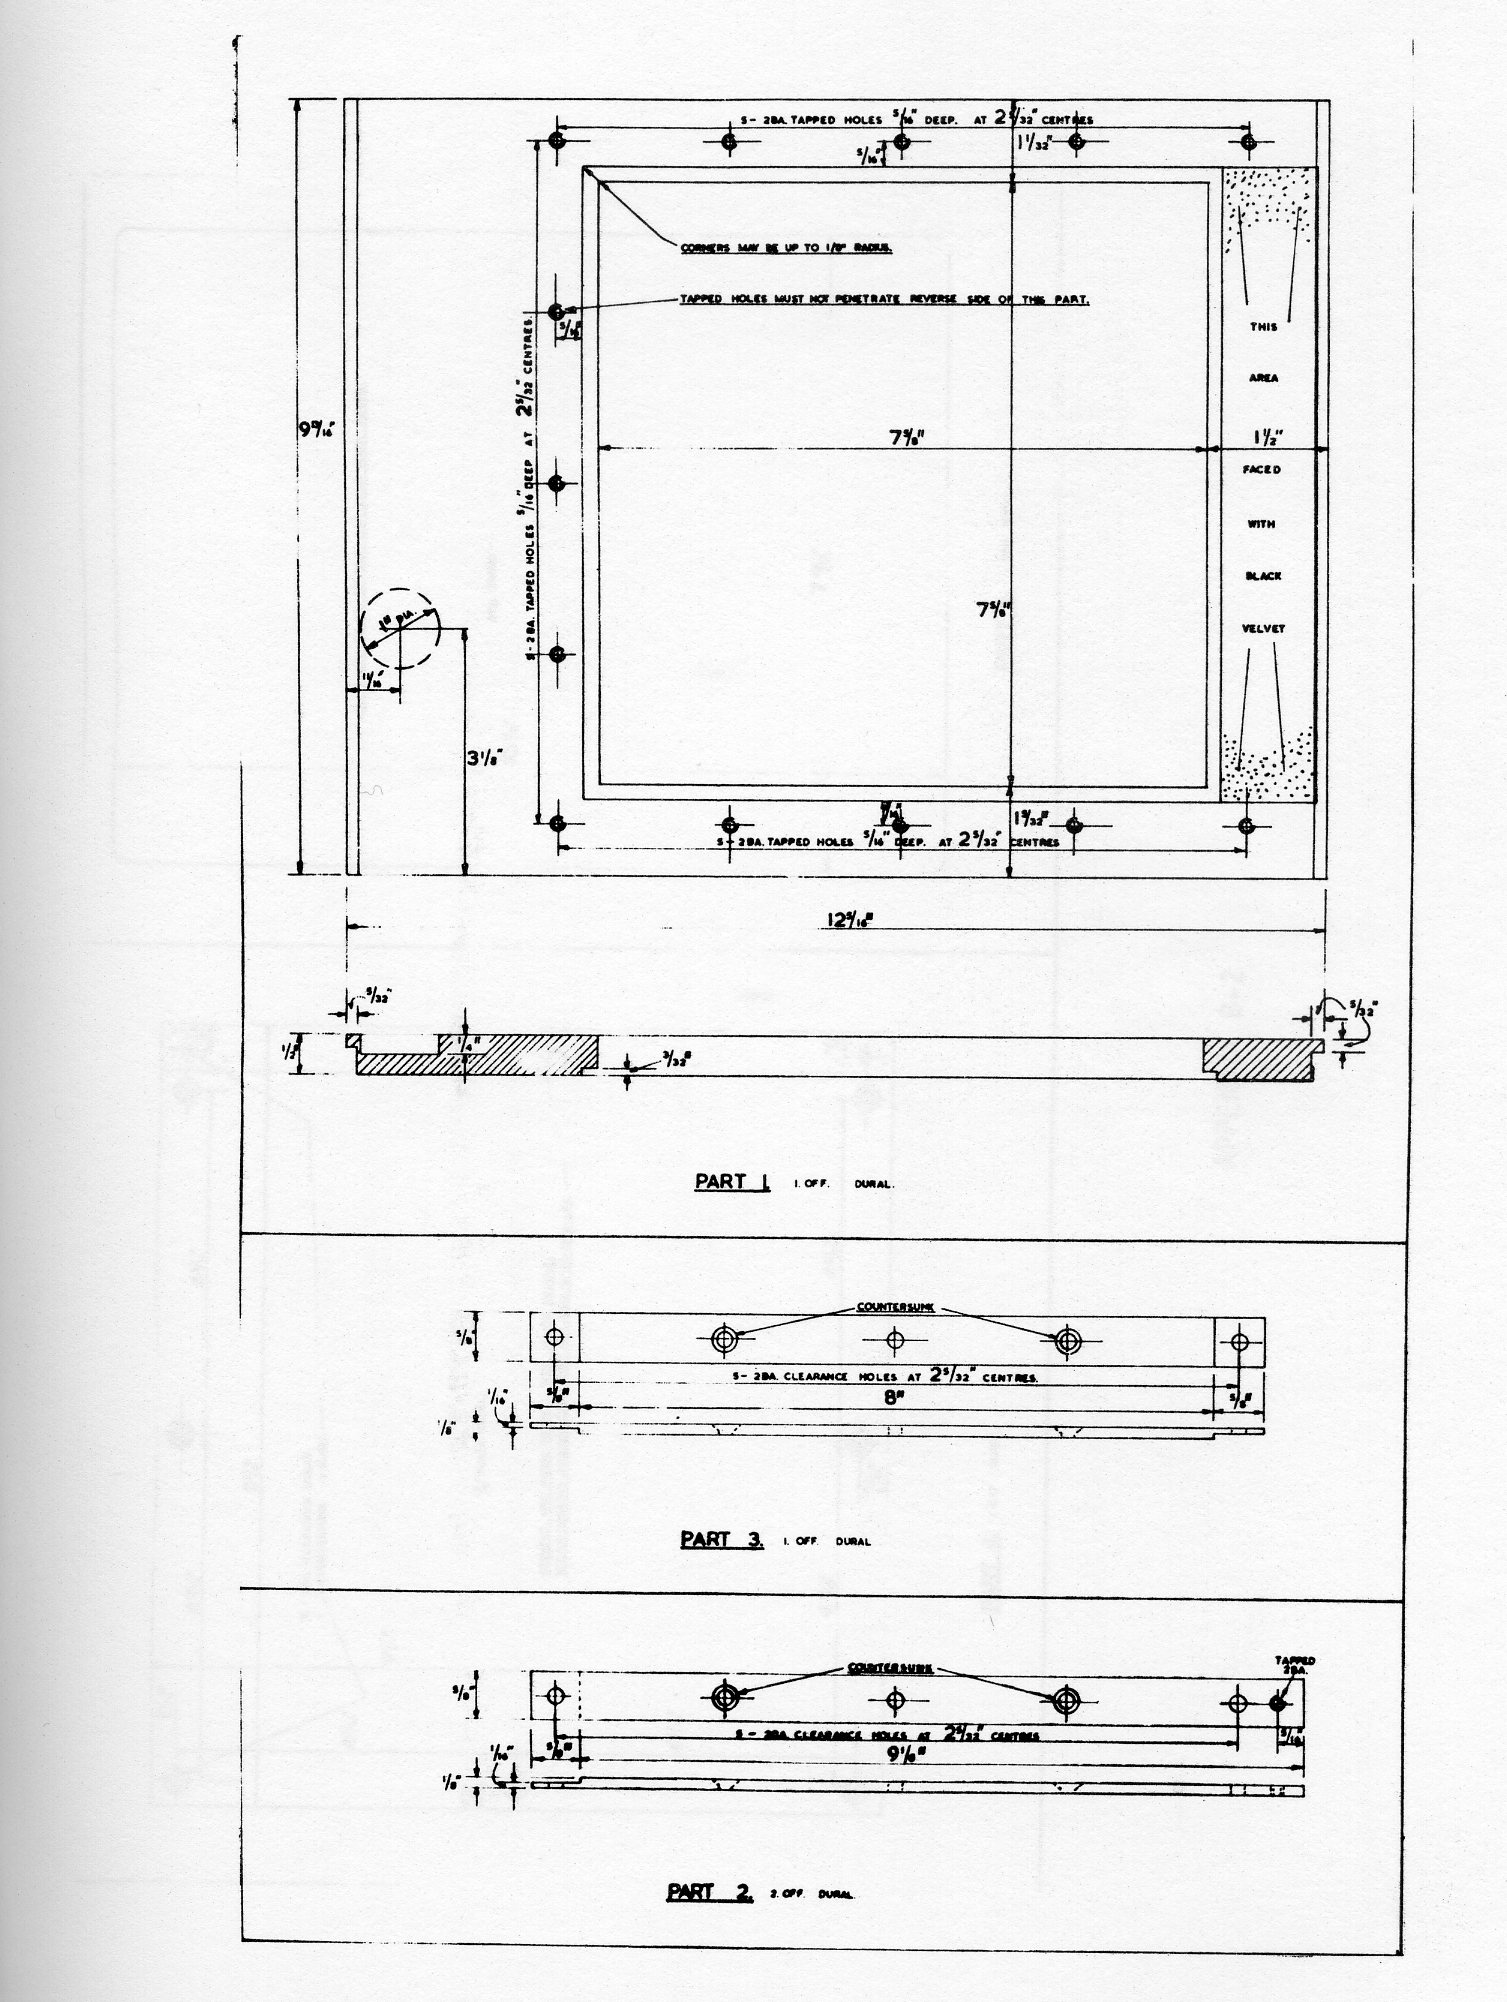
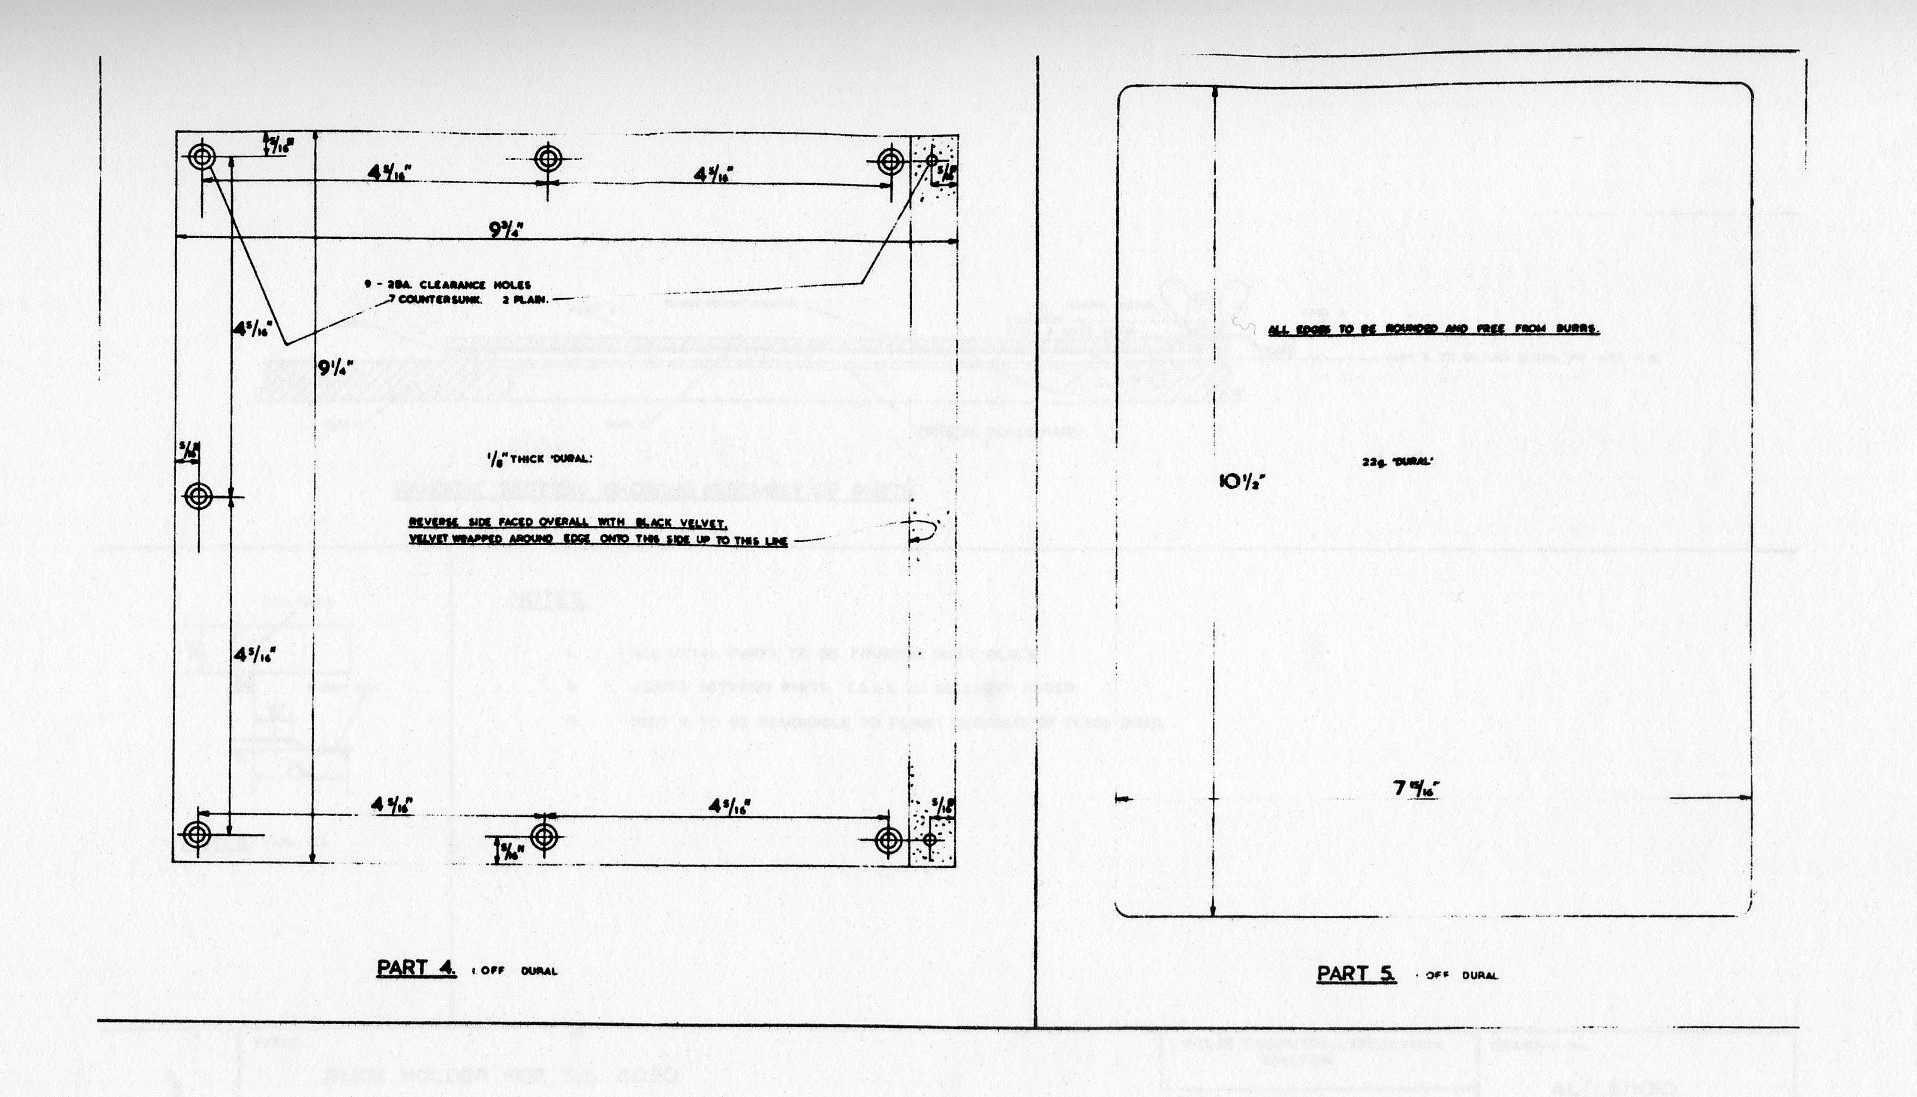
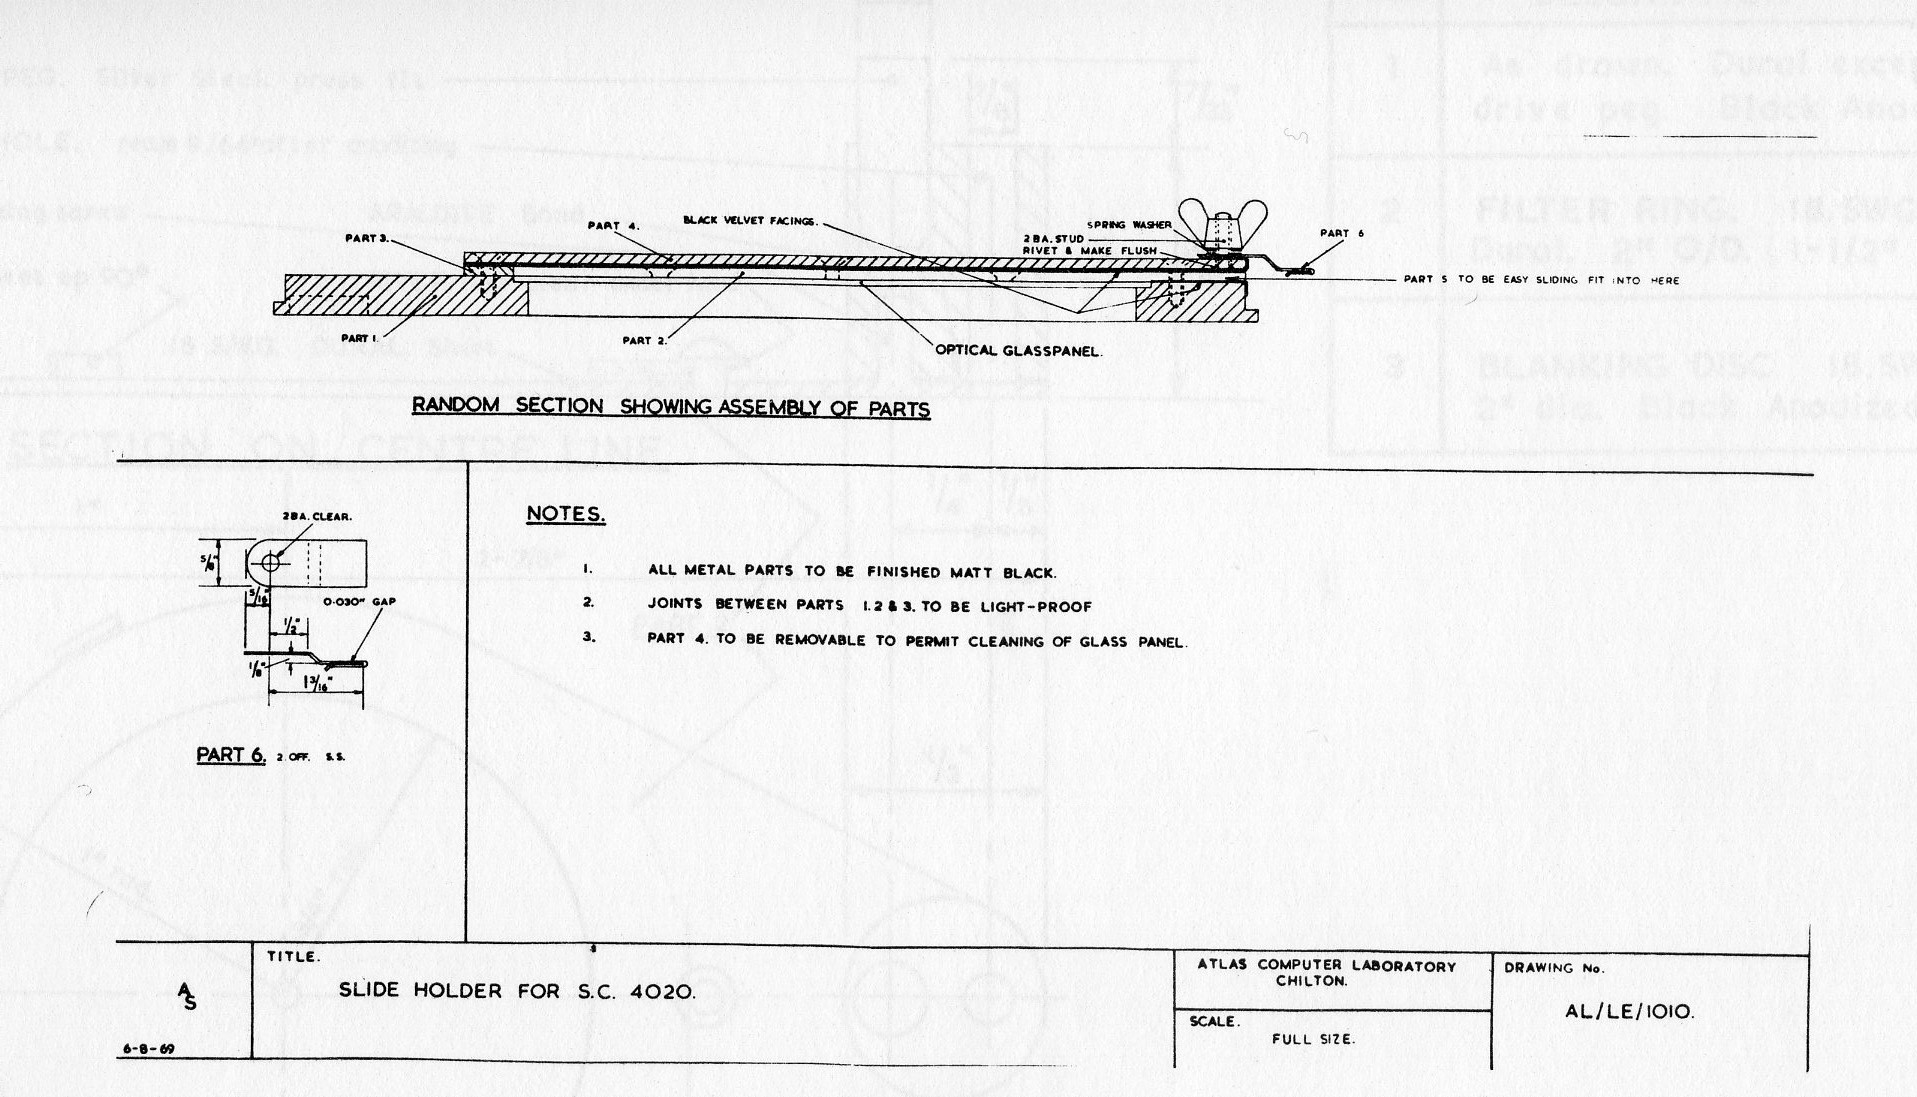
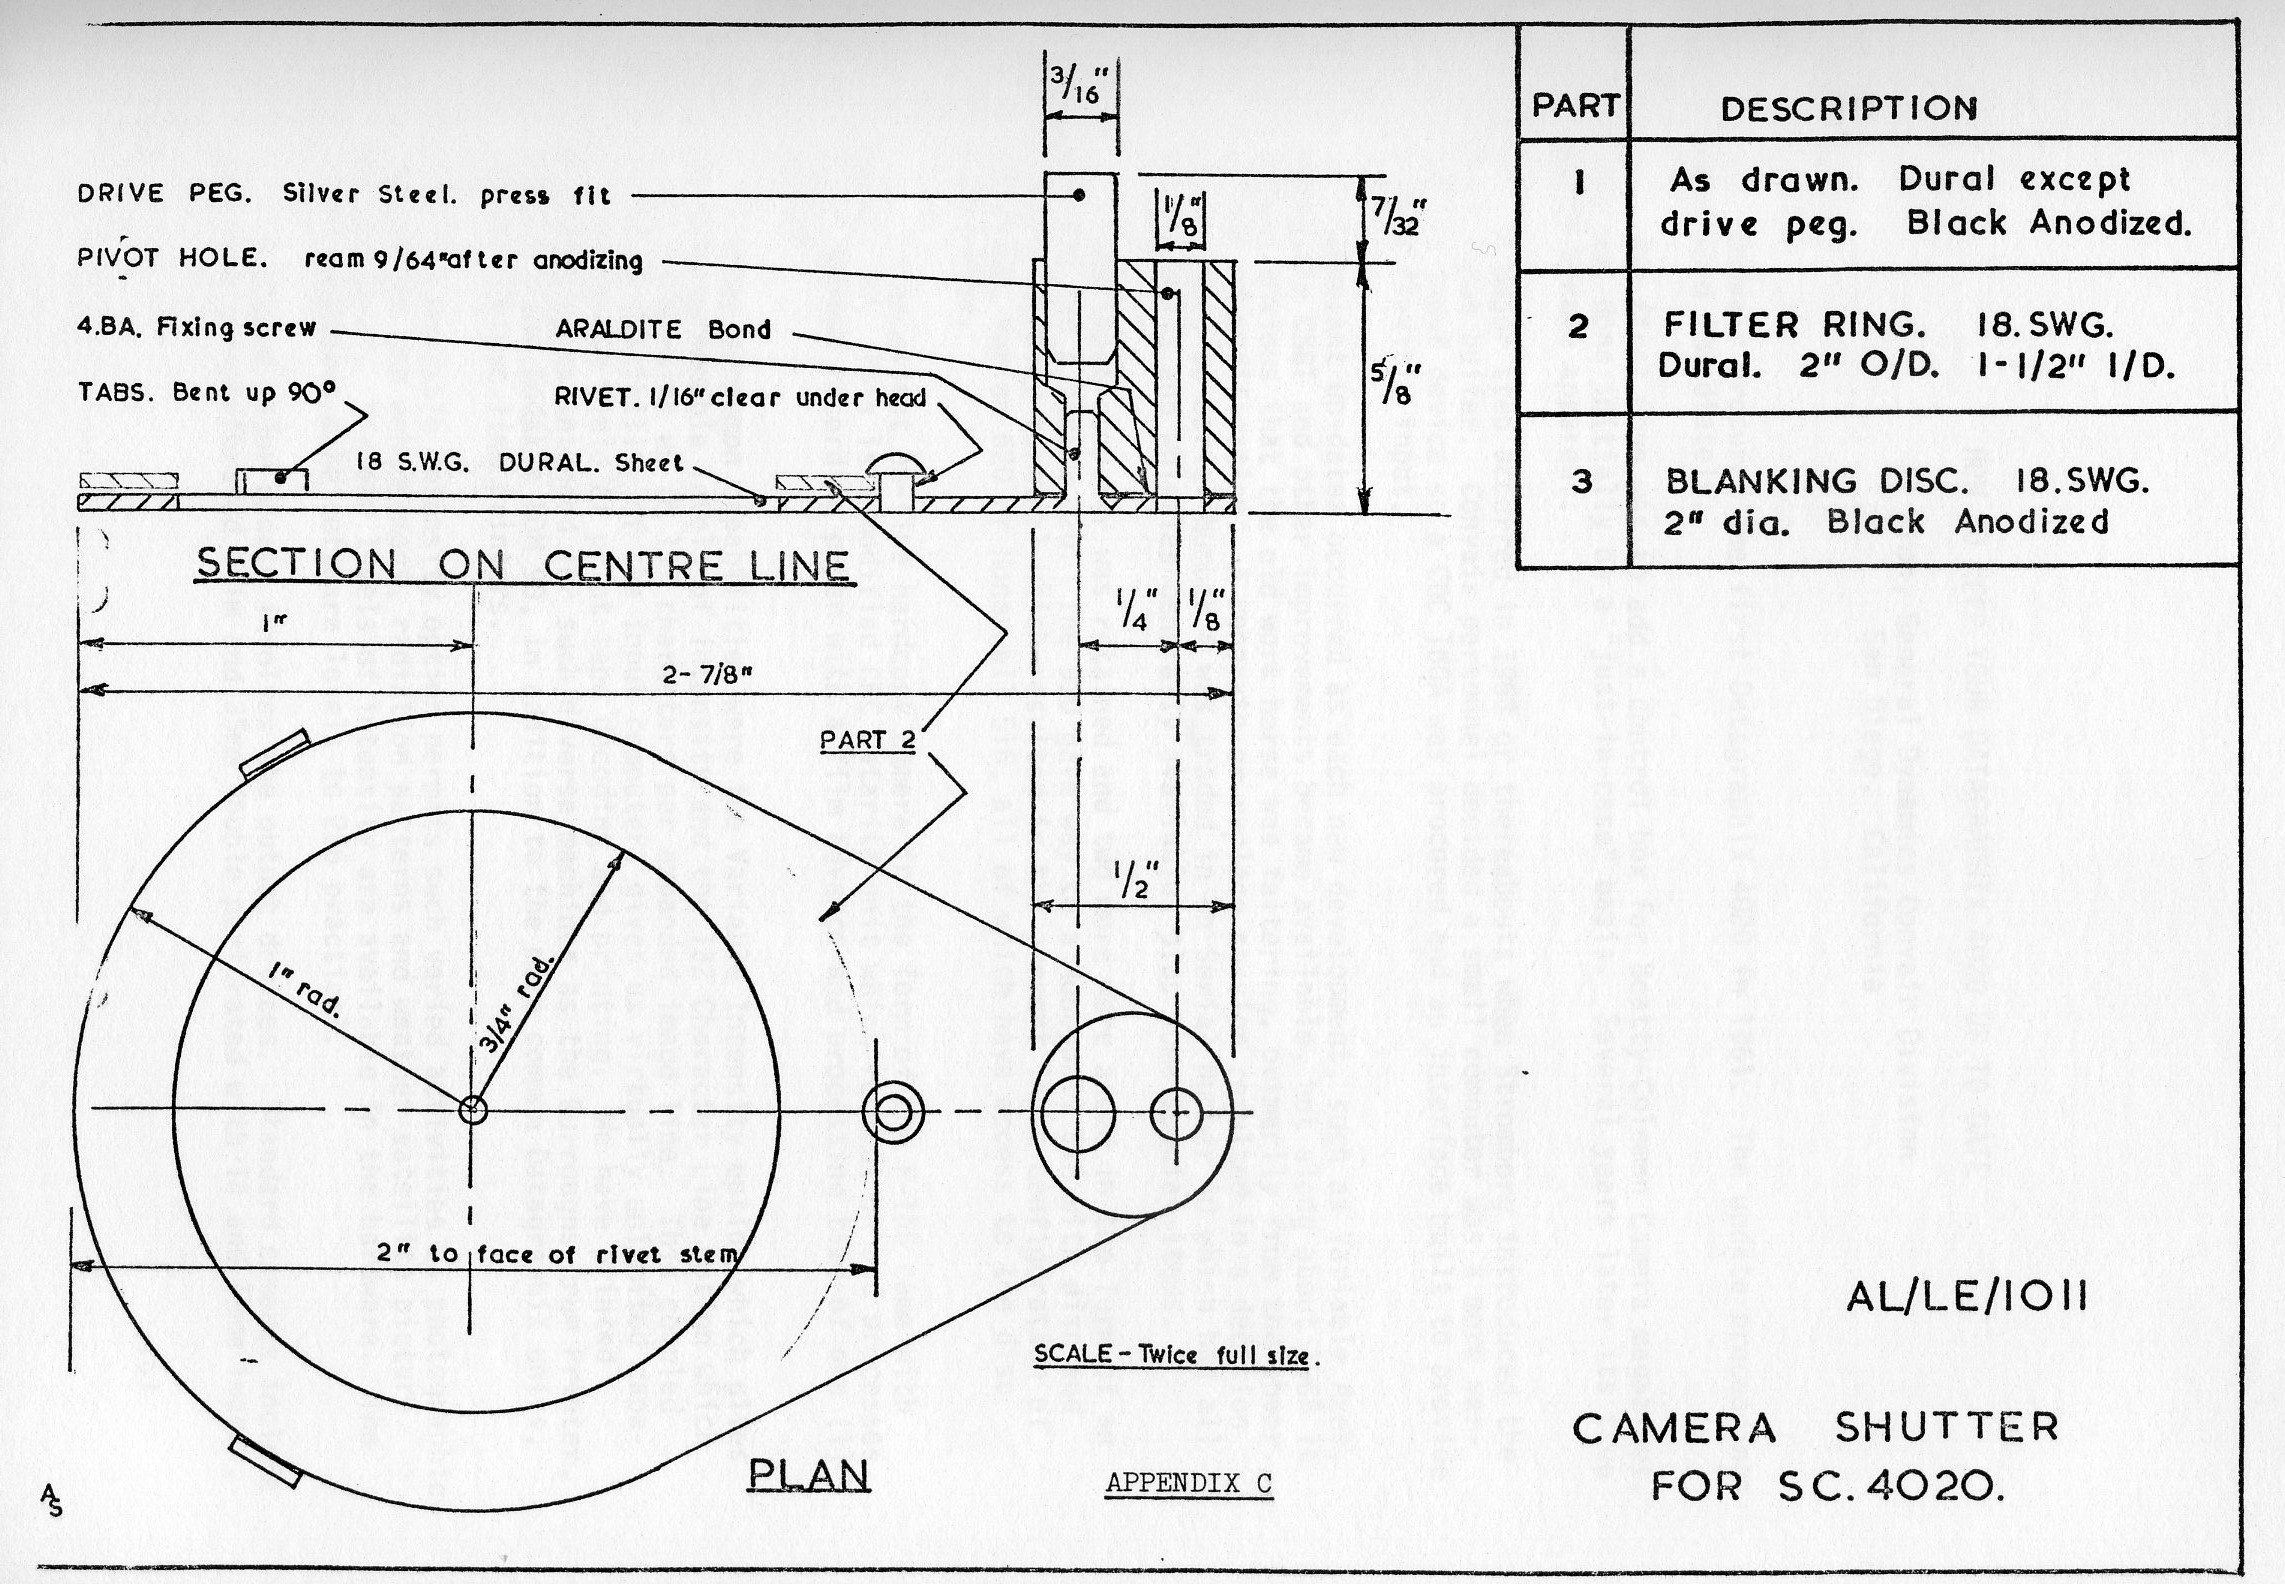
Convair procured the first DatagraphiX 4020 in 1961. The update proceedings commenced immediately.
The first move was to add a control box for Beatty-Coleman Camera magazines. This was done initially on a just-in-case basis. Several years later its true worth became apparent.
A major step occurred in 1963 or thereabouts when Stromberg introduced the F-53 input buffer. Convair personnel decided a small computer was a more versatile input device so a CDC 160A was procured and an interface built to provide a more flexible input.
Constant up-dates occurred as each new development, such as Variable Axes, rotatable CSBT and other improvements became available, but along about 1965 it became obvious that the old work horse was faltering, primarily from the sheer weight of modification. A renovate or replace session resulted in a decision to replace, so Serial Number 4 was traded in on Serial Number 40 which had all of the bells and whistles generally available, plus some special items.
The input computer was retained and two more were added in the form of an SDS 930 and a Varian 620. The 930 gave way to a Honeywell 516 with disc and graphic display terminal which resulted in the present input configuration of CDC 160A, Varian 620 or Honeywell 516, all of which have access to the disc controller.
An excellent on-line hardcopy camera in the form of the F-165 came with Number 40. This is a modified CEC Datarite unit which records on and processes oscillograph recording paper with a film advance and processing time of one (1) second.
Other uncommon capabilities were the Variable Intensity option which gives us 16 programmable levels of intensity and the 132 Character Line option which actually permits up to 147 characters per expanded image line. This coupled with the flexibility of the input computers gives us virtually unlimited capability in the field of print tape decoding and printing. We have printed directly tapes intended for such diverse machines as the Burroughs Drum Printer, 3M's EBR and Kodak's KOM 90, in addition to the more common DatagraphiX units, IBM and Univac line printers.
The variable intensity option permits such varied activities as photographic correction and enhancement, radiation patterns and weather satellite picture construction. Sixteen levels of intensity are available in the hardware. The input computers make software levels to 256 practical. A second major update involves the output devices. Standard cameras include the 16mm non-perforated film and 35mm double perforated with 14 and 18mm images, respectively. The Beatty-Coleman magazine device mentioned earlier has become a work horse in its own right with the development, in order of appearance, of the following:
This brings us up to date on hardware improvements to the DatagraphiX 4020 insofar as capability is concerned. We have accomplished a great deal in the reliability area by means of a rigid preventive maintenance program, improved ventilation and modifications to permit partial shut-down during idle times.
Our software capability is improving constantly with such items as software forms flash; frame repeat and background storage for movie programs; page storage to permit flexibility in formatting multiple page frames of film and the aforementioned line printer simulation.
Time does not permit details on the movie software programs, but I would like to mention that they have resulted in up to 75% of savings in lost computer time when programming movies and have even permitted us to increase or decrease running time by varying, selectively, the number of times a frame is repeated without re-running the program on the host computer.
As an after the fact addition, I would like to mention that our current update project is to add microfiche capability during the first quarter of 1971.
The question this that first comes to mind in a paper of type is:
The reasons were four-fold. First, as delivered, the IGS package would not run under CMS (Conversational Monitoring System) with which most of our users work. The in-out, as I suppose you know, is quite different and thus PACKZZ had to be modified.
Second, I don't believe a systems program (or any other program for that matter that is going to be run repeatedly with little or no modification) should be written in a higher level language. I can understand DataGraphix position in writing it that way. If I were supplying many users of different equipment, I would be reluctant to go to the expense of providing a different machine language program for each users device too.
Third, we run an open shop. You who have worked in an open shop know what that means. Many programmers feel that if they have found a program that works, that is it. No changes! Nothing new thank you!
And fourth, partly for the above reason, I was against letting our programmers even see an IGS call with the modes array as an argument of the call The waste of core space and the possibility of error was too great to let out under any circumstances.
Well, we had at that time a 4020 with a 7-track tape drive and a 4060 with 2 9-track tape drives, and we were going to run an acceptance period with one backing up the other. So the first step was to get a 7- to 9-track conversion procedure set-up. Then we could use the 4020 simulator on the 4060 to see how the output looked.
Next, we went the other way. We modified PLOT to write a 9-track tape and set up the procedure to convert 9- to 7-track in case the 4060 failed.
This was followed by writing a PACKZZ that would work under CMS and a METAZ (note one z) that accepted only scope raster positions in integers as input. This let us write Fortran programs to use the full capability of the 4060 meta language and get a feel for the features of the 4060. This was so successful that some programmers like our Bob Davis whom you all know still do most of their programming using only METAZ and PACKZZ.
The next step in our conversion was the one to get our open shop users to the meta string tape without disturbing them. As I suppose you all know PLOT, which does all the tape writing is fenced off from the higher level programs that most of the simple-minded (ah don't tell them I said that) programmers of SCORS use. There is only a small handful of programs that ever actually call PLOT. These programs are: CAM1V, CAM2V, CAMBV, BIGV, SMALLV, ADVPV, PROJV, RESETV, STOPV, PLOTVI, PLOTV, BRITEV, FAINTV, TYPEXY, XAXISV, YAXISV, LINE3V, TYPEV, TYPEON, and LINEV. Most of these were readily changeable to meta language and with changes to STOIDV the proper initialization was accomplished. We were ready to go. The operation was so successful that I have had people come down and tell me they hear that there is a new plotter, the 4060, out that will replace the 4020. Do we know anything about it or are we going to get one? This, though our 4020 has been gone for over a year.
The last step in this process was the establishing of an IGS library in the system. Written completely in machine language, the package is basically IGS with the following changes: The modes array is now in common and some entries in the array which were used by only one program were dropped. As stated before there was a gain by a factor of about three in both speed and space. There have also been some problems, first and foremost of which is how do we get our users off of SCORS and over to IGS and thus make full use of the 4060 as an output device.
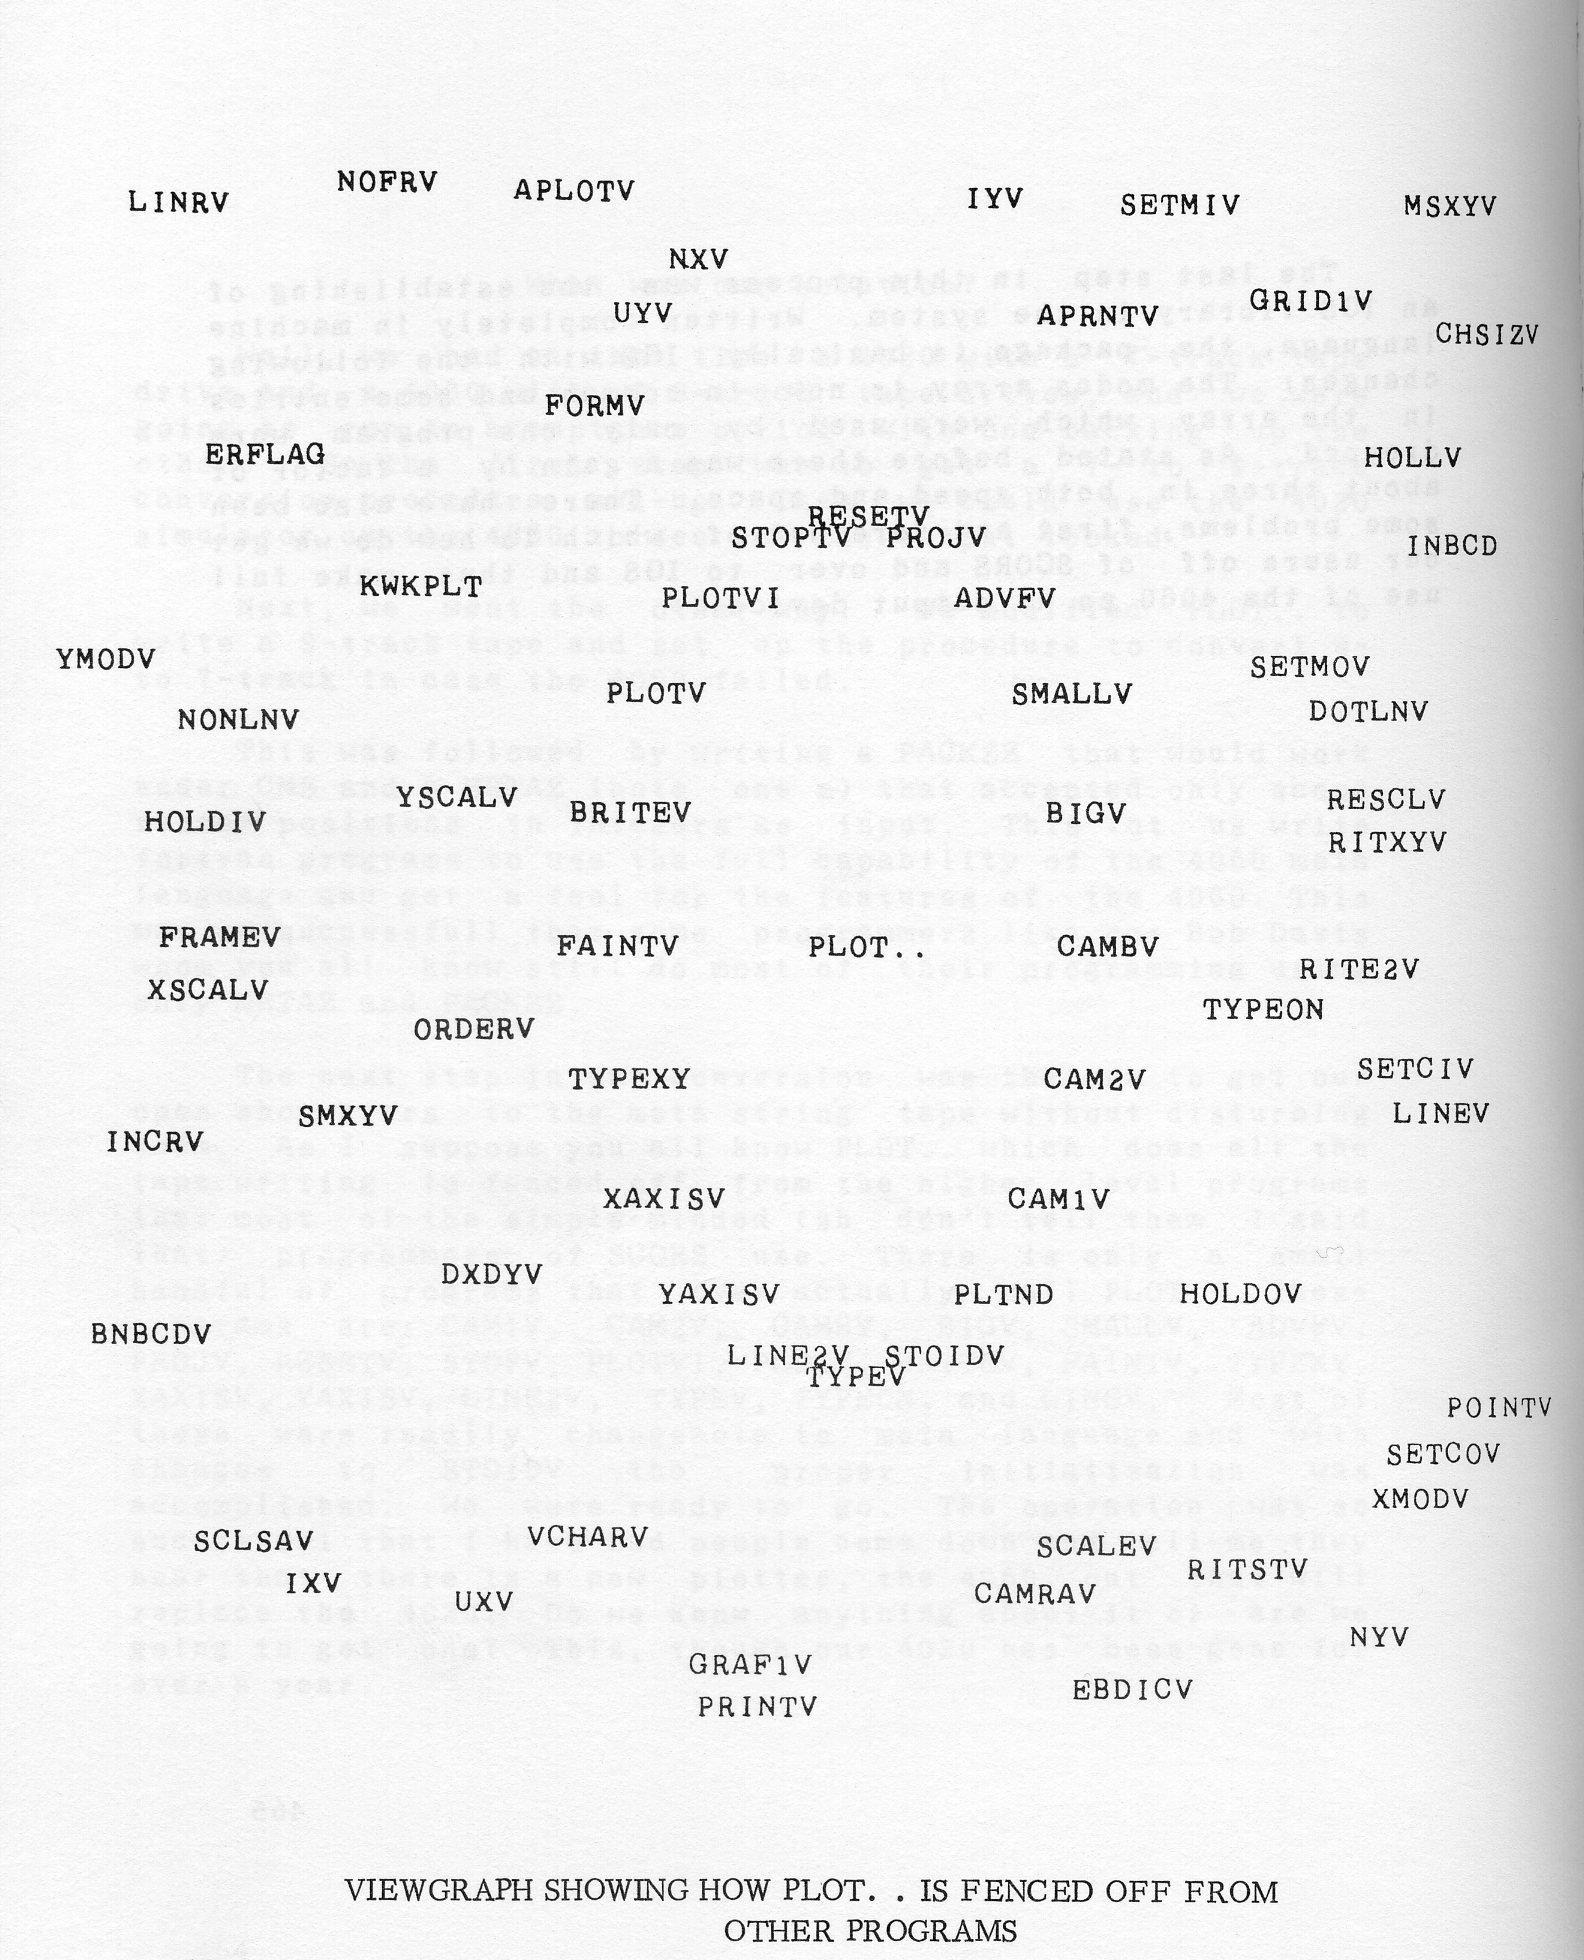
Explained purpose and calling sequence.
Explained purpose and calling sequence.
System routines generally are considered the magic part of any software system. Because of time, these routines will not be discussed at this time.
The Datagraphix 4060 printer and plotter operates with a Product Control Unit (PCU) having a buffer and an internally-stored program capacity of 8192 words. Tapes with varying format may be processed, as the stored program may be so changed; however, the procedure to modify these existing process programs has not been published previous to this document. The occasion arose where the process program for printing Univac 1108 Exec II tapes had to be modified to handle Exec 8 tapes; the procedure outlined below was accomplished with the aid of G. Rosen of Wolf Research and Development Corporation, and has been released to provide other users with this documentation.
Comments relating to this manual may be addressed to George L. Fleming
NOTE: The use of two tape drives is necessary.
If updating a symbolic scrip tape:
    CO       P7400010
    EN
With MCS in core from the boot, load LL16.
Using LL16, then load LL01.
Using LL01, now load SLDT. Before running SLDT, set the following sense switches:
SS1 - Down for magnetic object tape, up for paper object tape
SS2 - Down to load presently positioned file, up to by-pass presently positioned file.
UNIT: 1      2      3      4
SS3: down   down   up     up
SS4: down   up     down   up
Enter the octal address where the inter-sector indirect address word table is to begin into the B register. No address implies a setting of 1008.
Now enter 170008 into P and press START.
A reply of LC implies loading complete and successful [3]
With LL01, in the system from Step 3, load LL16. After going to 160008 and replying to TU NO?, and if a basing address is needed, put the MA/SI/RUN switch into SI, and enter the basing or load address into the B register; otherwise an address of 10008 is assumed. Reset the above switch to RUN, hit START, and reply SYSG to LABEL?.
Mount a blank tape on either tape unit. If a basing address was used, go to that address; otherwise, go to 10008 and START. To the message UNIT, give the output tape number. The message ID should be answered with a four character name which will be the new library name. Characters after the fourth are accepted as comments to be inserted on the tape. The last character is a carriage return.
At this point the program halts.
Load the address of the first word of the core area to be dumped into the A register; the address of the last word, into the B register; hit START and reply YES or NO to the message MORE. If YES, continue as above with the A and B registers. If NO, the system responds with ID. If you have another program to dump, continue as above; otherwise reply END and carriage return. An end-of-library record and an EOF will be output.
Rewind the output (Modular) tape.
Go to 160008, and, with the modular tape rewound and on unit 1, load your new program with LOAD NAME.
Congratulations! You are now finally ready to test your new process program.
To ascertain that it's really there, type STAT. The four character name typed during Step 4 above should be the first word out. NO PG indicates that an error was made in one of the above steps, such as the contents of the A and B registers during the modular tape make. To test the program, remount the SCRIP tape on unit 1, put your test input tape on unit 2, and type START.
1. Scrip Programmer's Reference Manual, Vol. It, P. 3-37 ff.
2. DDP-516 Users Guide, Honeywell Document No. 130071627/M-1043, p. 5-3 ff.
3. DDP-516 Users Guide, p. 5-2 (for any other reply).
4. Scrip PRM, Vol. H, p. 3-30.
Additions and modifications to the SD 4060 set of subroutines which enable a user to produce his SD4060 plot on the line printer without altering his program are discussed. The capabilities and limitations of the line printer are considered in relation to programming techniques.
Each display is output on one 11 × 14 page, with the whole page being printed when the frame advance command is given. The idea of a raster unit is maintained but a page is considered to have 132 raster units across the page and 63 raster units down the page, and the appropriate scaling takes place as in the SD 4060.
A crude but reasonable likeness to the CRT produced plot is obtained. More important, an attempt has been made to faithfully duplicate all the IGS error messages so that the line printer version will have value as a debugging tool.
It very often happens that the users will be remote from the SD 4060 Cathode Ray Tube (CRT) for a particular installation. This may lead to a slow turnaround between submission and receipt of an application program, and there is no guarantee that the program has produced the desired effect until one actually sees the hard copy itself. In order to produce the hardcopy with a much improved turnaround time, it was decided to simulate the necessary SD 4060 IGS routines, generating a line printer display instead. This would enable a user to experiment with layout details and scaling factors at a faster pace than was possible before, producing the final desired result on the SD 4060 CRT itself. Of course, one might find the line printer display was not sufficiently detailed and would have to revert back to experimentation on the SD 4060.
It was necessary at first to spend considerable time trying to gain an understanding of the IGS package. A new concept was involved here, that of harnessing the power of the existing IGS routines as written for the IBM System 360 to produce device-oriented output. At present, we can have either line printer or Gerber Automatic Drafting Machine displays produced, using the IGS routines. In addition, the routines, including PACKZZ, were required to be written in Fortran IV G.
Three decisions were made initially because of unique characteristics of the line printer. First: A single 11 × 14 line printer page was to be treated as the output unit; other possibilities included extending the display over several pages at a 90-degree orientation. This decision defined the working area of the raster on paper to be rectangular with 63 addressable points in the vertical direction and 132 in the horizontal. Although there are usually 66 lines to a page, it was decided to allow a margin of 3 lines to avoid the perforation; therefore, we have the 63 addressable points in the vertical direction.
Second: Because the line printer can only move in the forward direction, the design must be retained somehow after the use of an individual IGS routine and displayed only when complete. This necessitated a buffer area of size 8316 bytes to hold the display until the frame advance command is given by the user.
Third: Several design features available to the SD 4060 IGS user obviously could not be incorporated in the line printer simulation; for example, no distinction between upper and lower case characters could be made, there could be no accommodation for Special characters not available in the printer's character set, and no character rotation is possible. No choice was available with respect to these features, but two further limitations were imposed. Because of the visual effect, it was decided to omit the grid feature available in the SD 4060 routines. A continuous line can really only be represented on the printer by a string of periods, and it was felt that a grid combined with a few curves would not be aesthetically pleasing to the viewer. It was also decided not to reproduce the tab setting routine due to anticipated difficulty and lack of use in our installation.
The decisions outlined in the previous section laid out the ground rules upon which the programming effort was based. As expected, METAZZ and PACKZZ absorbed the bulk of this effort, but trial and error showed other routines to be in need of slight modification. The whole IGS package had to be studied in order to ascertain the arguments passed through to PACKZZ and METAZZ before it was determined which calls could be safely replaced by dummy statements. All error messages had to be preserved so that these line printer routines would be valuable as a checkout tool.
The line printer page is represented internally in the computer by a COMMON area labeled PLTZZ which holds an array OTAR dimensioned 132 × 63. By a call to MODESG this array is filled with spaces. Subsequent calls to other IGS routines build up the display inside this array. One problem occurs when two routines attempt to use the same array element; in this case, the first routine to use that element has precedence. In the SD 4060 both routines could write on the same space although the result might be confusing. No allowance could be made for character spacing or scaling down, and so labeling leaves something to be desired at times.
A different set of default values in the mode set array was needed to go along with the subroutine modifications. For example, the default unit number in the line printer version should be 6 and not 10 to take advantage of the fact that unit 6 in Fortran is usually the line printer. Generally, the other changes have to do with scaling, substituting 131 for 4095 and 62 for 3071. This can cause trouble if a user's program references the mode set array directly for calculation purposes.
Many of the remarks made above apply also to the Gerber ADM although this routine more nearly approximates the SD 4060 and the accuracy is much greater.
Both sets of routines are available to the user in the system library, the former under the name of PRNTPLOT, the latter under the name of GERBPLOT. The user does not have to alter his Fortran program in any way; it is only necessary to make reference to the routines in the linkage step.
The total programming effort used in developing PRNTPLOT and GERBPLOT was 7 man-months.
Some aspects of the IGS have not as yet been tested under PRNTPLOT or GERBPLOT as the IGS routines have not been used to their full capacity by our users; e.g., no one has tried to create his own character font.
Figures 1, 2 and 3 illustrate a histogram produced by the SD 4060, the line printer, and the Gerber ADM, while Figures 4, 5 and 6 show a cumulative frequency distribution curve produced by the same devices.
PRNTPLOT has been well received by users and seems to have fulfilled its promise of speeding up checkout and turnaround. Users' comments are always appreciated, and feedback from users has been of prime importance in the development of PRNTPLOT. The two things that concern users the most are:
| STANDARD SD 4060 | PRNTPLOT | GERBPLOT | |
|---|---|---|---|
| CHARZZ | N/A | N/A | 716 |
| COORZZ | N/A | N/A | 636 |
| EXITG | 612 | 612 | 416 |
| EXITZZ | 304 | 246 | 246 |
| G8RZZ | N/A | N/A | 46 |
| LNOWZZ | N/A | N/A | 1036 |
| METAZZ | 3418 | 3572 | 5078 |
| MODESG | 860 | 588 | 1382 |
| MVCZZ | N/A | 68 | N/A |
| PACKZZ | 1168 | 2000 | 1040 |
| PAGEG | 942 | 942 | 902 |
| PLTZZ | N/A | 8316 | N/A |
| RESETMG | 1352 | 1456 | 1418 |
| SCALZZ | 1262 | 1382 | 1132 |
| SETSMG | 5342 | 5286 | 5490 |
| Total Length of the above Subroutines | 15260 | 24468 | 19538 |
| Excess over standard 4060 | - | 9208 | 4278 |
Note: EXITG and PAGEG in PRNTPLOT are the standard 4060.
Although this paper describes mainly the line printer, and briefly mentions the Gerber simulation of the SD 4060, it seems possible to extend the concept to other output media depending on the cost to the installation involved. The IGS package of routines is as powerful and comprehensive a plotting package as the author has seen, and our work seems to be a natural extension of its use.
GERBPLOT and PRNTPLOT approximately double the computer time needed for a small job with no calculation. Of course, the time taken for any calculations is unaffected by these routines; only the output time is increased.
GERBPLOT has been of limited application, due to the large expense of producing a Gerber plot.
Without the help of the Douglas Aircraft Company Scientific Computing Group and engineers, it would not have been possible to develop the work described herein.
Among people who deserve special mention are J. K Matlock of Scientific Computing who suggested the SD 4060 simulation idea; R. Lawrence who supports the SD 4060 system: M. L. Faverman and G. L. Wang, members of the Scientific Computing team, who provided criticisms and the programs to produce the displays shown; and D. Jester and L. Kaplan, members of the Engineering staff, who helped in checking out the routines.
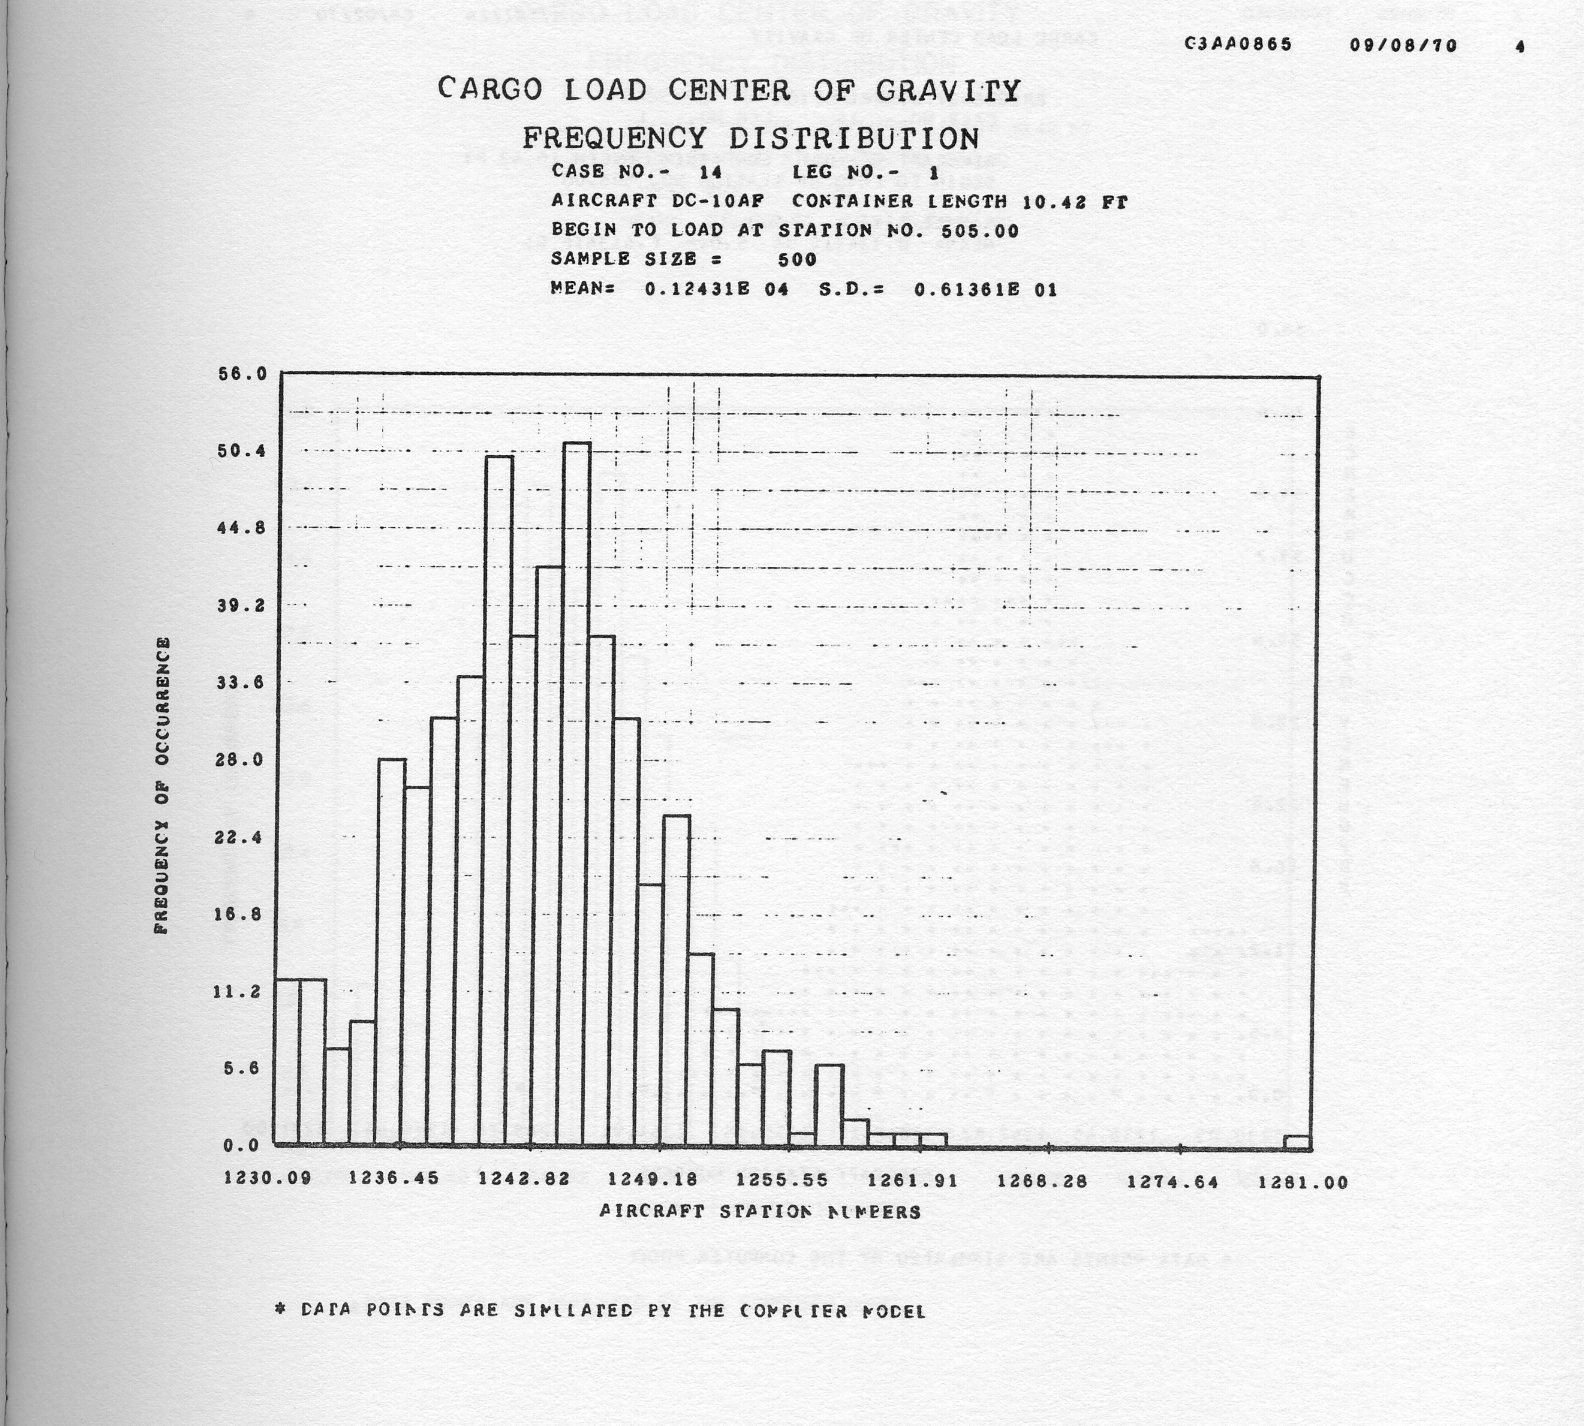
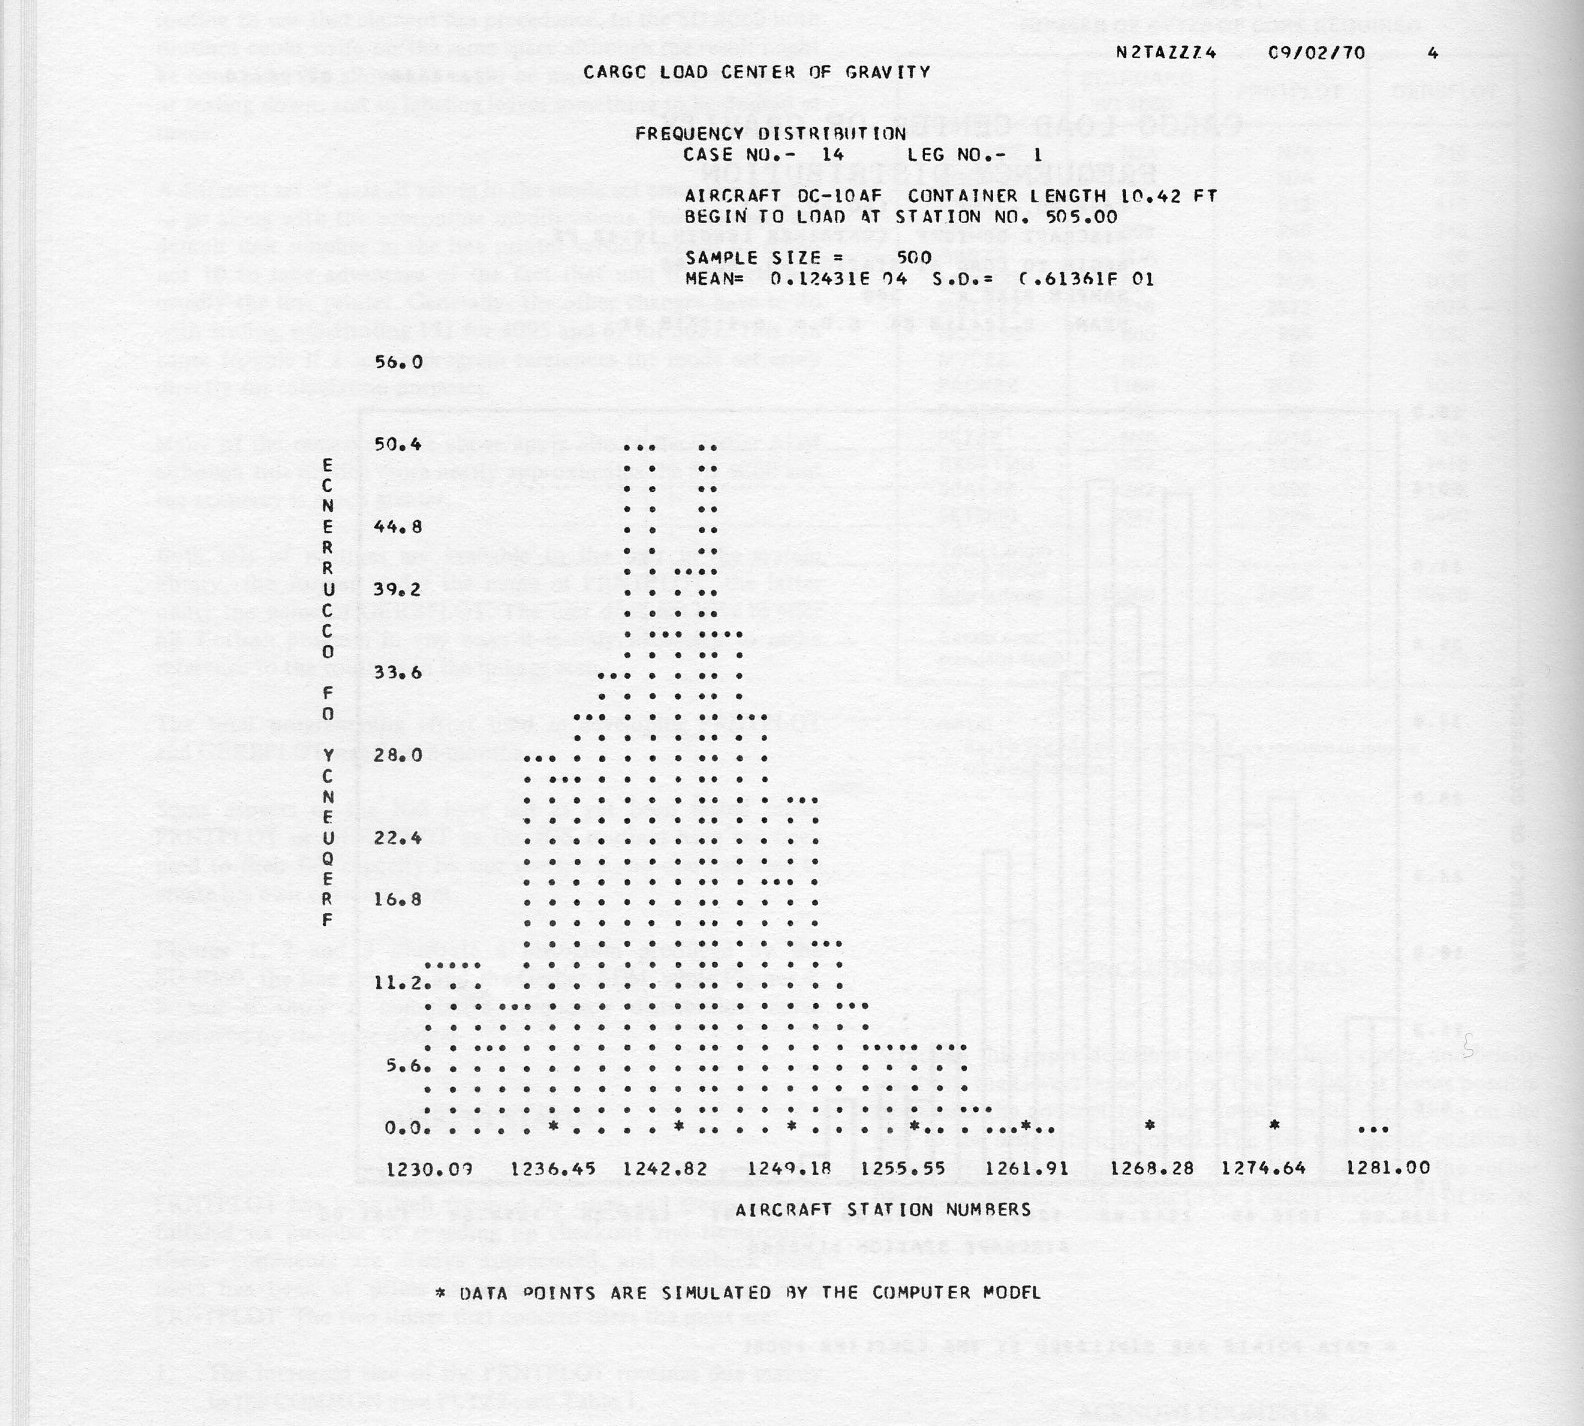
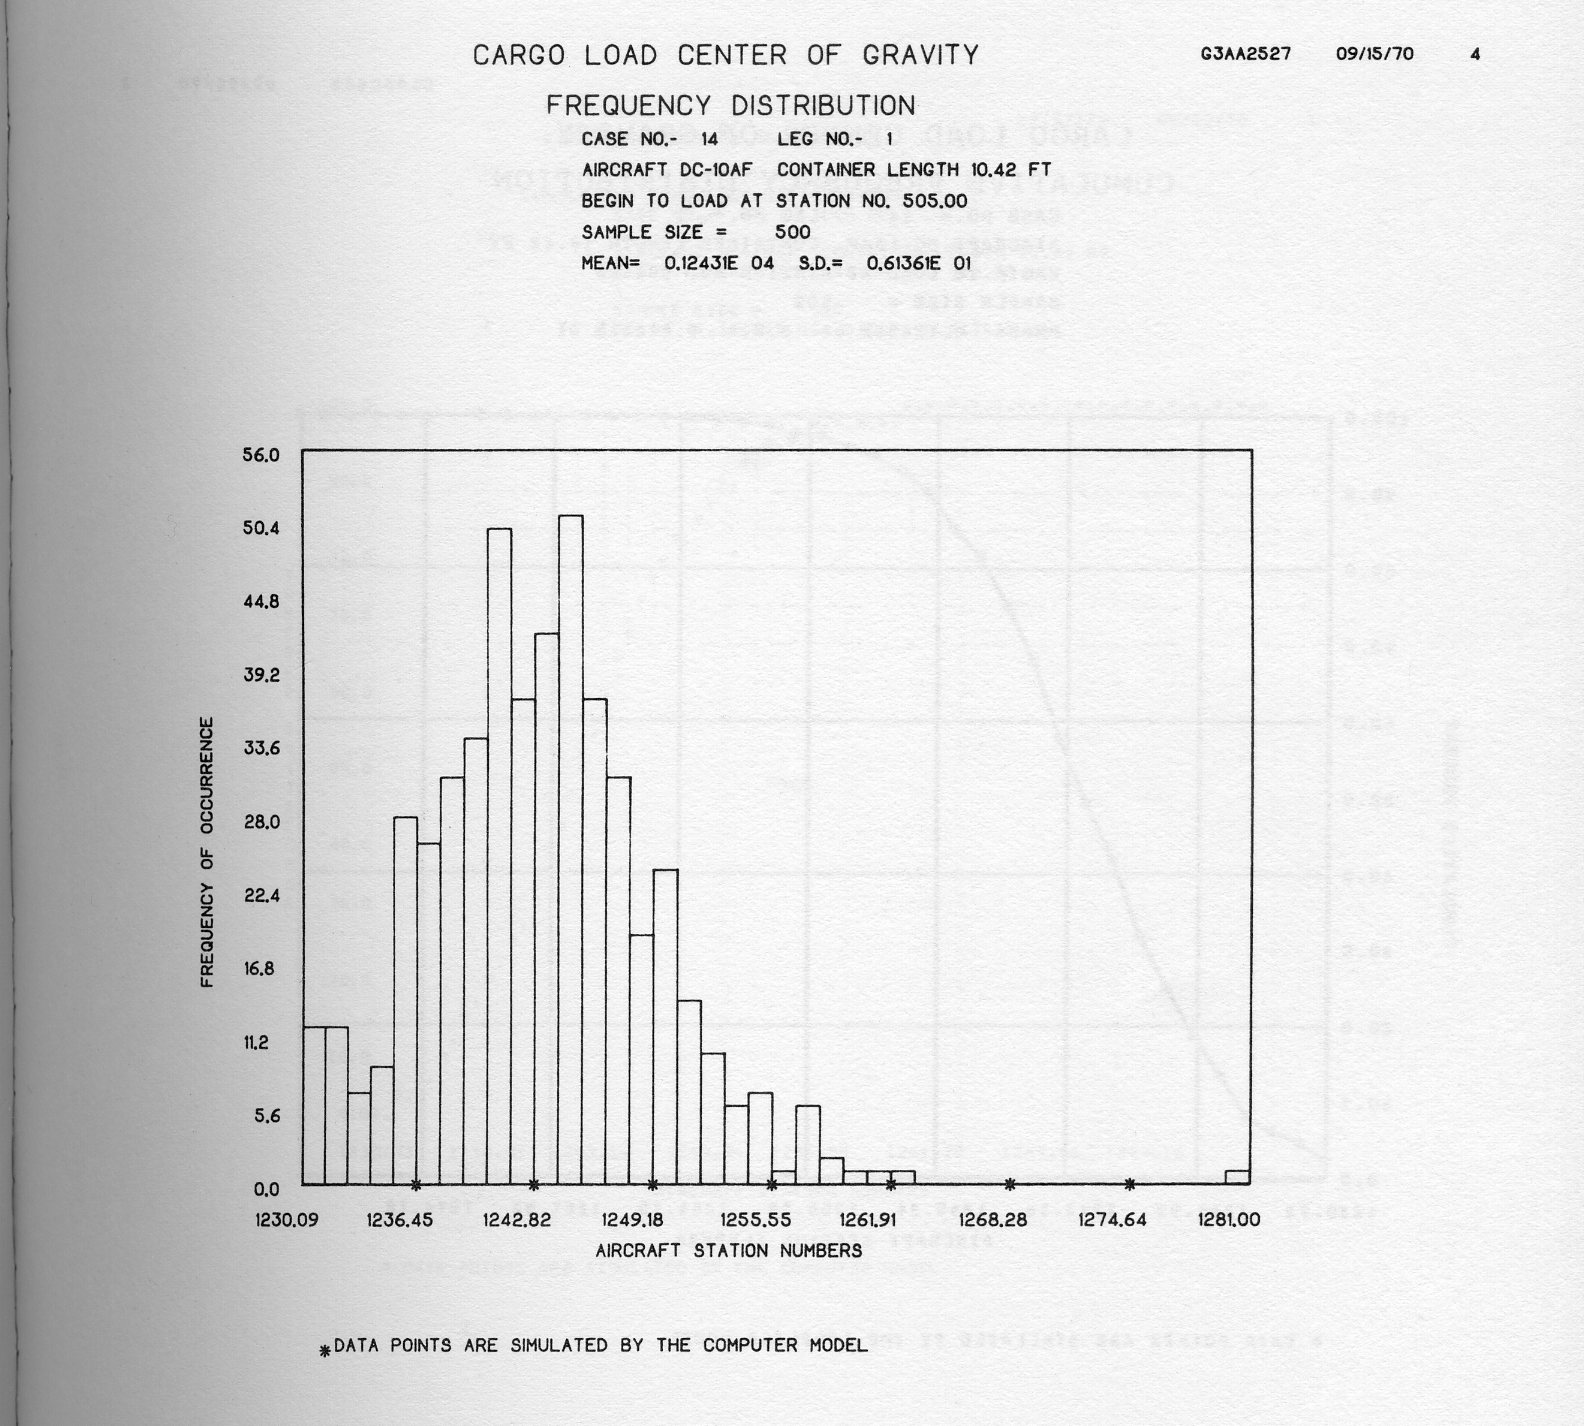
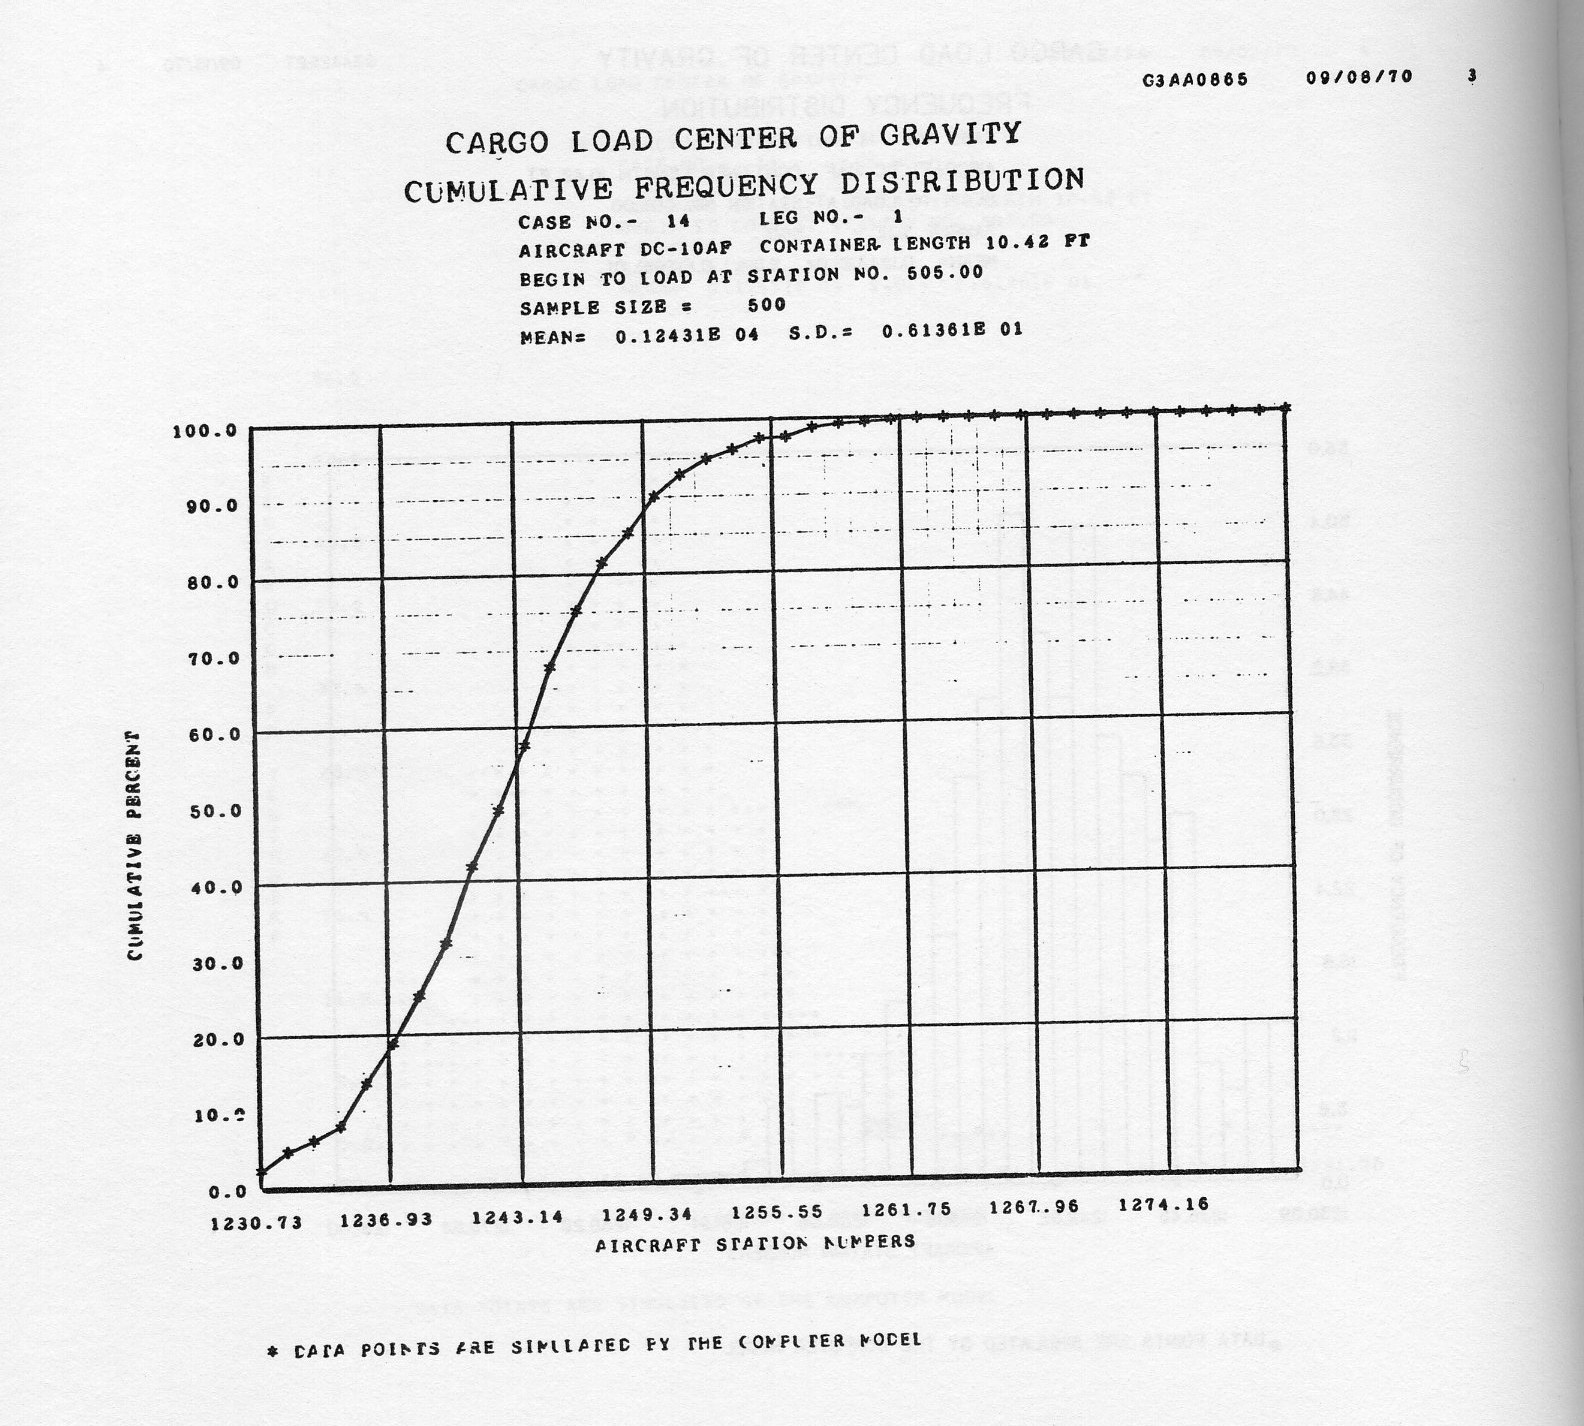
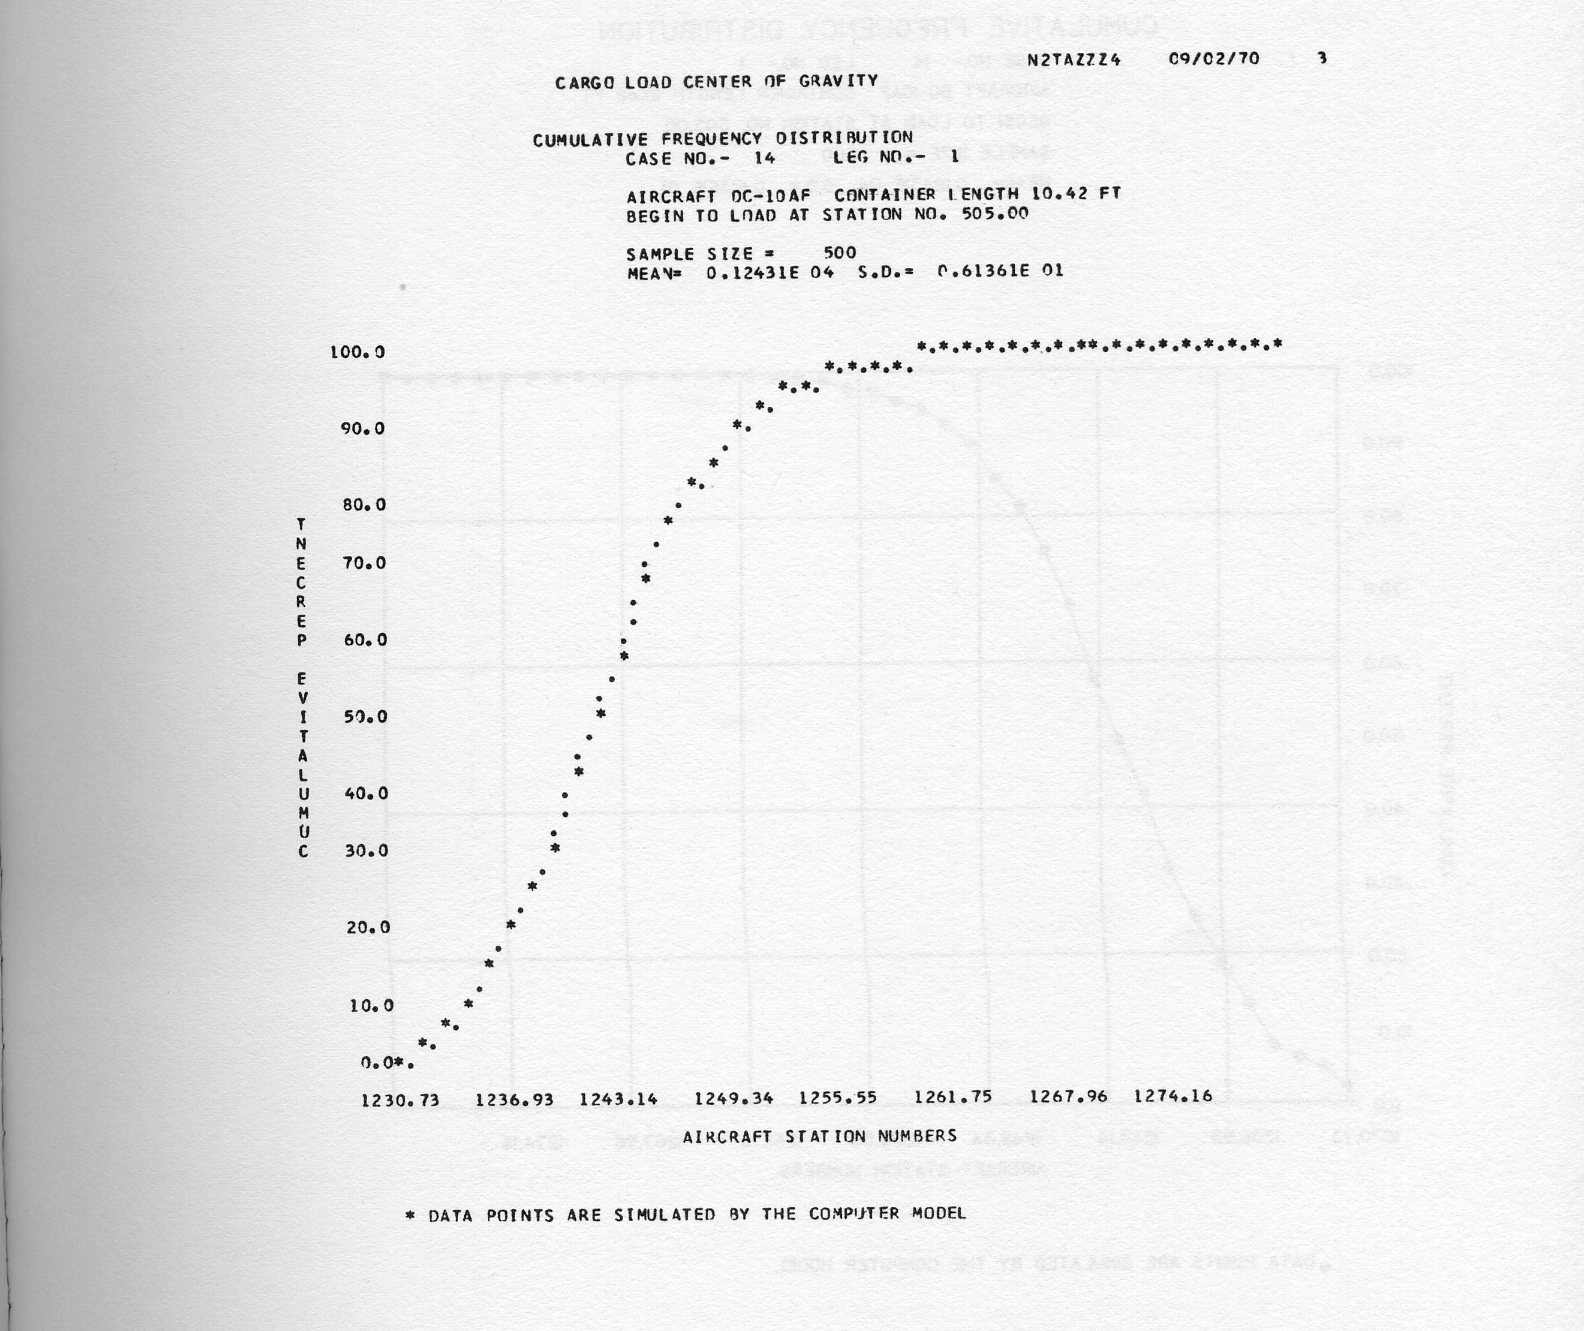
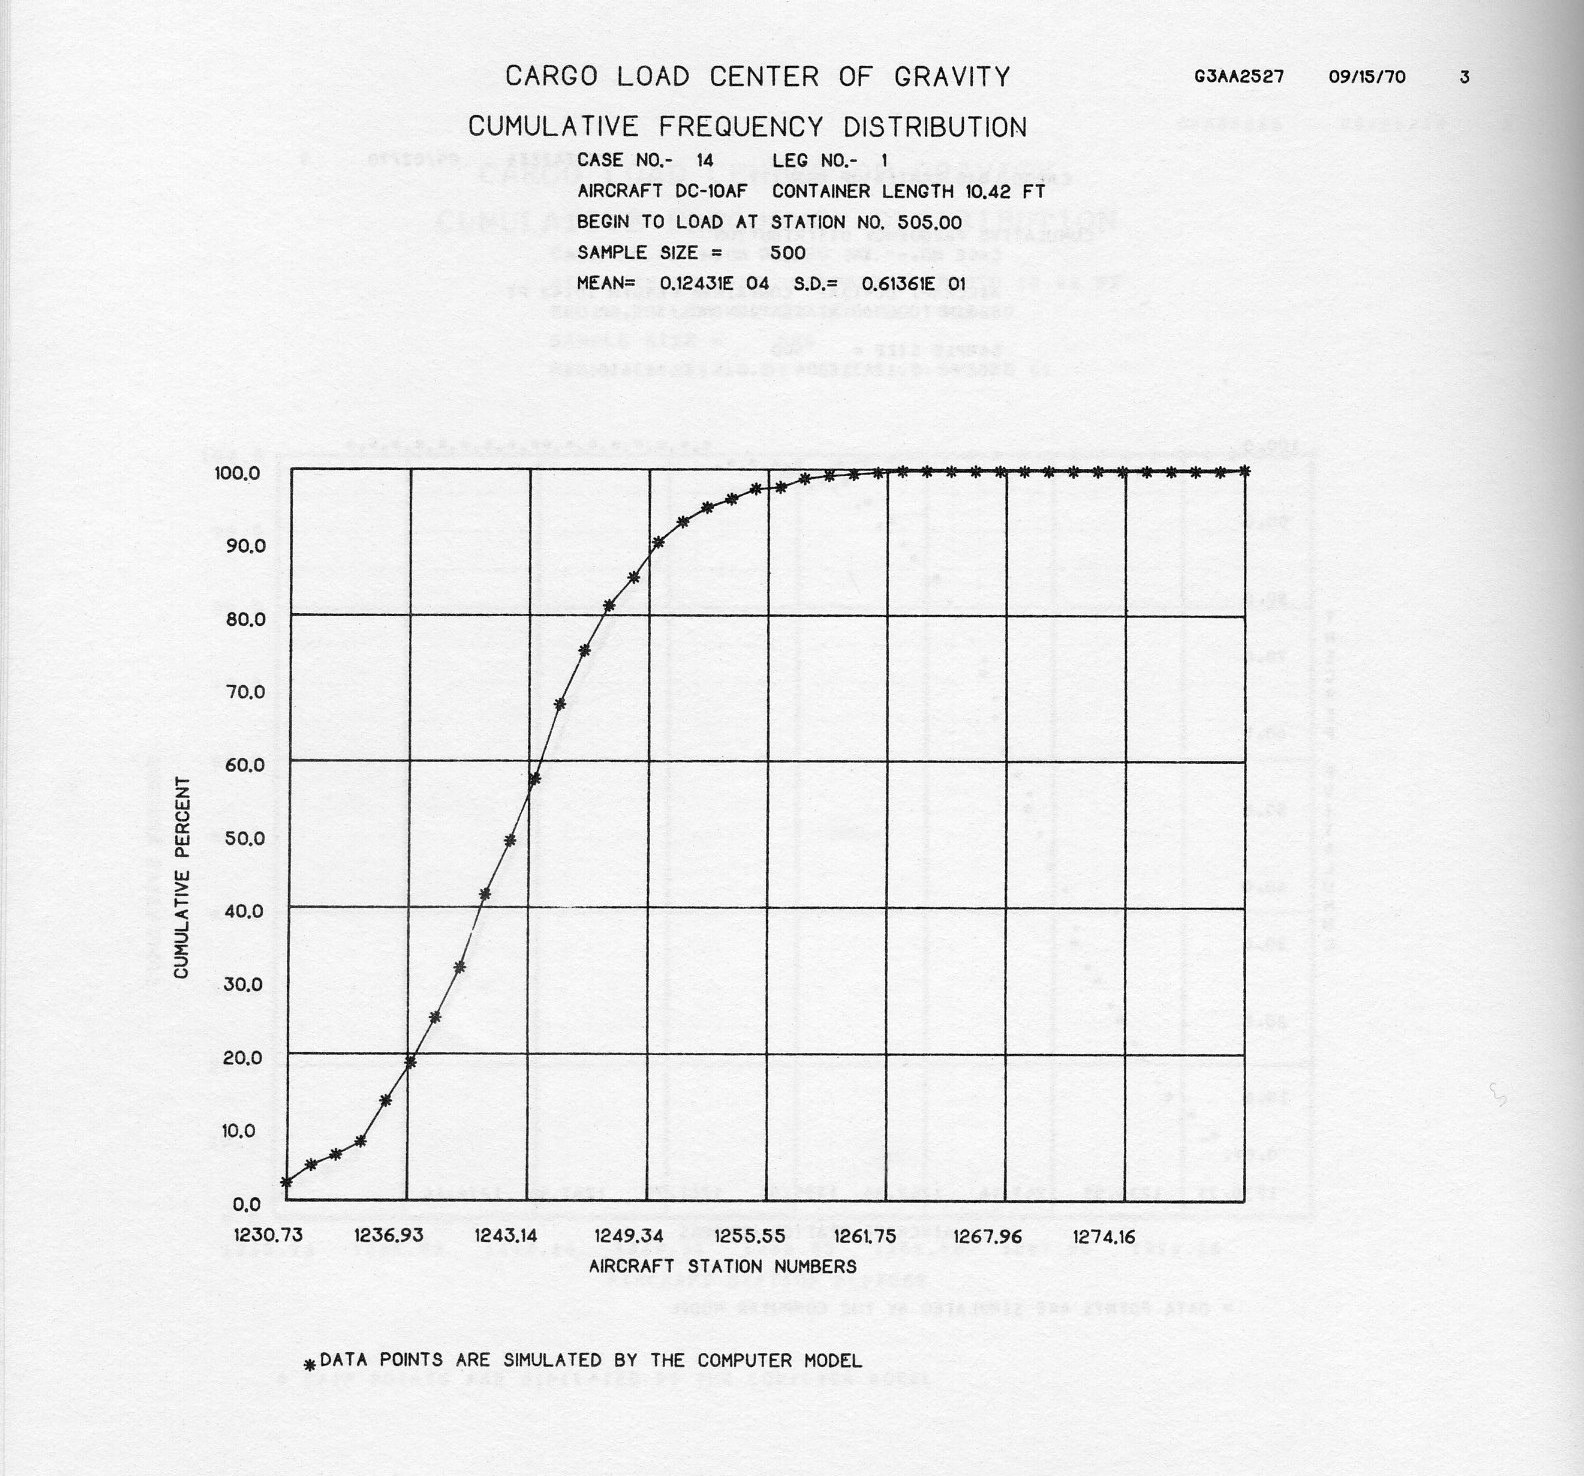
Participants: George Fleming - NASA Goddard, Ed Edwards - Battelle Memorial Institute, Homer Peterson - Lincoln Laboratory, MIT, Jim Splear - GM Research
The uniqueness of Ed's installation comes from using internal personnel to maintain the 4060. The CE is part of Battelle staff and received his initial training from DatagraphiX as part of the installation agreement. He has other hardware maintenance duties but spends a good deal of time with the 4060. It was estimated that he has to make minor adjustment several times a day but total up time for the 4060 is 95% based on a 8 hour day, five days a week, under a load of about 1200 frames per day. The ^060 uses online film processing and online dry toner hard copy unit.
George's installation because of size and volume has its 4060 located in a room consisting of several different types of plotting equipment. The operators for this area are trained specifically for the handling of plotting equipment. Many government groups use this facility for 4060 output and therefore a large variety of applications are processed and a high volume of frames are generated. NASA is very satisfied with this form of operation.
Homer's installation rotates their operators to various positions in the computer on a 2 hour schedule. This position consists of console operator, printer and tape control, 4060 operator, and others. The host system is of the time-sharing variety and requires approximately the same amount of operational expertise at each post manned. Training for the 3050 operation was estimated at approximately 3 hours of formal training.
The 4060 installation at GMR is on-line to a 360/65 computer and cannot be used off-line. The intent was to have the 4060 function in a similar manner to that of a standard impact printer. The operator should control all of the operation from the 360 console. This goal was not achieved because of the sensitivity of the 4060 dry toner hardcopy unit. However, GMR now has a prototype of the liquid toner hardcopy unit - the 1st 90 days indicate that with this unit the ultimate goal will be realized.
AUTOTYPE is a DatagraphiX software system for the 4060 which provides a high speed typesetting capability. It is especially useful for documents that have repetitive formats and are periodically updated, such as directories, catalogs, manuals and parts lists. Input is on any 7 or 9 track, odd or even parity magnetic tape and may be BCD, EBCDIC or any other character code in any format. Any blocked or unblocked format (card image, line printer, free text, etc.) can be handled. The input format and text fields are recognized and handled by the Autotype Control Language (ACL). The ACL also determines which text characters are to be printed, where they will be printed and which font will be used. Output is on the 4060 microfilm recorder on either 16 mm or 35 mm film.
AUTOTYPE is a software system which provides AUTOmatic TYPEsetting and high speed page composition for large volume text material. It. is particularly useful for documents normally stored on magnetic tape and periodically updated.
While repetitive formats such as directories, parts and price lists are most easily handled, AUTOTYPE can handle any unambiguous input format. Free text in sentence and paragraph format only requires some system of identification to be recognized by AUTOTYPE.
The AUTOTYPE system is designed for use on the 4060 Stored Program Recording System. The basic 4060 configuration is required, including the Product Control Unit (PCU) with 8K core memory, and ASR-33 teletype, and the 4060 print head. Any camera (16 mm or 35 mm) and lens combination may be used to record on the microfilm.
All software provided with the AUTOTYPE system is compatible with the SCRIP utility programs. The standard SCRIP library magnetic tape format is used and the two systems may be combined on the same library tape if desired. In addition, operation and procedures have been made similar to the SCRIP Master Control System (MCS) where possible.
All of the AUTOTYPE modules are provided on magnetic tape. These include PAS1 (for initialization and composition), PAS2 (printing and generation of film), PACK and POOF (utilities for vector font generation and proofing). A proportional spacing table for normal size CHARACTRON characters is provided. It may be scaled to be used with the other sizes of CHARACTRON characters.
Presently, two magnetic tape units are required and they may be of any combination of 7 and 9 track, IBM 2400 series compatible units. In selecting the units, several considerations should be made. One unit must have a write capability for use by PACK when vector fonts are generated and also for use during the generation of the intermediate tape during PAS1 - the other unit must be able to read the input data tapes.
The input tape may be 7 or 9 track, odd or even parity, blocked or unblocked and in any character code. Data fields may be fixed relative to the start of each data record or have control codes and variable length fields. The AUTOTYPE Command Language (ACL) is used to define the input format, the fonts to be used, and the position of the text on the output page.
The AUTOTYPE Command Language is a user oriented language consisting of two letter mnemonics. Each mnemonic describes a command (action) to be taken i.e., PG PaGe eject, SS SubScript), and may have one or more modifiers associated with it. These modifiers define additional information for use by the command such as start and stop coordinates- for a line (vector) or the capitalization mode (A = all, N = none, X = next, etc.) to be used.
The command language consists of five groups of commands. They are : Control (branching, recursion in the ACL), Text (code conversion, field definition), Position (reference, justification), Font (size, style) and Miscellaneous (Form Plash, Page Eject, etc.).
Command Variables are selected modes and software switches which may be changed, set and used through the ACL. They may be used as modifiers to commands in many cases.
The AUTOTYPE Command Language is composed of macros, sequence functions, conditional functions, commands and modifiers (parameters). While each command will only allow certain combinations of modifiers, the macros and functions may be formed in any manner (restricted only by the logic of execution) that will give the desired output.
Modifiers can take several forms, depending on the needs of the command. Numeric values are number (decimal, octal or hexadecimal) included in the ACL stream. Any positive value less than 32,767 may be used.
Command Variables are identified by two letter mnemonics and contain either user specified values or information about the current status of the job. When a command variable is used, the proper location in core is accessed to get the current value of the variable. In many cases, command variables and numbers may be used interchangeably.
Character modifiers i.e, F and H in the JUstify command) are single character entries that generally are used to set modes. In some cases the specify which part of a command the following modifiers will affect (i.e., X and Y in the SCale command).
Text literals are used in the LAbel and MeSsage commands. These literals are character strings enclosed by semiquotes. The string of characters will be typed on the ASR in the case of a message, or will be added to the text stream as defined by the particular command.
Conditional functions are a part of the EQual, Not Equal, Greater Than, and Less Than commands. The functions are enclosed by a matched pair of parentheses and may be nested to any level. As defined by the commands, if the condition is satisfied, the next command in line (within the left parenthesis) will be executed. Following commands within the function will be executed normally. If the condition is NOT satisfied, the command following the closure of the function will be the next command executed. A conditional function may be placed anywhere in the ACL.
Sequence functions are executed when an input data condition is satisfied. They can be used to specify an action dependent on the beginning or end of any file, block within a file or record within a block. They may be nested and may be placed anywhere in the ACL. A sequence function, when it is encountered in the ACL stream (during execution), is saved in a table for later execution The function is not executed at that time.
If a sequence function is allowed to run to its logical end, the ACL command stream is continued on the command following the one in which the interruption occurred.
Macros are similar to functions in that they are enclosed by a matched set of parentheses, but they are preceded by a Define Macro command and the number of the macro. A macro may only be started at its beginning and only with an Execute Macro command or an Equated Code. A macro may be continued, however, following the completion of a sequence function or the logical completion of another executed macro. Macros may be chained, nested or recursive. They are NOT re-entrant. When a macro is executed, the current position in the ACL is saved and the previous entry to the macro is lost. When a macro reaches its logical end, execution of the ACL will continue at the saved position.
Any input character code may be used. AUTOTYPE internally uses 7 bit ASCII character codes and the capability is provided to permit entry of any translation table. Tables are provided to allow the user to specify and modify the standard BCDIC or EBCDIC character codes. Special handling of control characters or dynamic character translation may be implemented using the Equate Code and character COde conversion commands.
Text characters may be of any character code and may be upper and lower case. It is possible to force any alphabetic case at any time through the use of the ACL.
The recognition of input data is by characters, however, and it is possible to perform functions independently of the character stream at the beginning or end of any logical record, block or file. It is also possible to skip or backspace over characters, blocks or files. EOF and EOT marks are not handled in any special manner. A message is printed, however, when the EOT reflective marker is sensed.
The recognition of data fields is controlled by the ACL. Data fields may be fixed relative to the start of each record or may be of variable length and flagged by special or control characters. Since the text is recognized by characters, no special handling is required to differentiate between blocked or unblocked data tapes.
AUTOTYPE positioning commands determine the coordinate positions for all text characters The Horizontal and Vertical Reference commands are used to offset all coordinates used in the ACL. If four identical columns of text are to be printed on a page, a macro could be written to handle the first column and then the horizontal reference used to offset the coordinates for the other three columns.
The line and character spacing is set by the Line Spacing and Character Spacing commands. The line spacing is the distance between the base lines for the lines of text. The base line is the line on which upper case characters rest. Character spacing is either proportional (taken from a font spacing table) or block specified in the ACL). The character spacing defines the width of the envelope for the character and it can be scaled to provide proportionally greater or less distance between the characters.
Horizontal positioning is basically dependent on tab settings. The Set Horizontal tab command allows the user to set a maximum of 16 tab coordinates. The Move to Horizontal tab command defines an area into which subsequent test will be set the left edge may be indented by use of the SPace command Flush and justification is handled internally depending on the justification mode set in the ACL. In Flush mode, the character spacing (as defined when the character was read) is used. In Justify mode, the area available between the current tab and the next tab is exactly filled with the characters. The width of the envelope for each character is squeezed or expanded as necessary. In Hyphenless justification, the width of all the characters being set is accumulated and checked against the available area between the current and next tabs. When the available area is filled, AUTOTYPE looks for the next blank while checking to insure that the minimum allowable space for all the characters does not overflow. If a blank is found, the blank is deleted and the line is set to exactly fill the distance between the two tabs. If an overflow condition is reached, the text up to the last previous blank is printed and that blank is deleted. The remaining characters are saved to add to the following line.
Set Line mode allows the user to combine input text, labels, text literals, etc. in any combination on one justified line, specifically requested in the ACL.
Vertical positioning is dependent in vertical tab settings and line spacing. A move to any of the 16 vertical tab settings causes the base line to be set to that coordinate. Characters may be offset from the base line by the Superscript and Subscript commands. The Move Up and Move Down commands cause the base line coordinate to be changed by the line spacing. Any vertical move command resets any superscript or subscript offset.
The recognition, translation and printing of input data is controlled by text commands. These commands can be used to specify the input text positioning and any special character translations, and to save portions of the input text to printed later. Special control codes or flags may be recognized using the Equate Code command. Instead of causing a character translation, this command generates an Execute Macro command each time an equated code is found. Equated codes may be initialized or disabled at any time.
Blanks and leading zeros (in data fields) may be suppressed. When blanks are suppressed, only the first blank of a string will be set. All succeeding blanks will be ignored until a non-blank character is found. When leading zeros are suppressed, all zeros are suppressed until a non-zero, non-blank character is found. To save portions of the input text for later printing, any of four Defined Literal areas may be used for storage. Any of the defined literals may be cleared, added to or printed at any time.
Characters embedded in the ACL may be added to the text stream at any time using the LAbel command. The Print Page number command causes the page number (a command variable) to be printed at the current position with leading zeros suppressed.
Both the type of character to be used and the appearance of the characters, is determined by the current font being used While CHARACTRON characters can only be changed in size and intensity, vector characters may also be compressed, extended and italicized. Vector characters are formed by drawing short, parallel, vertical lines from bottom to the top of the character. Characters can be scaled vertically by changing the length and starting position of the lines that construct the character. An italicized character has the lines angularly shifted clockwise about 15 degrees. Scaling and italicizing is done relative to the base line. When the time required for generating print head commands is included, CHARACTRON characters have a throughput about five times as fast as vector characters.
To summarize, AUTOTYPE simplifies the problem of generating reports from computer generated and updated data in the following ways:
Several examples of actual AUTOTYPE output are attached to demonstrate some of its capability.
That is AUTOTYPE.
NOTE This entire paper was set using AUTOTYPE: The original cards were punched on an 026 IBM card punch using the standard BCD card codes The SCRIP utility CTT2 was used to create a card-image tape that was used as the source for the typesetting. The film used was 35 mm (perforated) and was processed on the DatagraphiX 156 film processor. The image on microfilm was photographically enlarged onto a negative and the reproducing plate made from the negative.
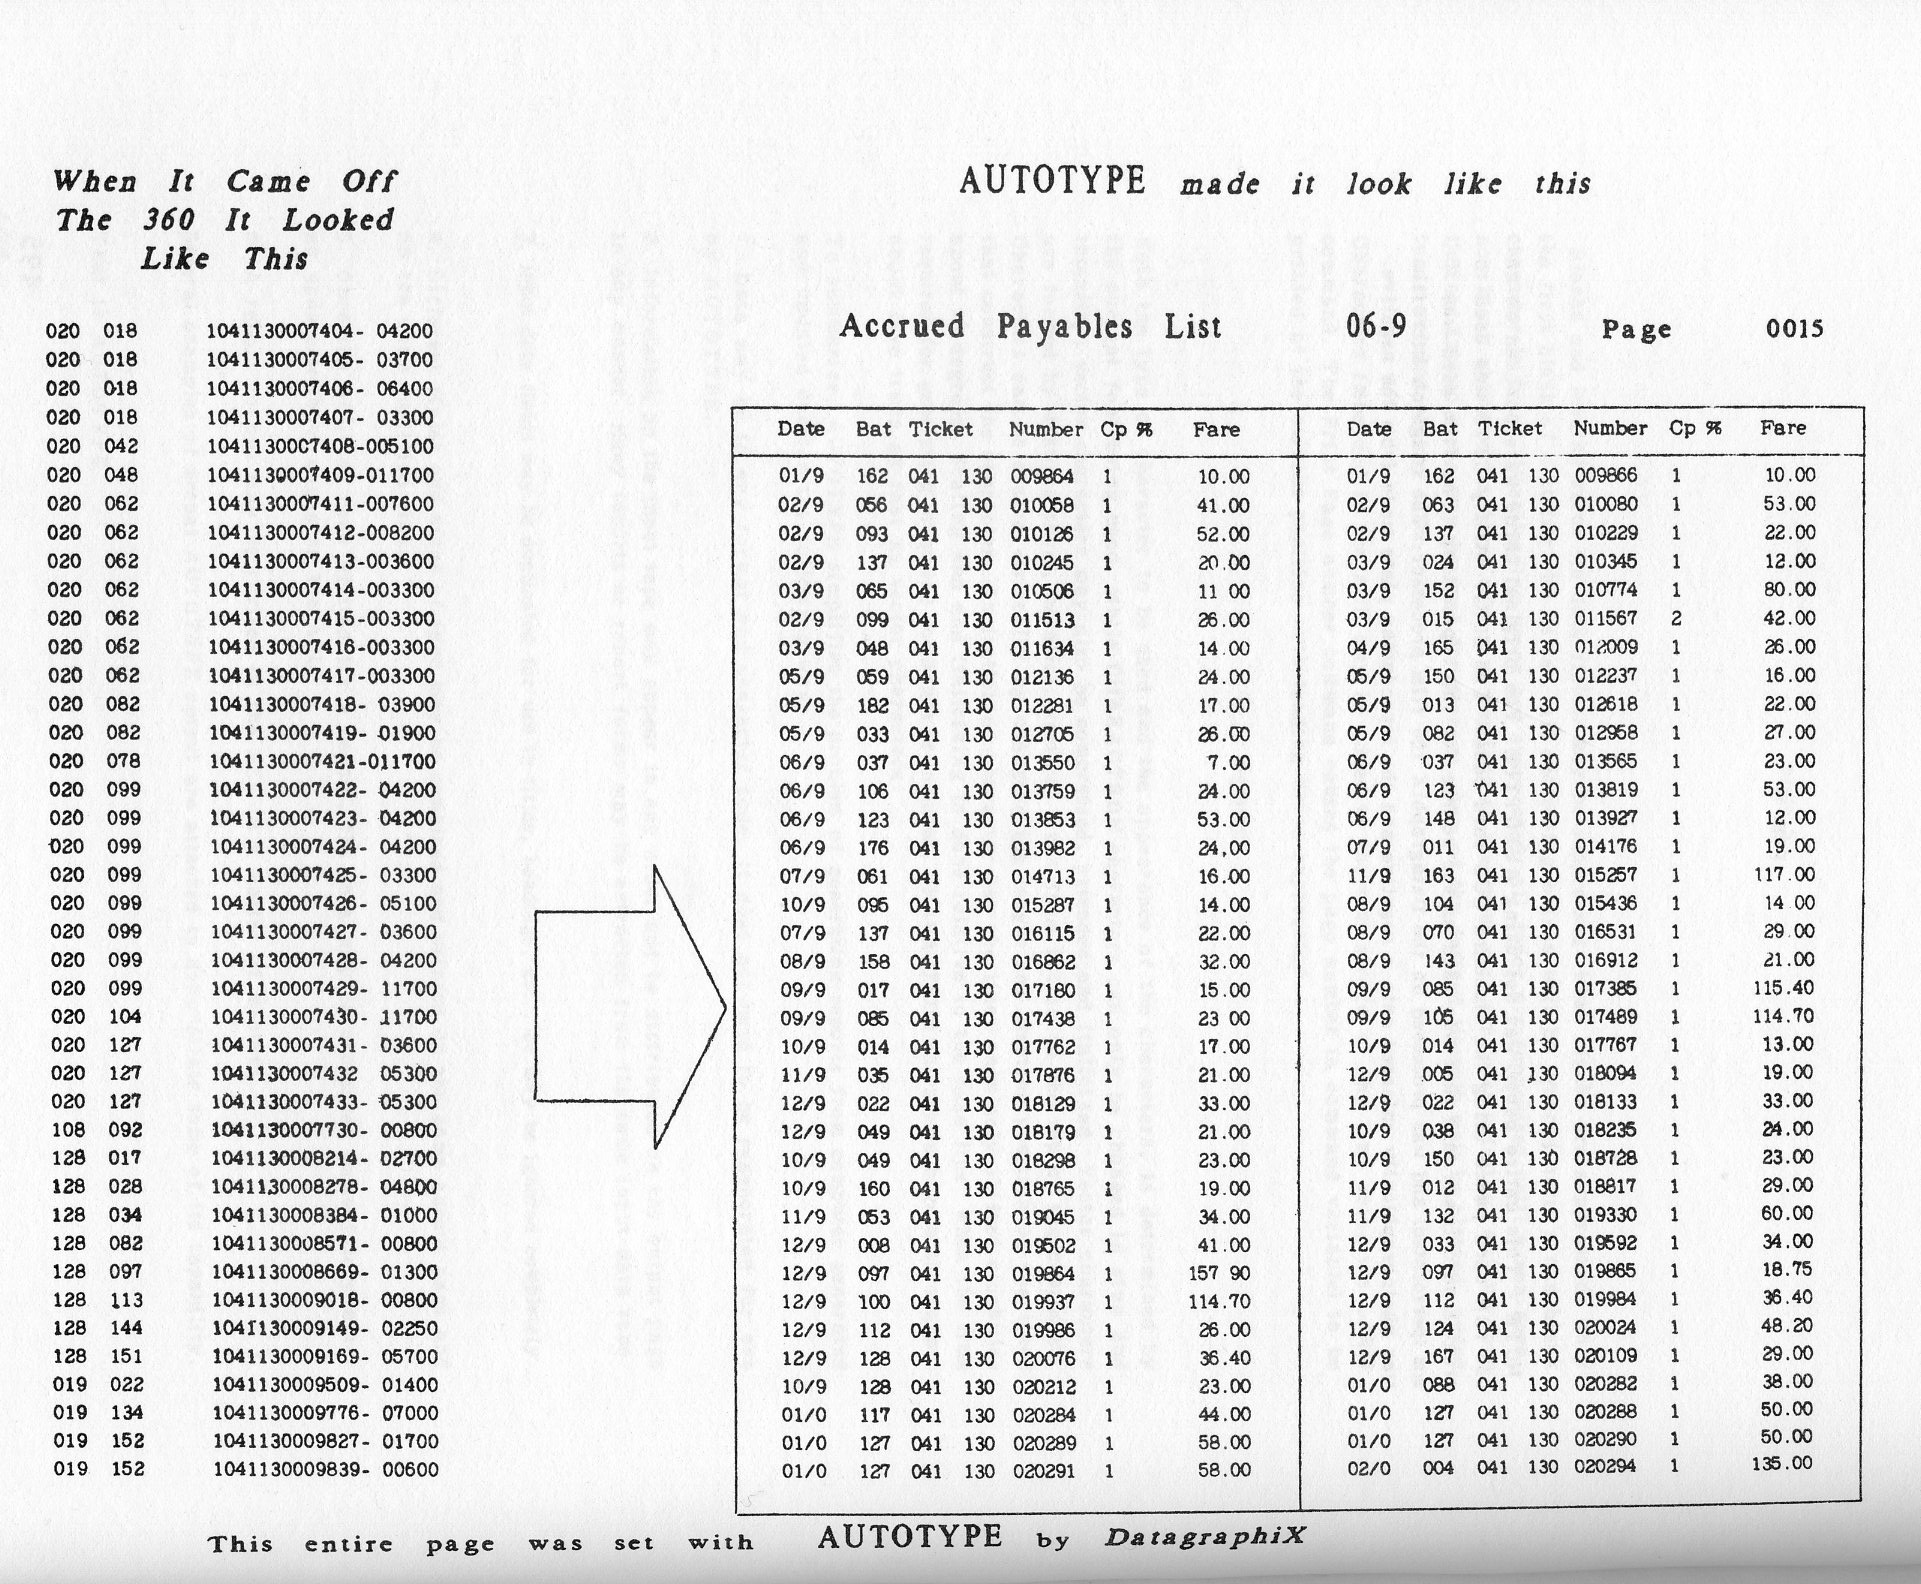
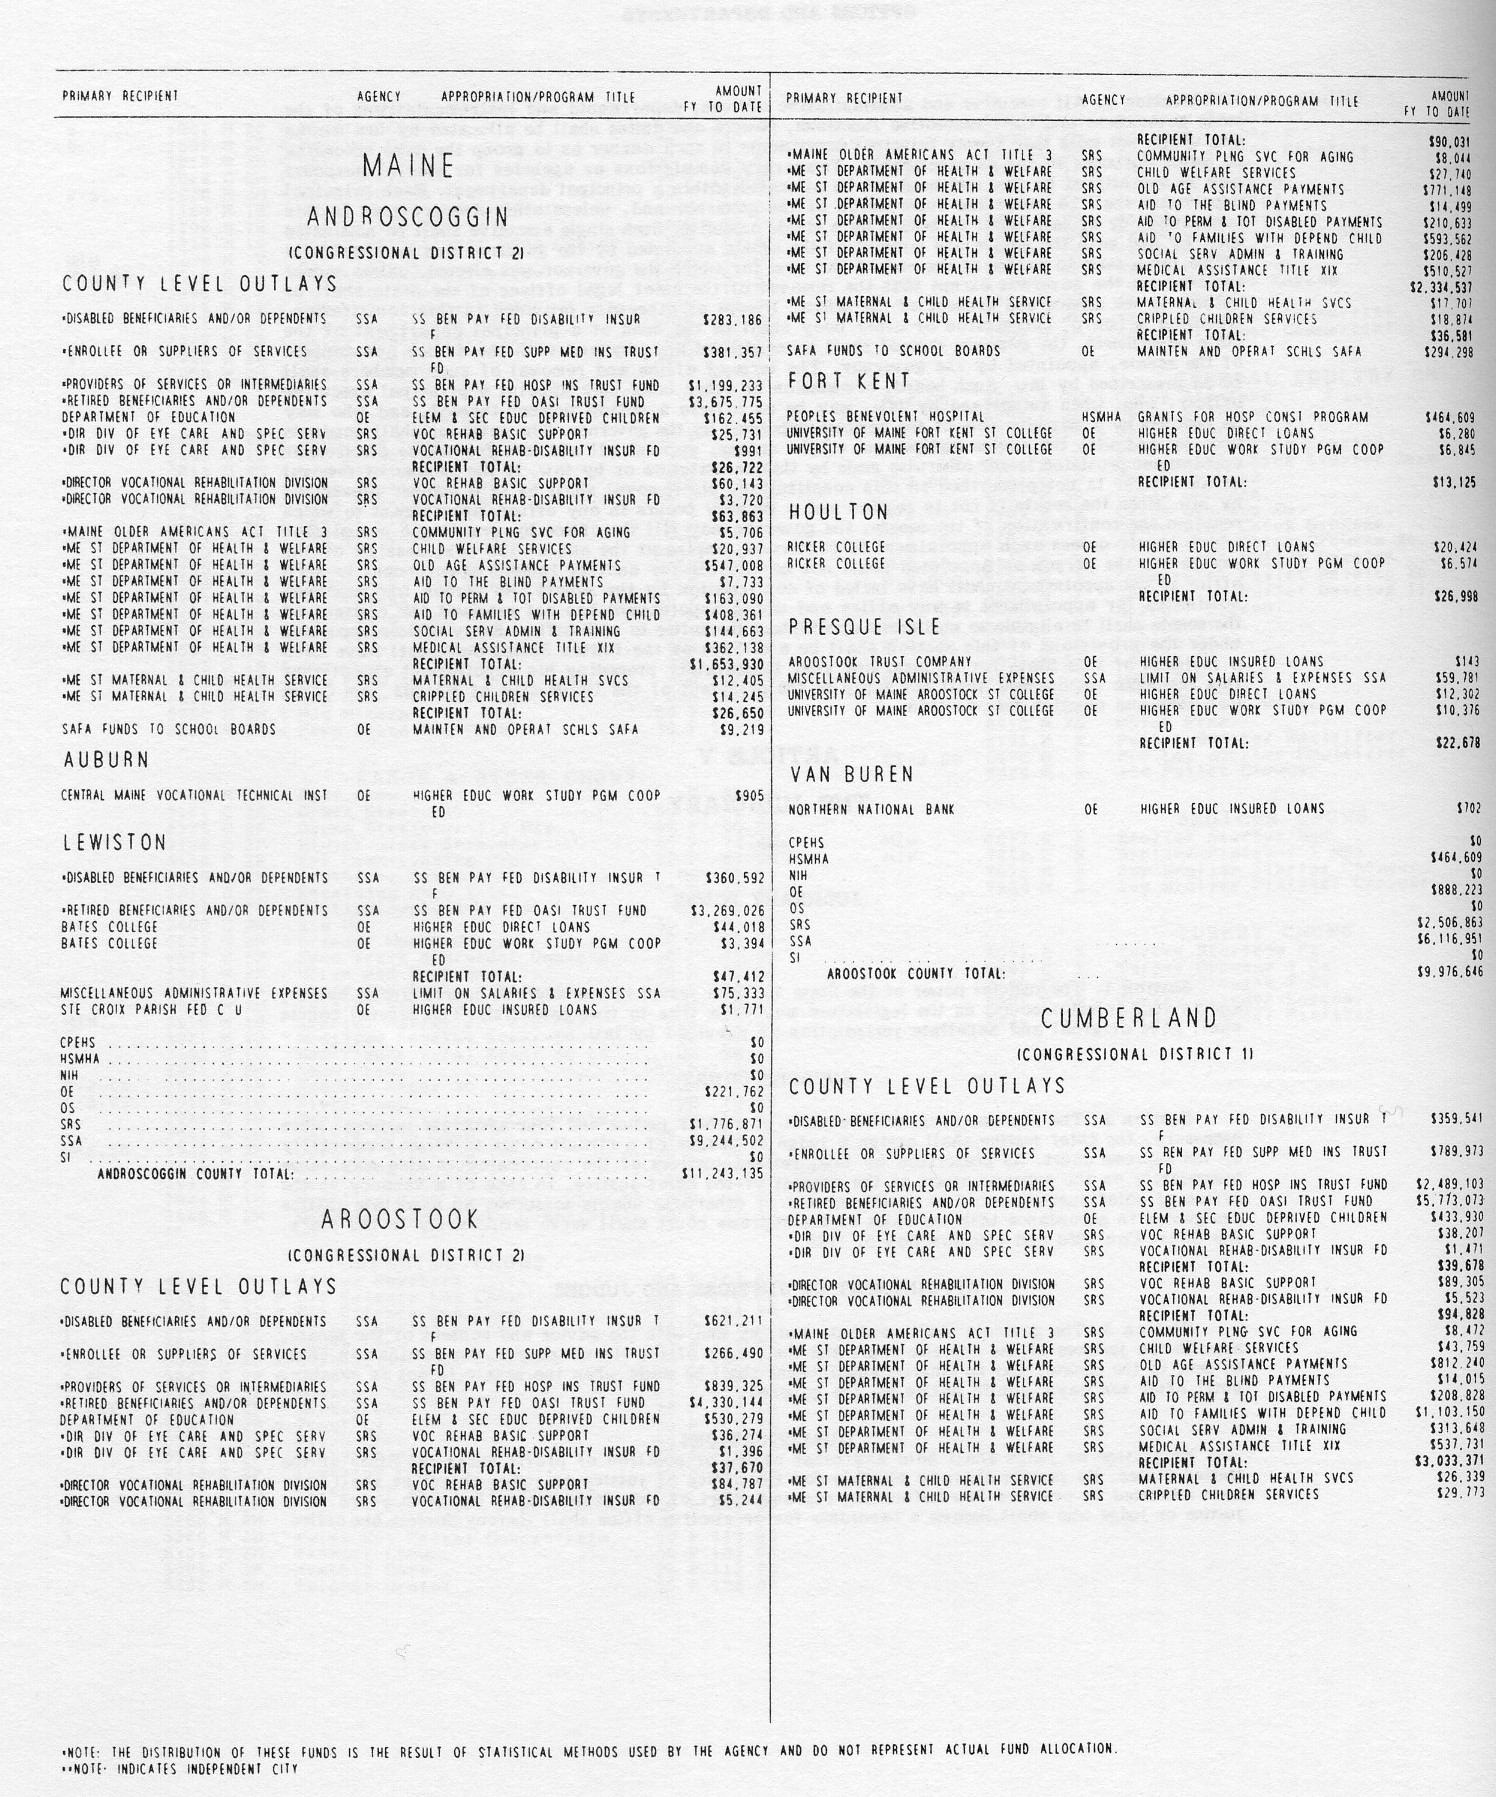
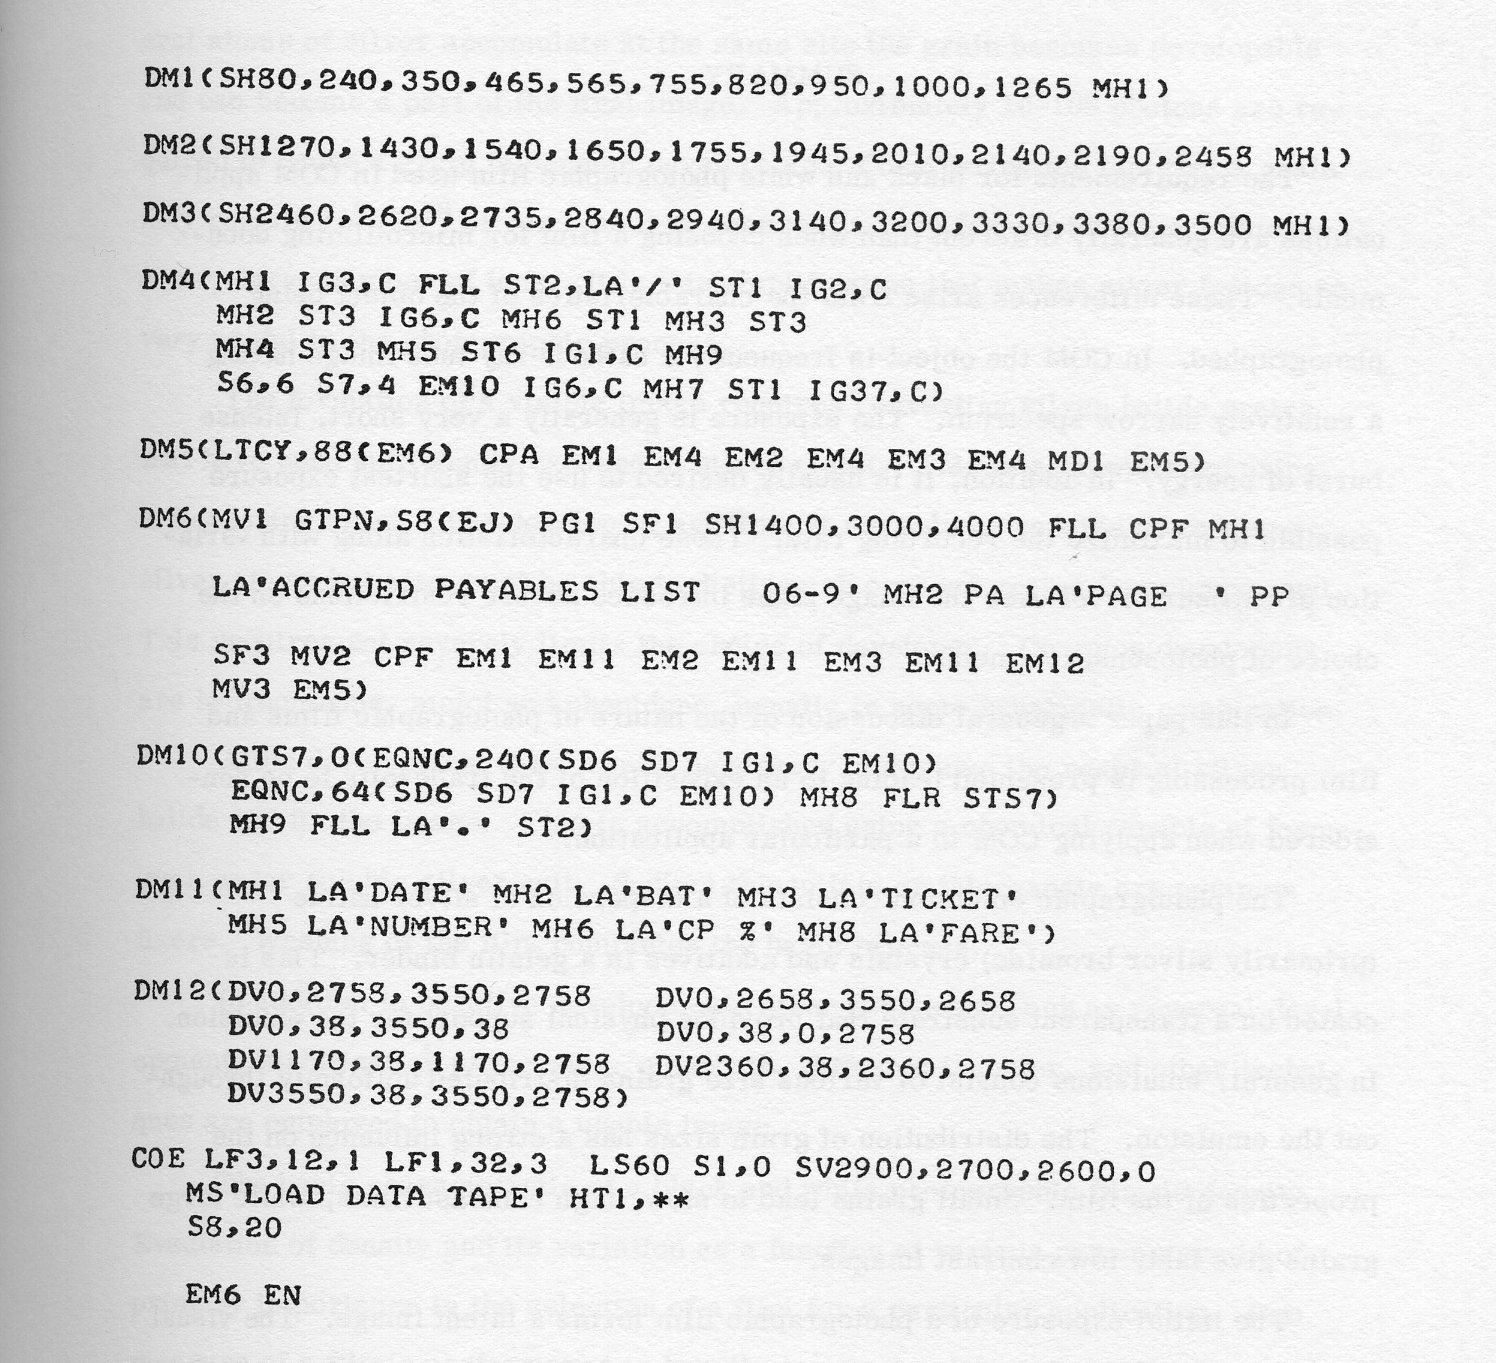
The requirements for black and white photographic film used in COM applications are generally different than when choosing a film for microfilming documents. (A more complete treatment of this subject will be published at a later date.) These differences arise from the characteristics of the object being photographed. In COM the object is frequently a cathode ray tube image having a relatively narrow spectrum. The exposure is generally a very short, intense burst of energy. In addition, it is usually desired to use the shortest exposure possible to maximize the recording rate. These characteristics along with variation of exposure level over the image plane introduce severe restrictions on the choice of photosensitive media.
In this paper a general discussion of the nature of photographic films and film processing is presented leading to an exposition of the trade-offs to be considered when applying COM to a particular application.
The photographic emulsion consists of a dispersion of silver halide (primarily silver bromide) crystals and additives in a gelatin binder. This is coated on a transparent substrate that provides physical support for the emulsion. In general, emulsions consist of various size grains distributed uniformly throughout the emulsion. The distribution of grain sizes has a strong influence on the properties of the film. Small grains lead to slow, high contrast films, while large grains give fast, low contrast images.
The initial exposure of a photographic film forms a latent image. The visual appearance of this latent image is the same as that of unexposed film. Processing of the film is necessary to achieve a visible image. The initial exposure causes the formation of free silver at the surface of the grains of silver halide. If several atoms of silver accumulate at the same site the grain becomes developable and can become a part of the final image. Approximately 10-100 photons are required to cause a grain to become developable. Considering the fact that a grain may contain 108-1010 silver ions it is seen that a very few photons can influence a very large number of ions. It is this amplification that makes silver halides so very useful in the photographic process.
The formation of a visible image requires converting silver halide grains that have been sufficiently exposed to silver metal. This is accomplished using a developing agent. The developing agent must not only be capable of reducing silver atoms but also must be able to distinguish exposed grains from unexposed. This requirement severely limits the choice of developer. Common developers are hydroquinone, metol and phenidone, usually in some synergistic combination.
After development it is usually necessary to remove the residual silver halide and fix the image. This is accomplished using a chemical capable of forming a water soluble silver salt. Sodium thiosulfate or thiocyanate are common fixers. Washing of the film completes the basic process.
In addition to negative development, other processes such as reversal development, stabilization processing, monobath, diffusion transfer, and other techniques are employed to obtain a usable image.
The basic characteristic of a black and white photographic film is density. Emulation of density and its variation as a function of various parameters is of primary importance in the selection of a film for a particular application. One measure of a film's performance is how the image density varies with exposure. A plot of density versus the logarithm of the exposure gives a sigmoid curve. The detailed properties of this curve are all important in choosing a photographic film for a particular application.
The shape of the characteristic curve (commonly called the D-Log E or H & D curve) is dependent upon the emulsion properties, exposure, and processing conditions. Each of these factors must be known before detailed data can be obtained.
The manner in which the image density varies with exposure is only one of the factors which must be considered when choosing a film. Data regarding the resolution, or more important the modulation transfer function of the film, is of great importance as this is directly related to the information capacity of the film. The graininess or granularity of the film is of great significance as this is a representation of the noisiness of the film.
In addition to the sensitometric properties, other physical attributes such as scratch and break resistance, color, anti-static properties, curl, stretch resistance, etc., are important in choosing a film. In general, it is found that compromises or trade-offs are necessary when choosing a film and weighting of the various factors is completely dependent upon the particular application.
Color computer animation under program control has been made possible by modification of a SC 4020 Microfilm Recorder. Rotary solenoids are used to position filters in the light path between the CRT and the camera. Selection of filters and film processing methods have eliminated the need to overstrike.
This work was performed under the auspices of the United States Atomic Energy Commission.
The introduction of programmer-controlled color digigraphic output at the Los Alamos Scientific Laboratory has given the computer programmer an added dimension in program output. The digigraphic microfilm recorder has been used very successfully as a data reduction device for the presentation of large amounts of numerical data, such as in numerical fluid dynamics calculations, in an easy to understand form. One problem that has always faced the programmer using visual display, is how to differentiate sets of data that are to appear on the same frame. Various ways to do this have been devised, such as striking with different characters, overstriking the same point several times, shade of gray, and registration printing of separation negatives on color film using appropriate filters. Each of these require in varying degrees added programmer and/or processing time. With the addition of programmer controlled color, the separation of data on the same frame becomes a simple matter for the programmer. A call to a color subroutine allows him to choose any color at random.
Several other factors have also been changed by the use of color. It is now possible to put a higher density of information on the same frame, and the aesthetics of computer animated movies has been increased when compared to the stark high contrast of black and white output.
In planning for the addition of color to the Los Alamos digigraphic microfilm recording facility, certain limitations had to be considered. Foremost is that the facility is used to capacity, 24 hours a day, as a data reduction and output device for the many programs now in use at Los Alamos. This meant that the addition of color could not add significantly to either the downtime of the machine for changeover to-or-from color mode, nor increase the processing time for normal data processing of existing programs. It was also decided that the system must, to a reasonable extent, be operator proof and that no special training of machine operators would be necessary.
Color by separation negatives was eliminated as a possibility because of the large expenditure of programmer time required as well as processing tine both on the computer and in the film processing laboratory.
The system developed at Los Alamos is based on a method originated at the Sandia Laboratories. The Sandia system consisted of a color filter wheel, driven by a stepping motor, being positioned in the light path between the CRT and the camera. Red, green, blue, and clear filters were used and associated electronics was developed to position the wheel under program control. It also required replacing the CRT with a tube having a new phosphor mix since the original tube did not produce sufficient red. Because of the sharp cutoff characteristics of the filter, reduced intensity of the CRT tube, and limited speed of the film it was not possible to obtain adequate exposure except by overstriking, that is, displaying the same data several times. The average number of overstrikes required was seven, greatly increasing the amount of computer time required to generate a frame. Processing time also increased because moving the filter 90° required 200 msec and because the motor was unidirectional, 600 msec were required to select a filter 270° away. This required careful planning on the part of the programmer in ordering data to avoid excessive color wheel motion.
The system developed at Los Alamos uses the same CRT tube developed at Sandia. In place of the color wheel, three separate rotary solenoids are used to position the filters in the light path between the CRT and the camera. Control logic is designed so that the selection of a filter automatically releases any other filter. Thus, during the time one filter is being positioned the previously selected filter is withdrawn from the light path. Delay times were also built into the circuitry to allow for solenoid relaxation time and filter arm oscillation time. The total time required to change filters is 30 msec as compared to 200 msec using the color wheel. It is also possible to randomly select colors under programmer control and ordering of data is not necessary. A switch was also added to the control panel to permit the by-passing of the color logic. In the normal position the color logic is disabled, causing color commands to be treated as NOPs thus allowing black and white checkout runs to be made without removing color commands from the program.
The necessity for overstriking was eliminated by changing the lens opening on the camera to f3.5 instead of f5.6, changing the filters to ones with higher transmitivity (Kodak Wratten Filters 25 red, 57 green, 47 blue), and using a two-step forced processing in the developing of the exposed film. Several things could be changed to eliminate the need for two-step forced processing. First would be to use a higher quality lens in the camera, second the removal of the pellicle assembly, and third the use of broader bandwidth filters. The most straightforward of these is the removal of the pellicle assembly, but since it is used for alignment of the CRT and also protects the CRT during the times the operator is changing the film or camera, it is not a practical solution.
As can be seen in Figure 1 there is room available to add additional filters to this system to get a larger color selection without any increase in processing time.
1. F. G. Berry, D. C. Buckner, R. C. Crook, and D. 0. Dickman, Color Film Output from Computer Runs, Los Alamos Scientific Laboratory Report LA-4278-MS (1970).
2. C. J. Fisk, Cathode Ray Tube Color Plotting, Sandia Laboratories Report SC-RR-68-546 (1969).
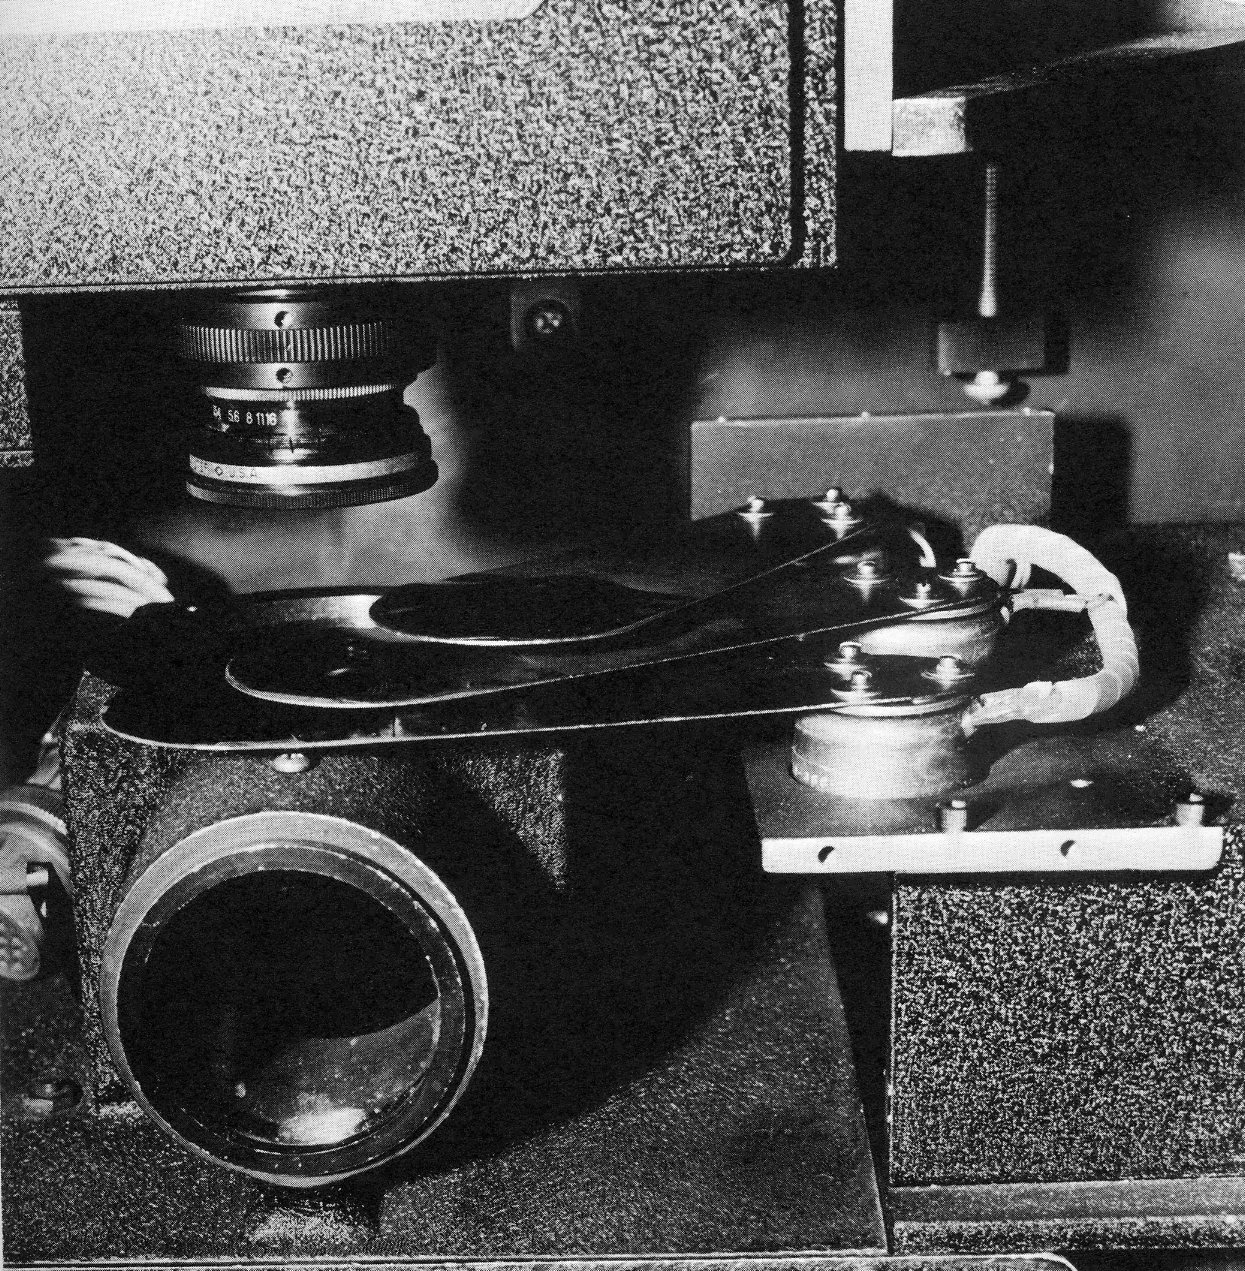
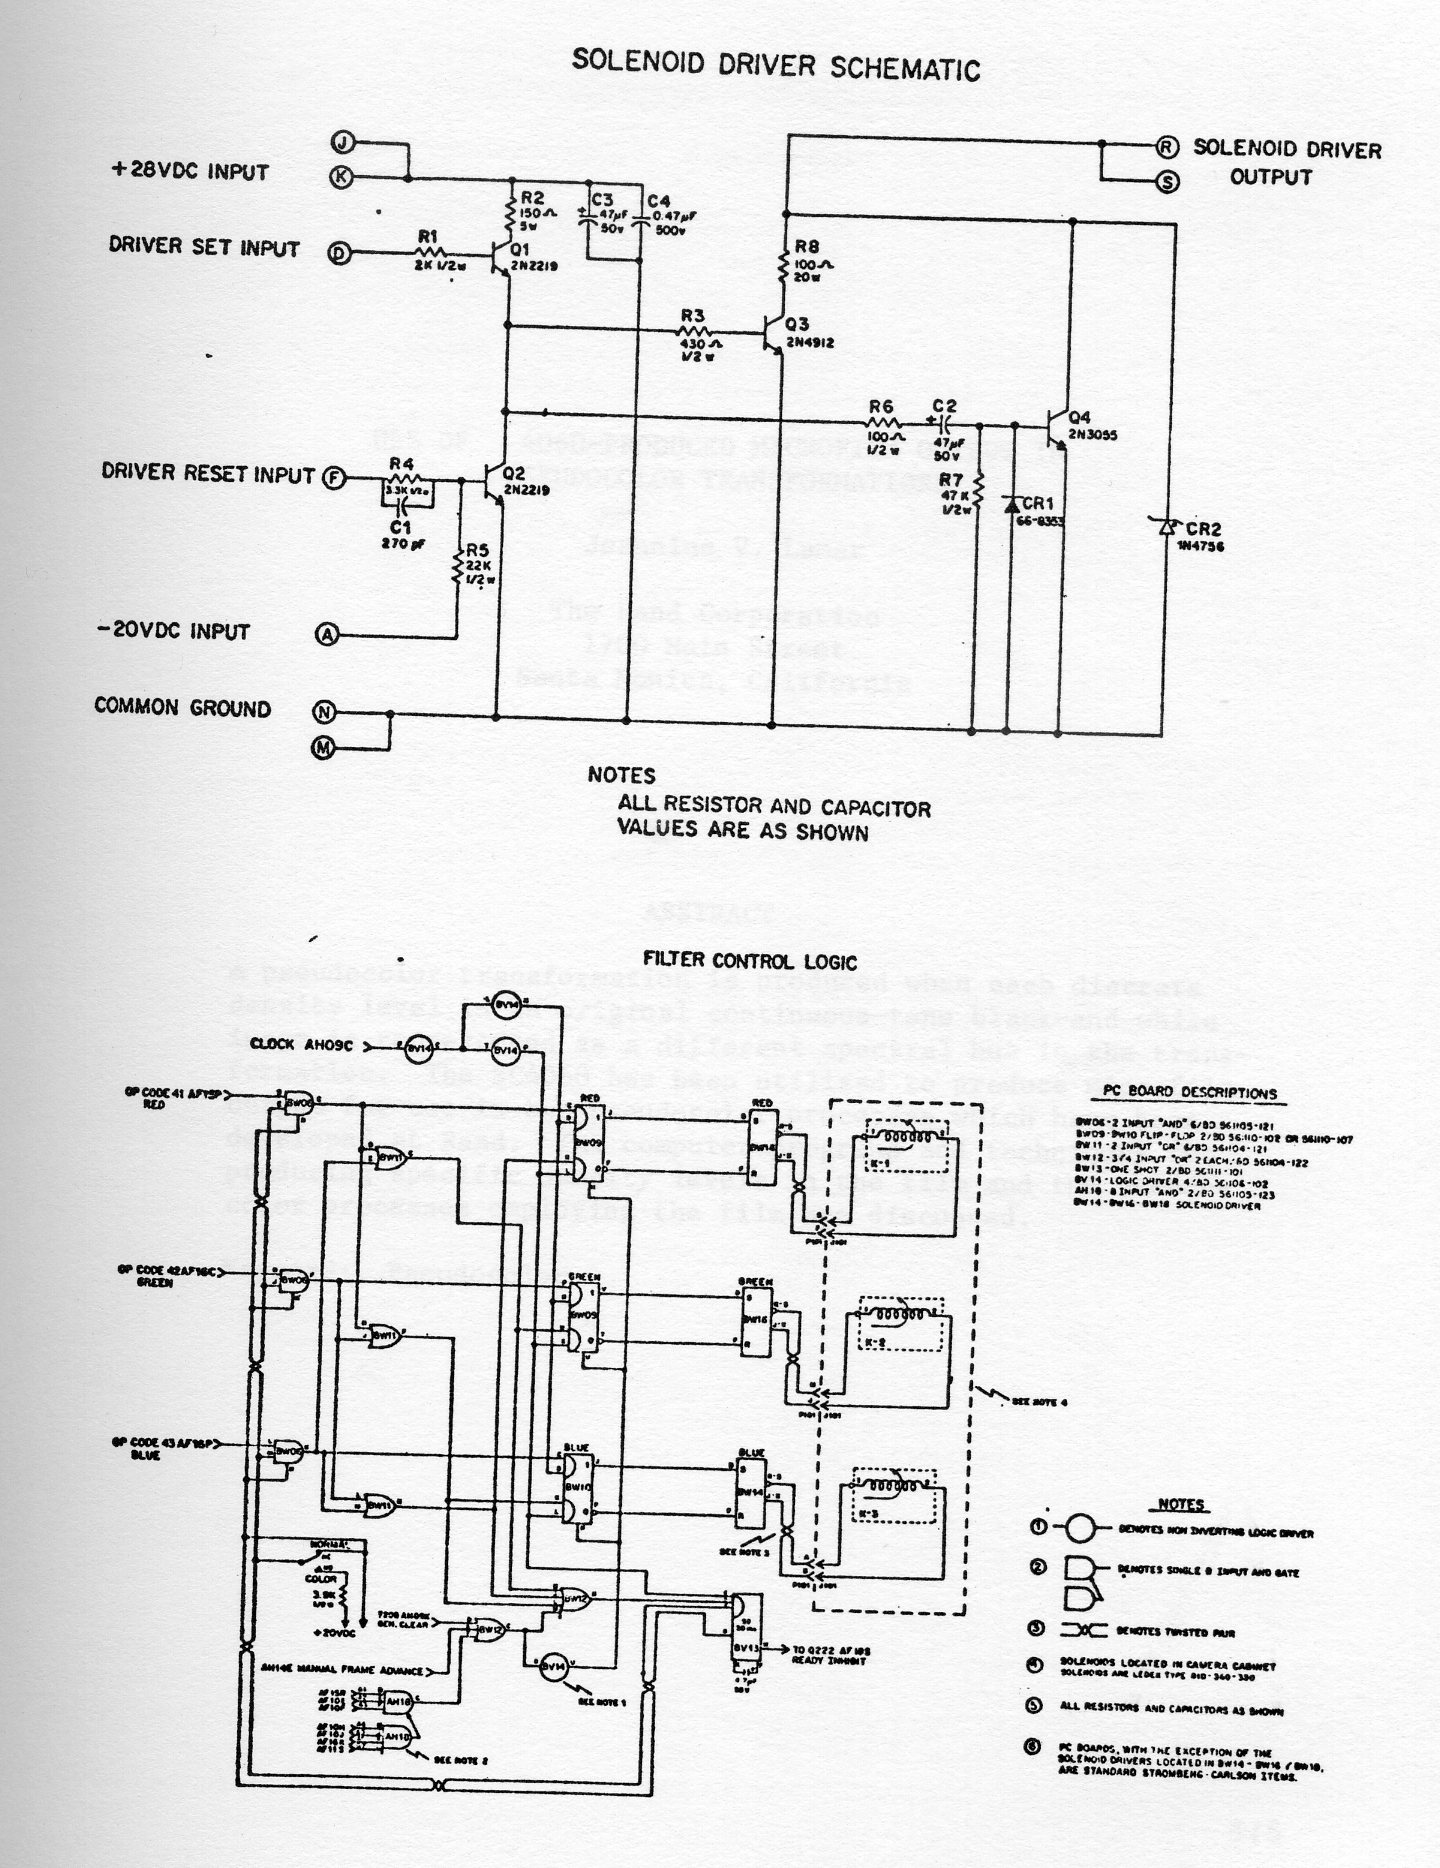
A pseudocolor transformation is produced when each discrete denisty level in an original continuous tone black-and-white image is represented as a different spectral hue in the transformation. The SC4060 has been utilized to produce microfilm output for use in two pseudocolor processes which have been developed at RAND. The computer programs and techniques for producing specific density levels in the film and the pseudocolor processes employing the film are discussed.
The human eye can distinguish only about 15 or 20 shades of gray in a complex black-and-white image. If the image is in color, far more distinctions can be made. Thus the representation of black-and-white original material by a chromatic presentation (pseudocolor) permits the eye to more rapidly or accurately interpret the data. This is one of the objectives of Rand's image enhancement research.
In describing pseudocolor transformations, the C.I.E. colorimetry chromaticity diagram will be used. This system was established by the International Commission on Illumination in 1931 for quantifying the human visual sensation of color. The C.I.E. diagram of color regions is shown in Fig. 1. Any color sensation may be defined by chromaticity coordinates x and y. The luminance or brightness sensation falls on a plane perpendicular to the page.
A computer-generated pseudocolor transformation of a black-and-white image is produced by assigning a chromaticity-luminance in the pseudocolor image to correspond to each shade of gray in the original image. Intermediate black-and-white records called pseudocolor separations are produced, either photographically or by computer. These separations are of varying densities and control the amount of light which falls on the color material during the printing process.
The two-separation technique [2] as described in this paper was developed by Roy H. Stratton of The Rand Corporation. It is based on the characteristics of the negative color material used in the photographic process. Photographic color materials contain three dye layers, cyan, magenta, and yellow. In negative color material, an exposure to a blue light source will affect both the blue-sensitive layer (yellow dye formation) and the green-sensitive layer (magenta dye formation). Exposure to a red light source will affect the red-sensitive layer (cyan dye formation) and the green-sensitive layer also. Because of these characteristics, and with the selection of appropriate filters and exposures during the successive printing of the separations, a full spectrum of color can be obtained in the pseudocolor print with only two exposures, rather than three as required by an earlier process. [3] The five steps in the process are as follows:
Computer-generated separations are made by plotting a specified number of dots within a 20 × 20 raster square on the CRT of the SC4060 and recording the picture on 35 mm film. The number of dots plotted within this square determines the density of the separation. The 20 × 20 raster square was chosen as a basic plotting unit because, with the present display format, at a distance of 3 ft a viewer sees the square as one point.
To produce separations containing the correct densities for the color chosen in the final pseudocolor print, the density of each dot pattern has to be known. A series of calibration strips consisting of rectangles with various numbers of dots per plotting area were produced by SAM4, a Datagraphix software package, and read with a densitometer. Using this calibration data and choosing 21 density steps of equal increments, the SC4060 was coded with the dot patterns to yield these 21 densities, and a gray scale was produced. Two identical separations were used as the positive and negative records, and the photographic process described earlier was used to produce a color scale.
The pseudocolor print as shown in Fig. 2 was created as follows: The image was drawn on an SC4060 layout sheet (Fig. 3). The locations of all coordinates where plotting started or stopped and the plotting order were tabulated. Referring to the color scale previously produced, a choice of color for each letter was made. A program was written to instruct the SC4060 to plot the dot pattern which would produce the correct densities, at the proper locations, for the red and blue separations, as shown in Fig. 2. These two separations were then printed, using the two-separation process, and the colored UAIDE was created.
Photographically-produced separations are limited to the gray scale present in the original material; computer-generated separations are more expensive, but they are far more versatile. For example, suppose there are two shades of gray in the original which are similar, but whose differences one wishes to emphasize. A flying spot scan of the original can be made and the SC4060 coded to replot the original with an expanded contrast between the two grays. Using this technique, a high contrast picture can be computer-generated from a low contrast picture. The computer can create images illustrating the variation in quantities with position. As an example, measurements of temperature, pressure, or water content at many locations in a cloud are recorded. The values of the variables are assigned specific densities within the gray scale, so that the range in values corresponds to the range in grays in the pseudocolor separations.
Greater resolution in the separations can be obtained by decreasing the dimension of the basic square; however, the maximum number of steps in the gray scale, or the contrast, will be reduced. We are attempting to determine the maximum number of density steps which can be obtained with the present basic plotting unit. Eventually, we hope to produce pseudocolor separations with the maximum possible resolution and density range and to vary these parameters depending upon the application and its display format.
I wish to thank Jami Simac of the Rand Computation Center for his help and encouragement.
1. Committee on Colorimetry, Optical Society of America, The Science of Color, 1963, p. 4.
2. Stratton, R. H., and C. Gazley, Jr., Pseudocolor Image Enhancement by a Two-separation Photographic Process, The Rand Corporation, P-4463, September 1970.
3. Proceedings the 8th Annual UAIDE Meeting, November 3-6, 1969, Coronado, California, p. 289-298.
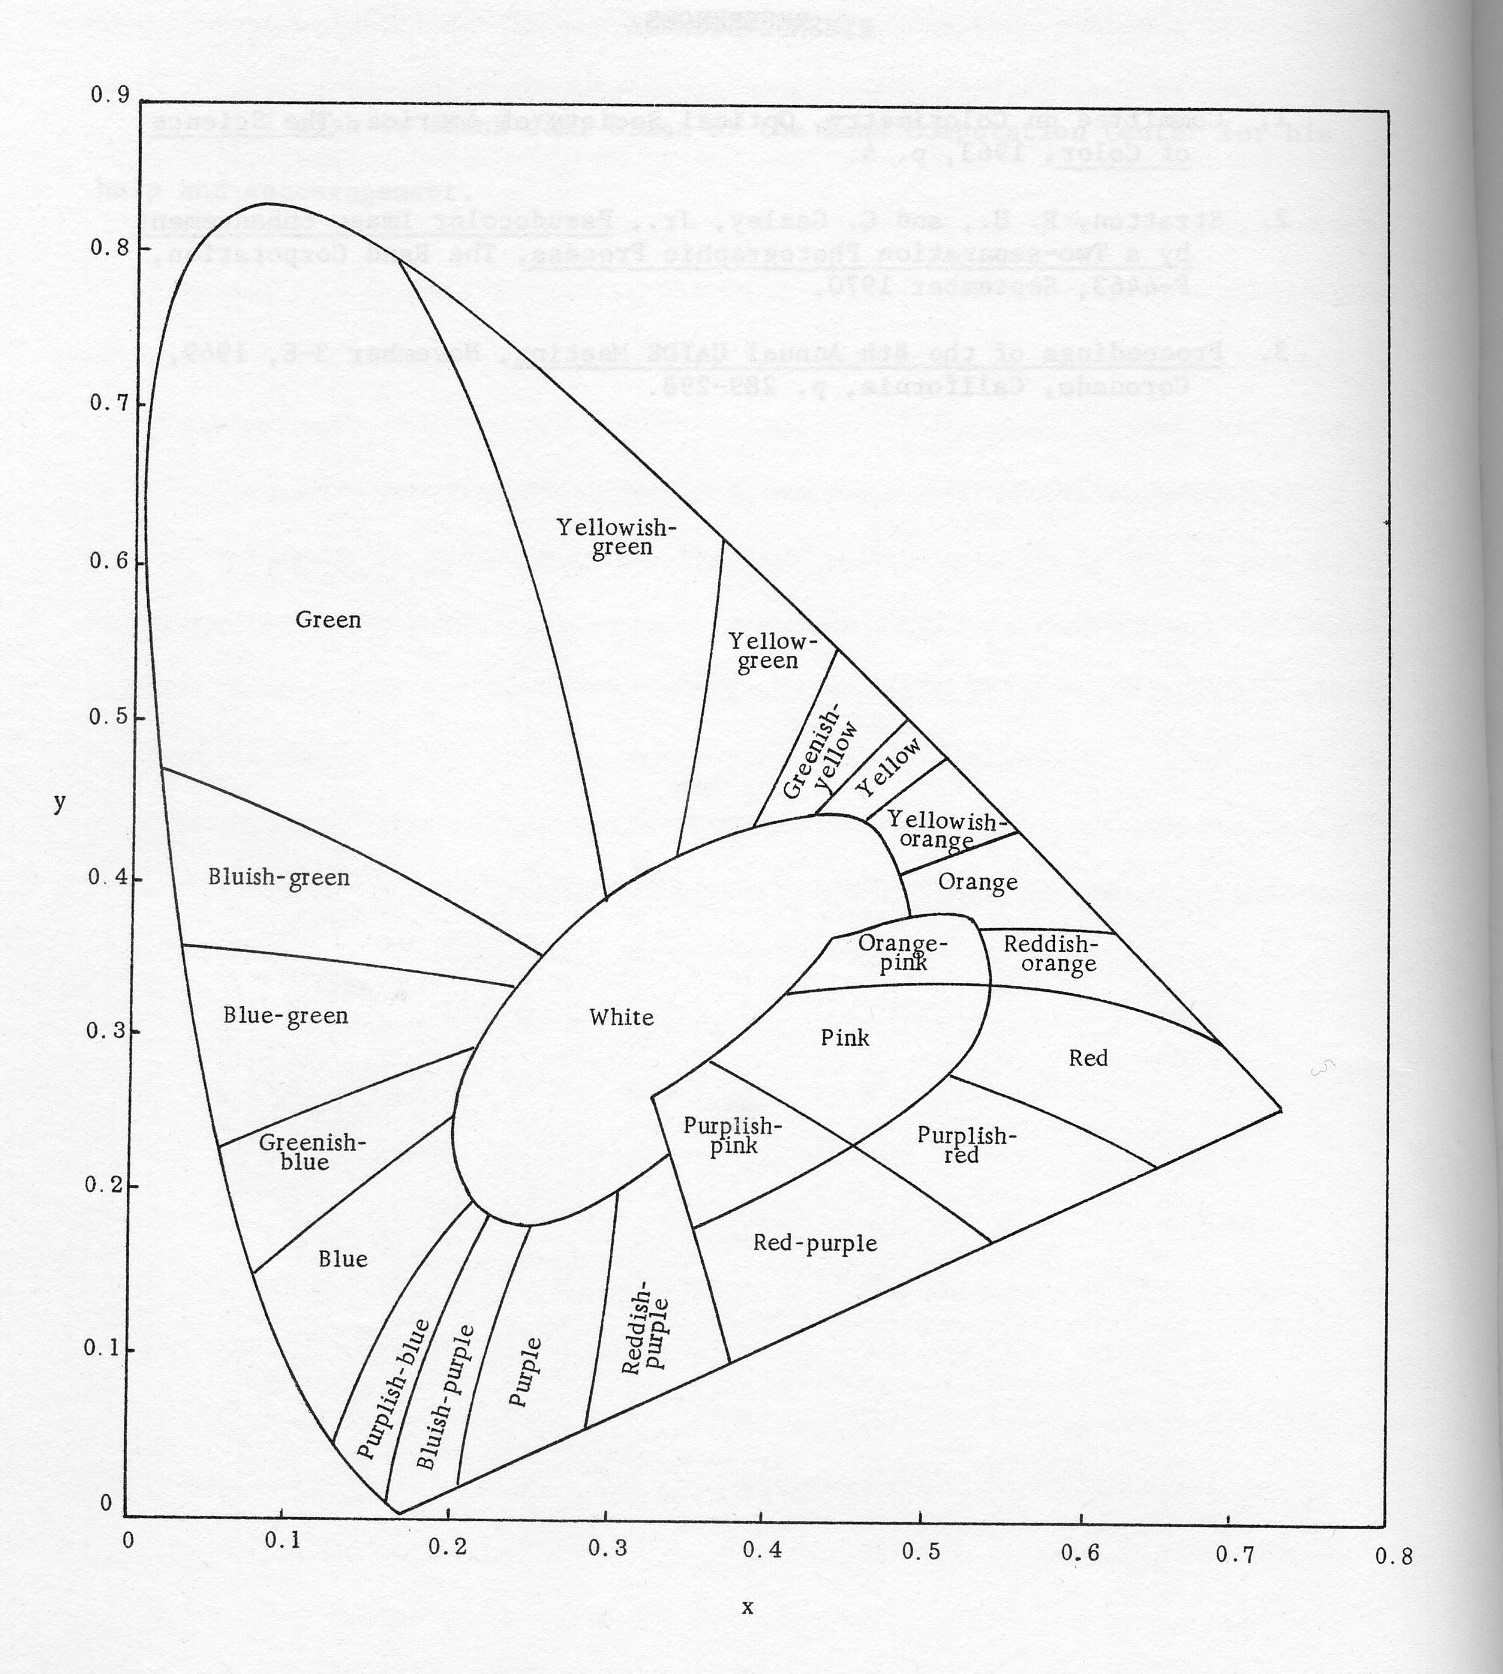
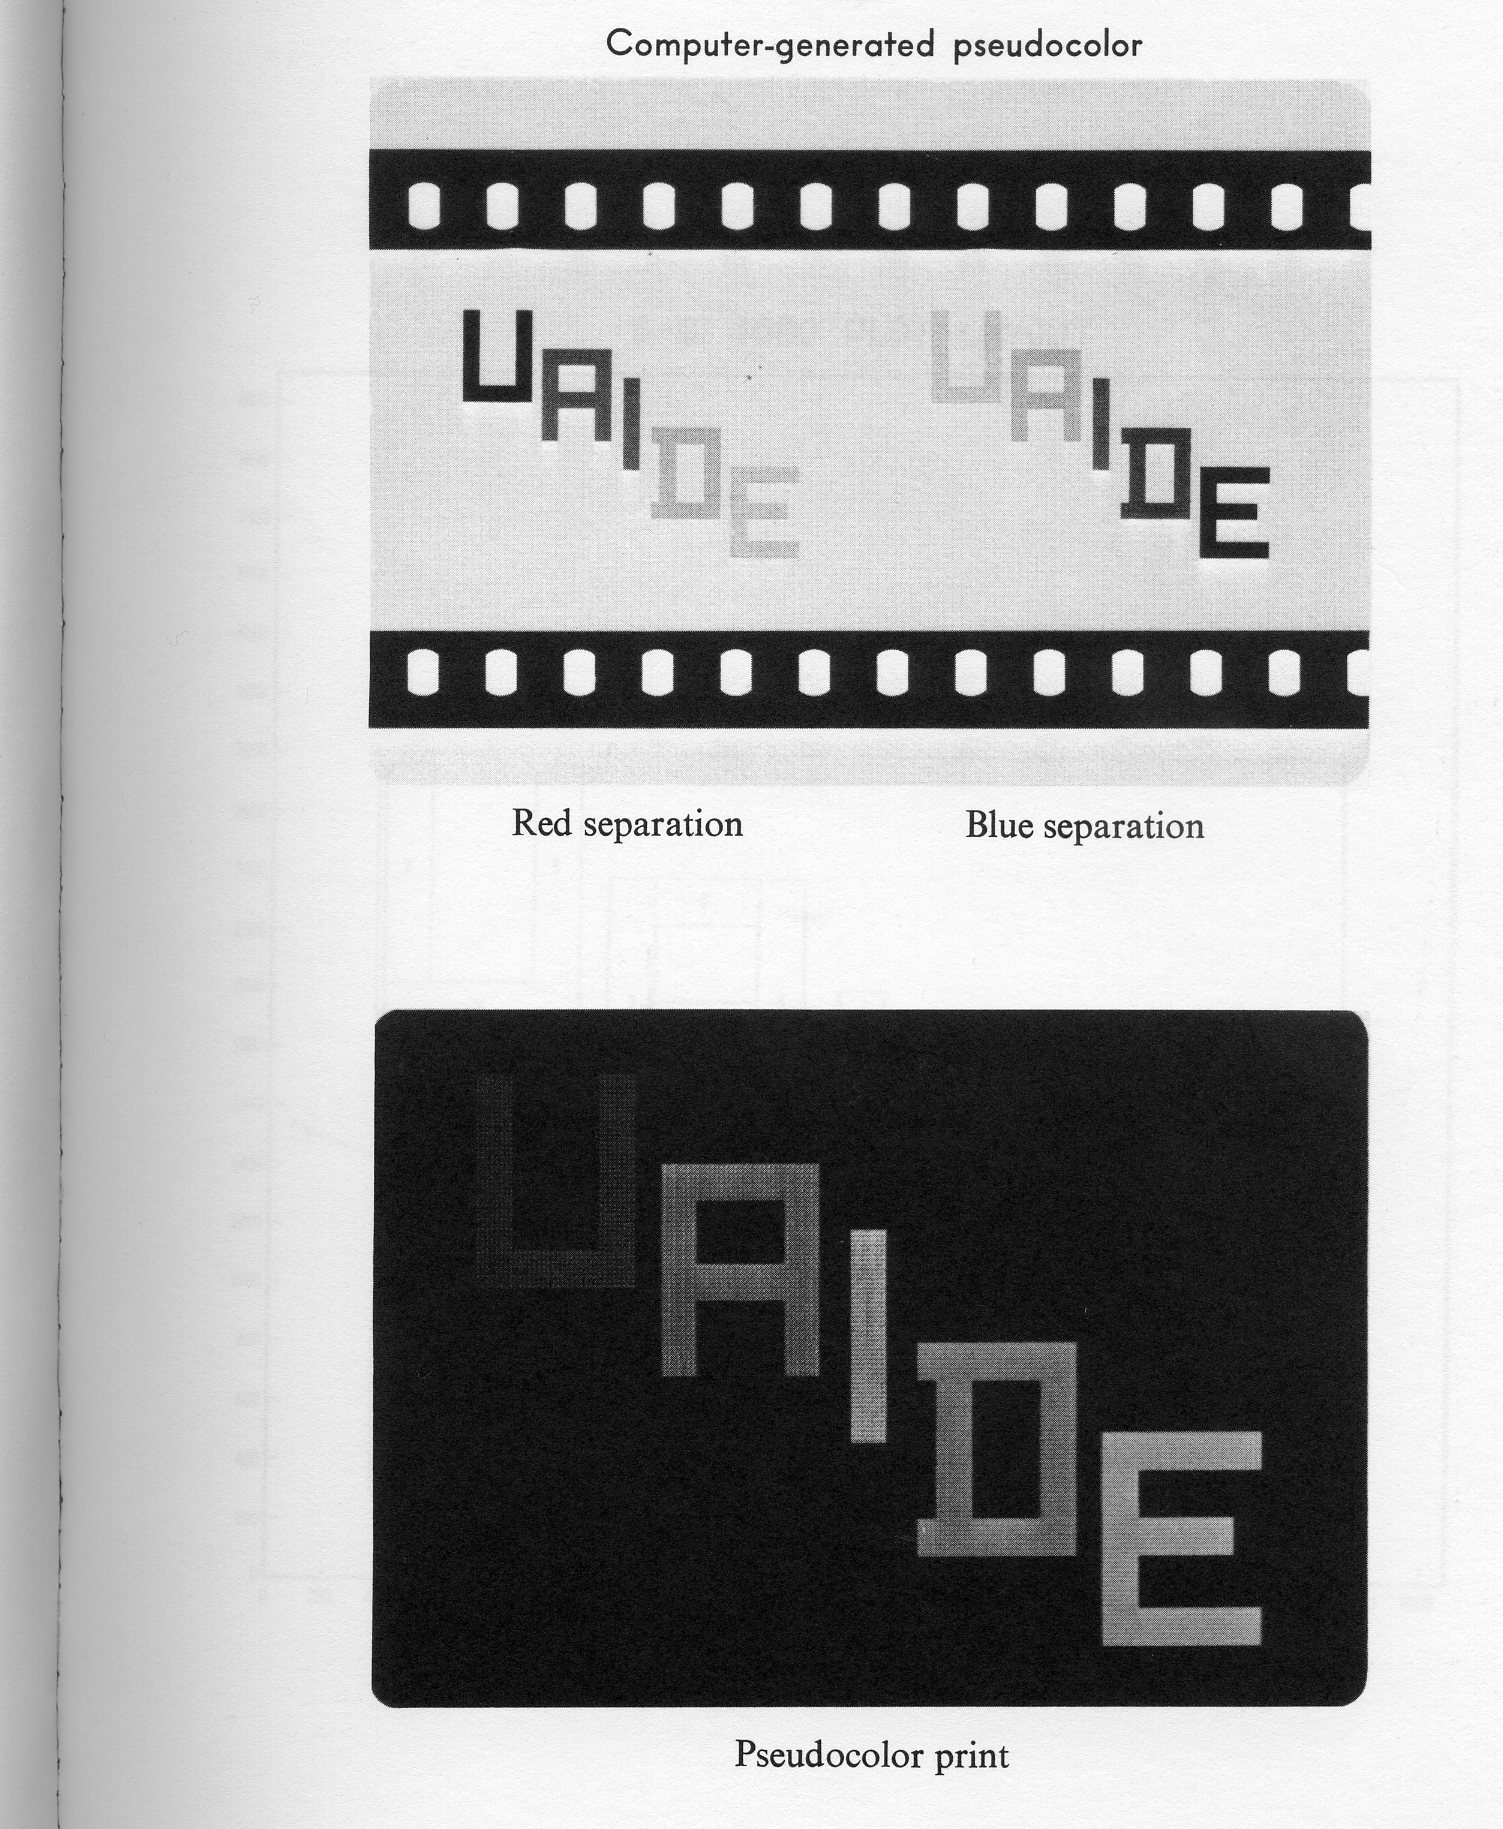
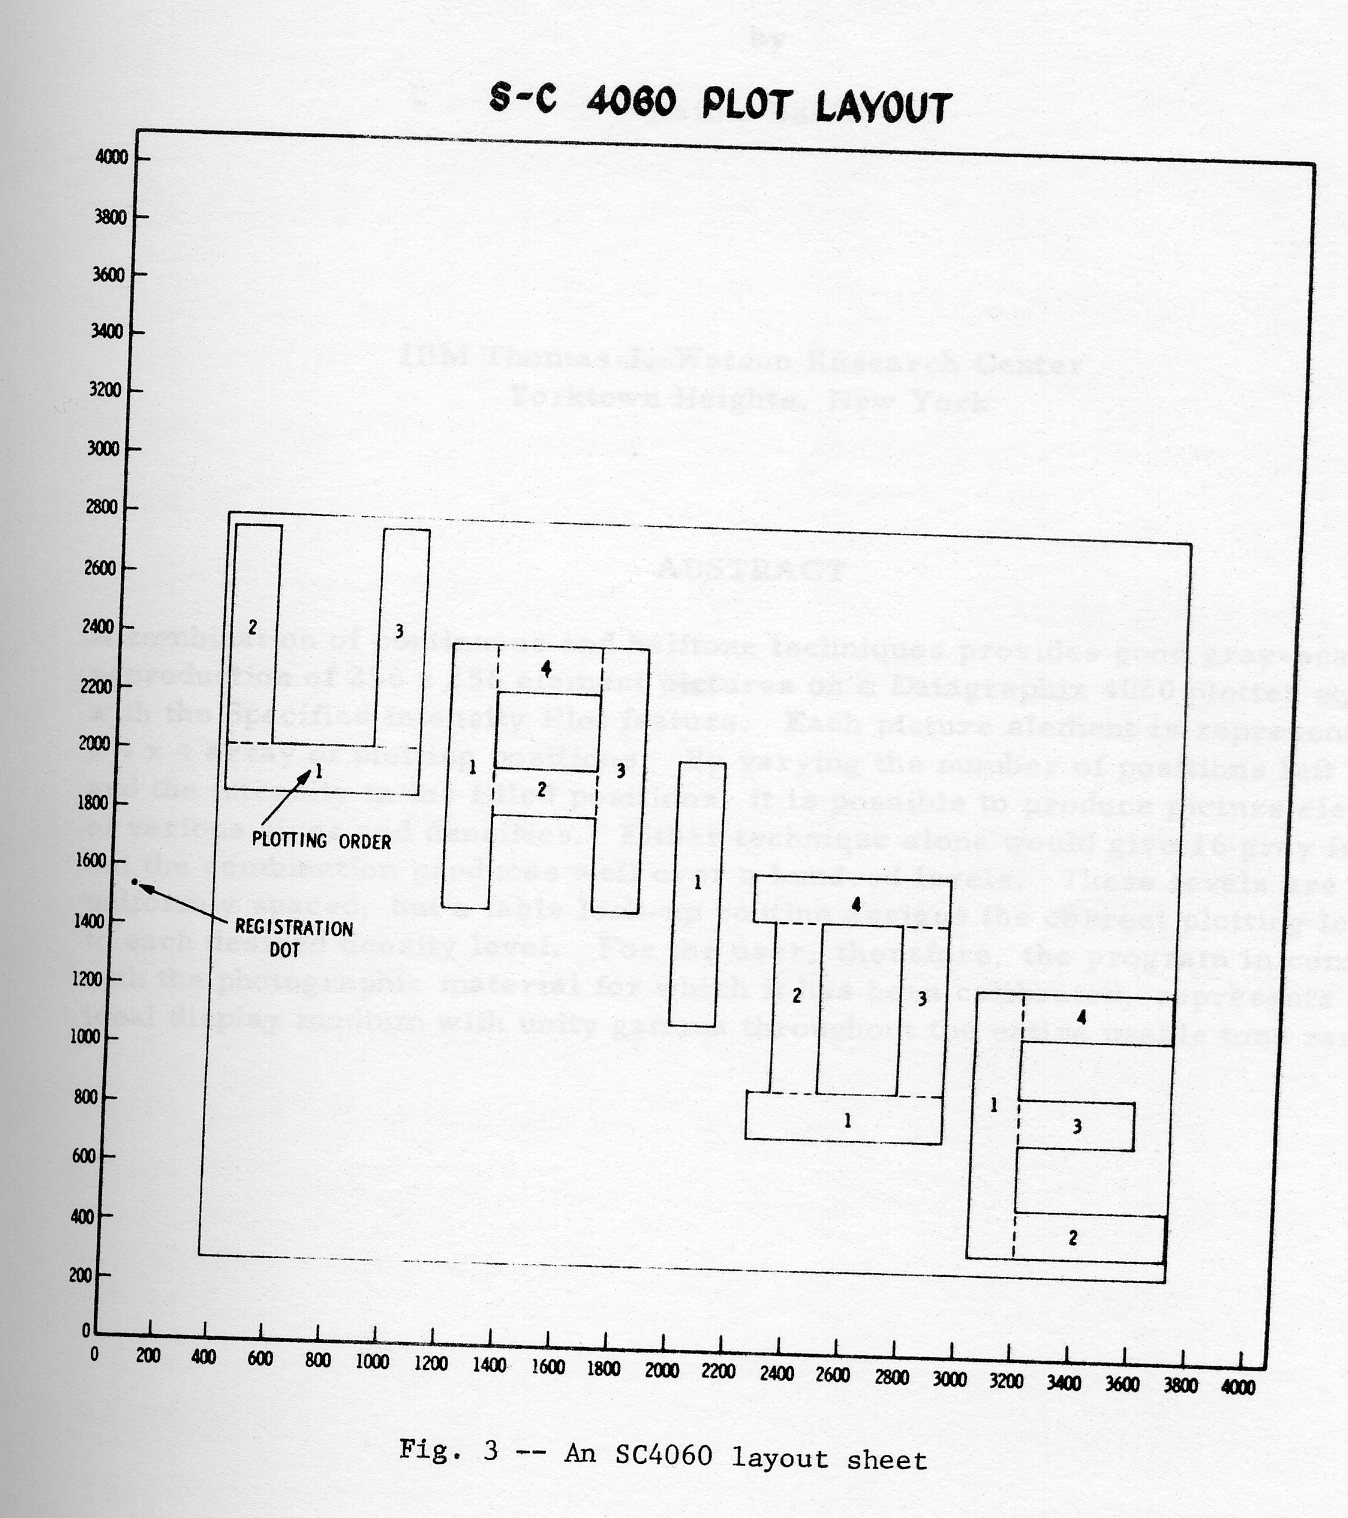
A combination of continuous and halftone techniques provides good gray-scale reproduction of 256 × 256 element pictures on a DatagraphiX 4020 plotter equipped with the Specified Intensity Plot feature. Each picture element is represented by a 4 × 4 array pf plotting positions. By varying the number of positions left blank, and the intensity in the filled positions, itis possible to produce picture elements of various sizes and densities. Either technique alone would give 16 gray levels, but the combination produces well over a hundred levels. these levels are not uniformly spaced, but a table look-up routine assigns the correct plotting level to each desired density level. For the user, therefore, the program in combination with the photographic material for which it has been calibrated, represents an ideal display medium with unity gamma throughout the entire usable tone range.
In an ideal gray-scale display the luminance of each image point would be directly proportional to the numerical video level at that point. Many causes prevent the realization of such a display. One of them is the necessity to quantize the video if the display has no continuous-tone capability. The resulting quantizing error, or noise, degrades the image. It is possible to reduce this error at the expense of spatial resolution by combining a number of display points into one. This method for increasing the effective number of gray levels, is the topic of this paper.
To illustrate the method, imagine a display capable of 1024 × 1024 resolution, but without gray-scale capability. Each display point can either be black, represented by a binary 0, or white, represented by 1. We now use an array of 4 × 4 display elements to represent each picture element. The picture resolution is then only 256 × 256. Since, however, we can now have 0, 1, 2, .... or 16 white display points in each 4 × 4 array, we have effectively increased the number of gray levels from 2 (0 or 1) to 17 (0 through 16).
As we shall show, the same principle can be used to advantage, even if the basic display has more than two gray levels. If the number of levels is insufficient, or the spacing of the levels is unsuitable for good tone reproduction, the method described here can provide enough additional levels to greatly improve the picture quality.
The Stromberg-Carlson 4020 plotter is capable of 16 gray levels when the Specified Intensity Plot feature is installed. This number of levels, however, is not sufficient for good gray-scale reproduction, because the levels represent 16 linear increments of exposure time. The visual effect of a given amount of light is more nearly proportional to the logarithm of the amount of light than to the linear quantity. If we were to view the image on the plotter CRT directly, the high intensity levels would appear to be more closely spaced than the low intensity levels. Levels 14 and 15 would be almost indistinguishable, but the brightness difference between levels 1 and 2 would be so great that details of shading would be completely lost in a picture. As we shall see, the photographic process in which a negative of the image is produced, does not improve the situation.
Figure 1 shows the 16 exposure levels on the x-axis and the corresponding logarithmic values (approximating subjective brightness) on the y-axis. Here you can see the wide spacing between levels 1 and 2, and the crowding near the upper end of the scale. The photographic effect of these exposure levels is shown in Figure 2. Here the logarithm of the exposure is plotted on the horizontal axis and the resulting density of the photographic paper is plotted on the vertical axis. Density is a logarithmic quantity which is commonly used in measuring photographic darkening. The density is defined as the logarithm of the reciprocal of the reflectance of an opaque material or transmittance of a transparent material. Since, as I said before, the eye responds approximately logarithmically, density is an appropriate measure of image brightness. We see in Figure 2 that the photographic paper characteristic itself is curved, aggravating the crowding of the levels near the high-exposure (dark) end of the scale. Thus, instead of having 16 uniformly spaced levels, we have the visual effect of a spacing about as coarse as would be obtained with 8 uniform spaces. Figure 3 shows a gray scale plotted with these 16 levels.
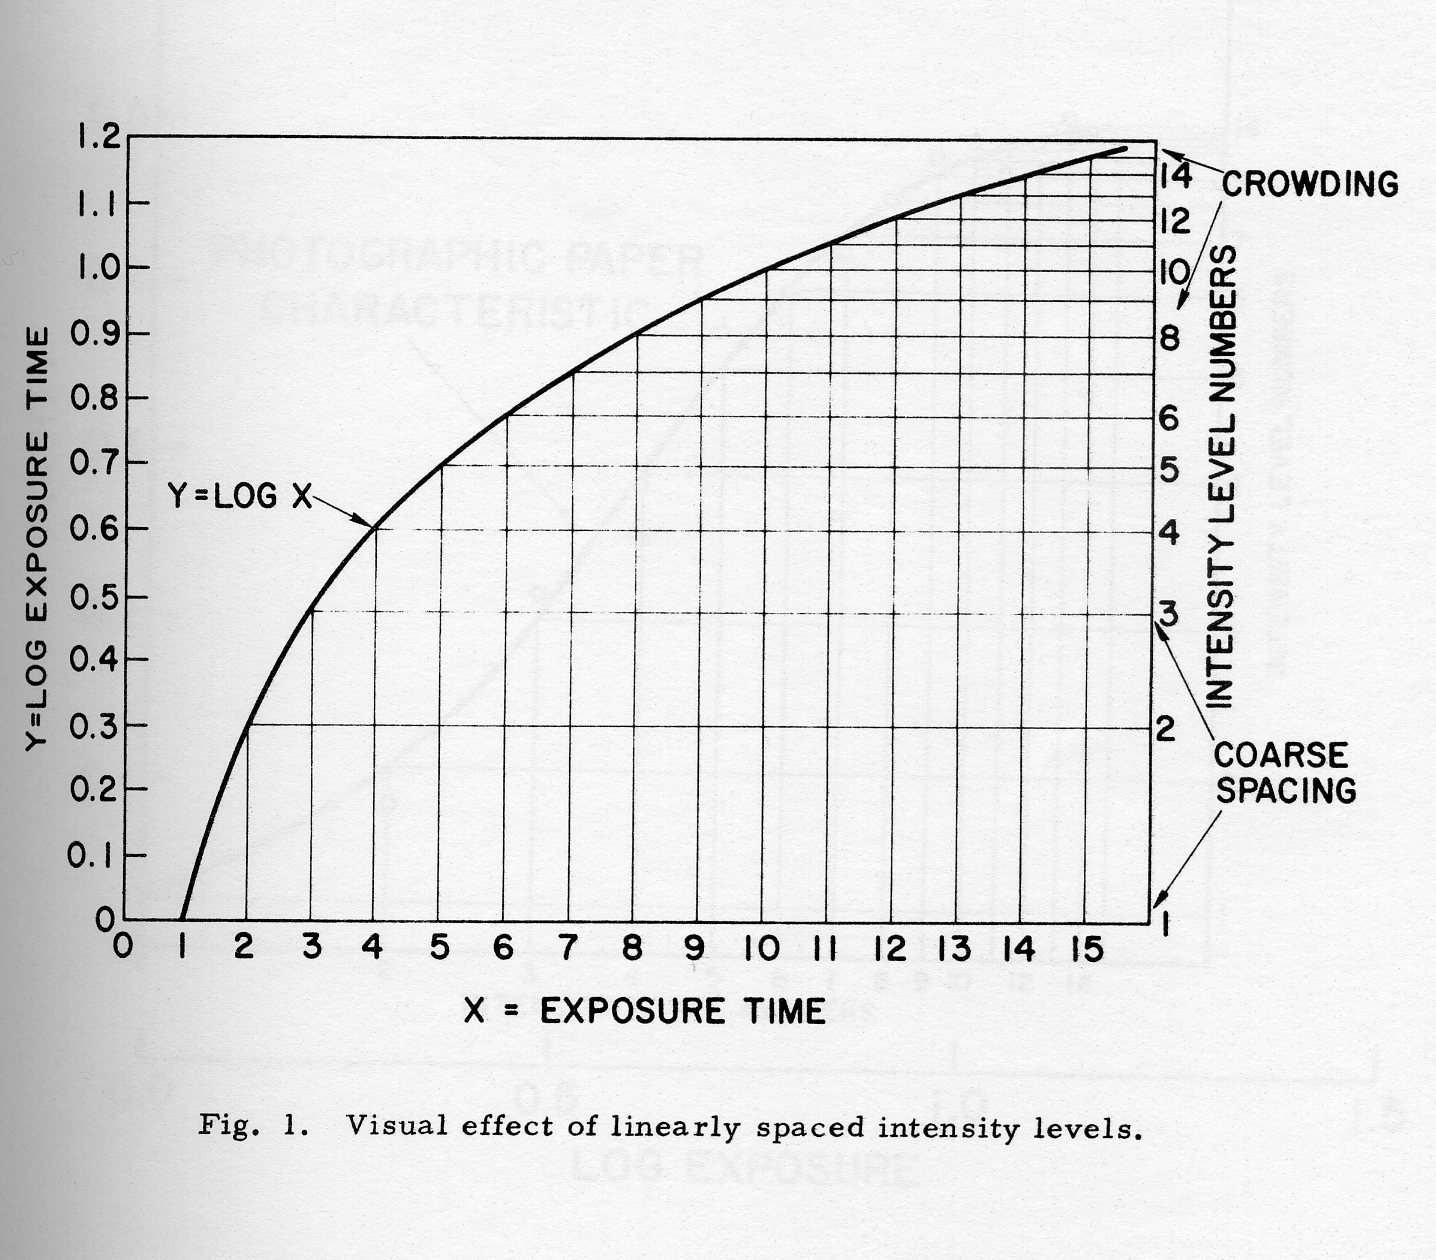
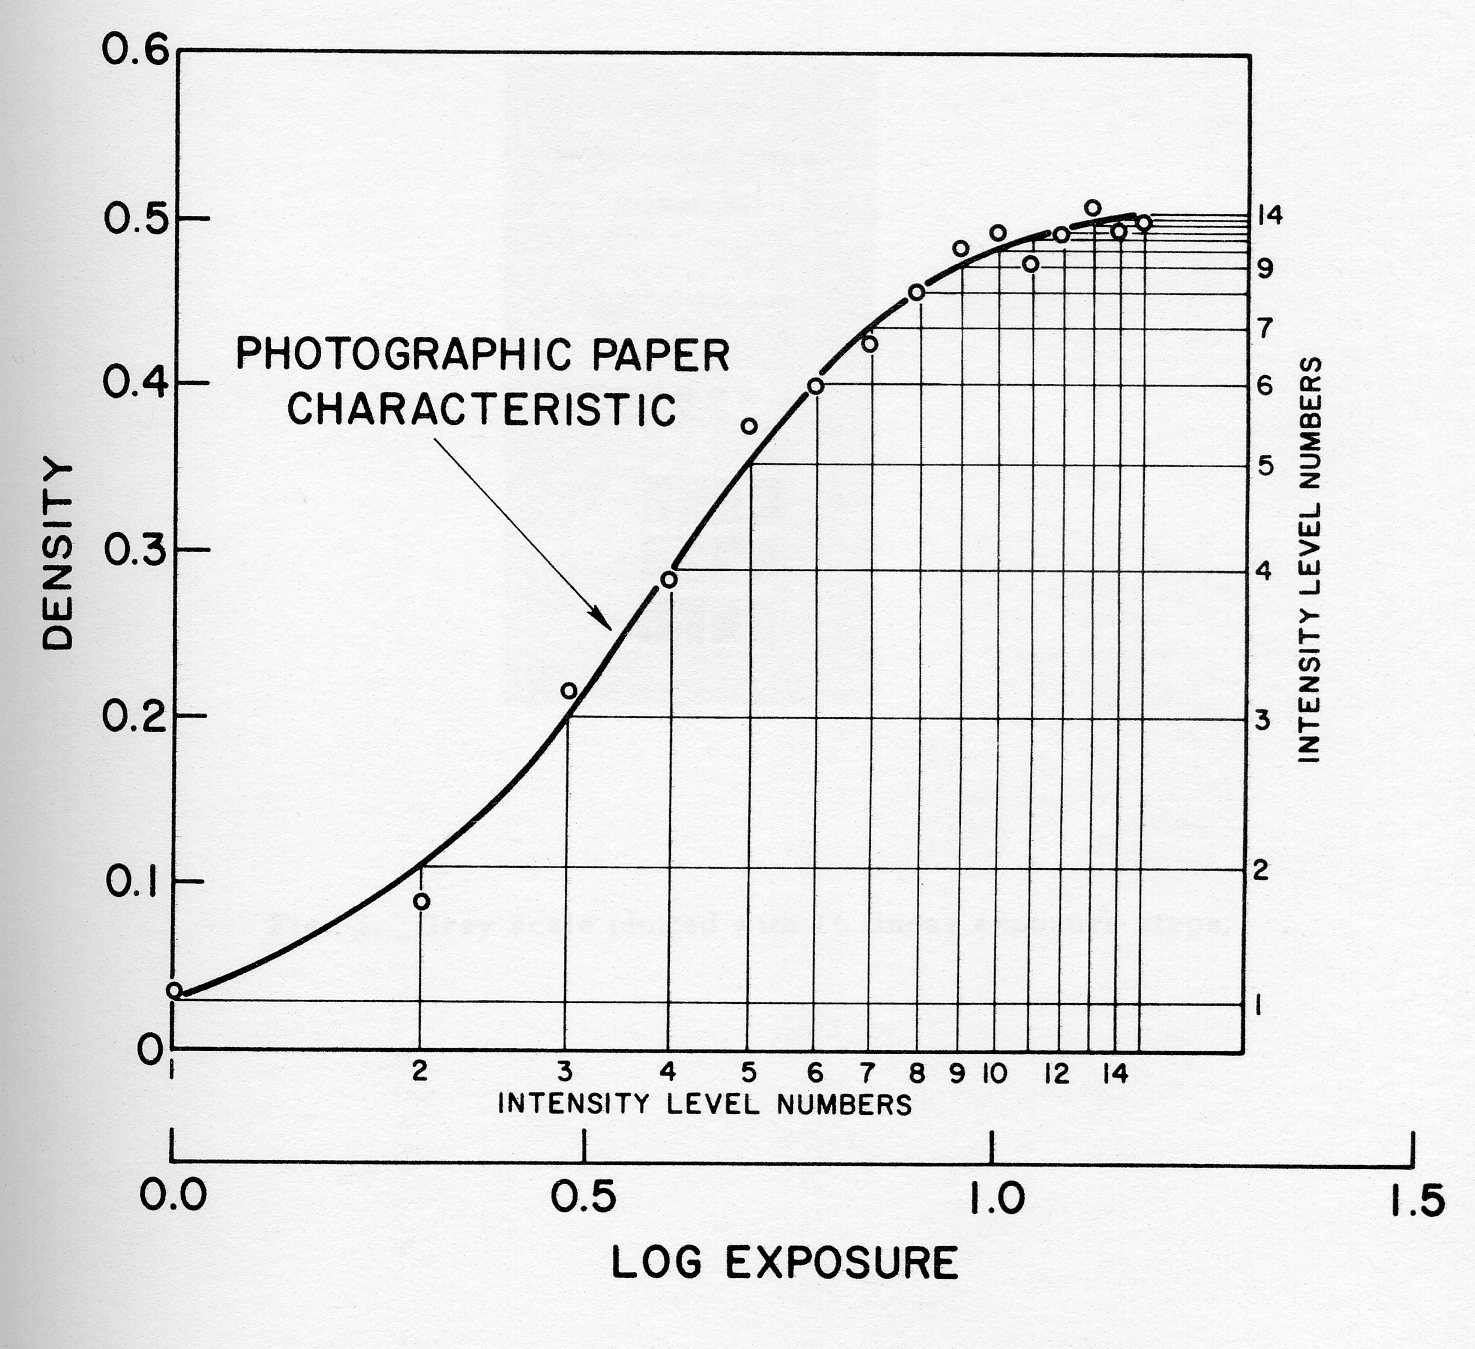
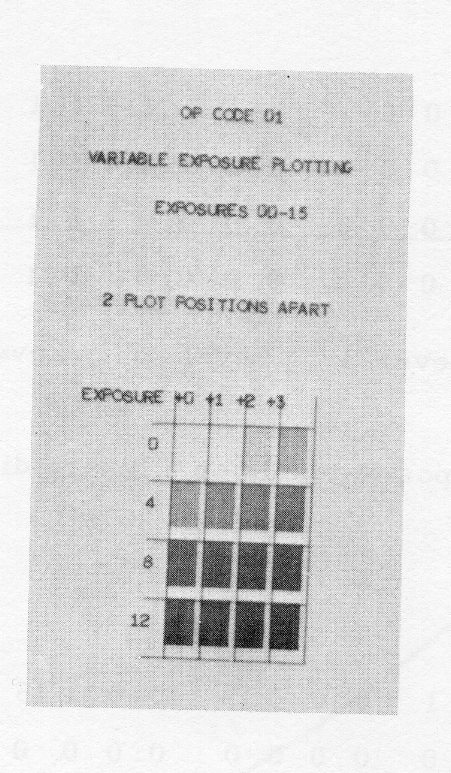
Beside the coarse spacing of the gray levels, the curve in Figure 2 shows another defect - it saturates at a density of about 0.5. This means that the darkest level is not black, but only gray. The reason for this is, that this curve was measured on a plot where the points were two addressable positions apart. If every addressable position had been used, a higher maximum density would have been obtained, but the jump between levels 1 and 2 would have been further increased.
It is clear, then, that even a plotter with 16 gray levels might benefit from increasing the number of levels, not to speak of binary displays. To show in detail how additional levels can be produced at the expense of spatial resolution, we first consider a binary display. Figure 4 shows a few possible picture elements, each made up of 16 plotting positions. The first pixel (left) consists of all zeros. It is a maximally black element. The next one consists of a single light point. It represents level 1. The next element shown has six light points. The rightmost one is the highest level consisting of sixteen light points. With this technique, we are effectively varying the black area in each picture element. This is essentially the same technique as is used in halftone reproduction of images in printing. In both cases, the basic medium is capable of only a black or white condition, but by varying the proportion of black in the image, we are able to create the visual effect of a number of intermediate gray levels.
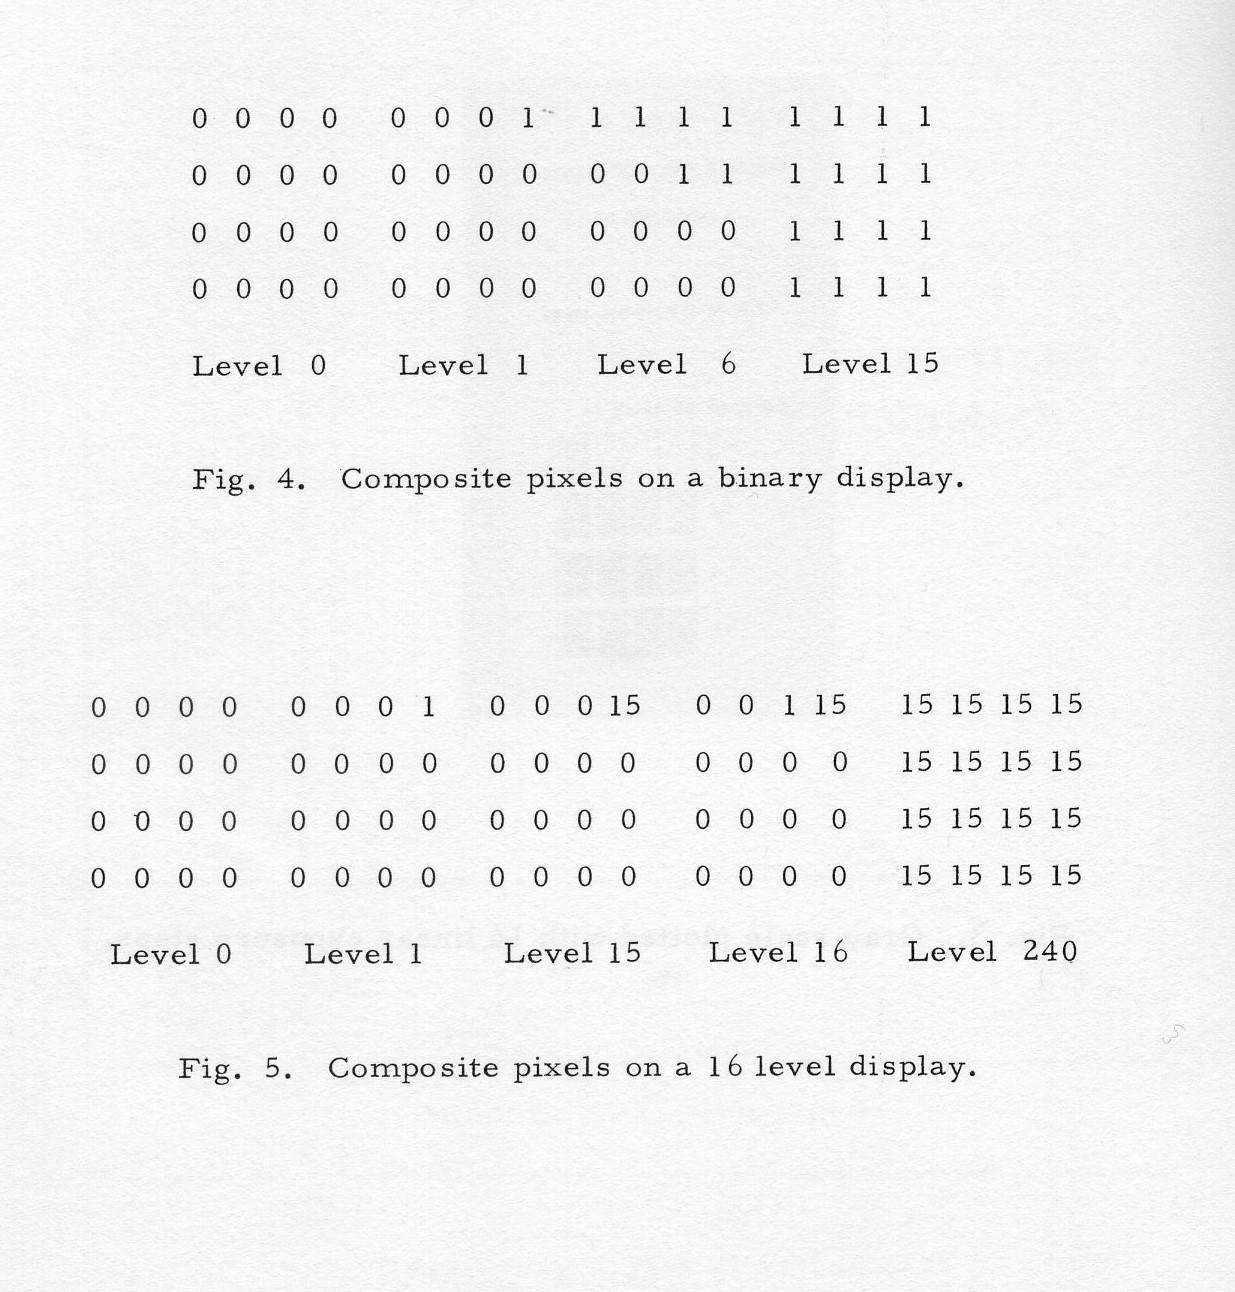
Although this halftone method is an improvement over a purely binary image, a still better tone scale can be obtained if the plotter itself has several intensity levels available. Such is the case for SC 4020 plotter with the Specified Intensity Plot feature. Figure 5 illustrates composite picture elements which can be constructed with such a machine. We start with all zeros, as before. The next step has a single 1 among the 15 zeros. We then increase the intensity of that single non-black point position, and so on. In this way it is possible to construct 240 gray levels plus one black level consisting of only zeros. Since we are varying both the size of the dark area, and the density within this area, we are effectively combining half-tone and continuous-tone techniques, where continous actually means 16 distinct densities.
The spacing of the plot points may be reduced to the smallest possible value, because it is not necessary that individual plot points be resolvable. Only the composite picture elements, consisting of 4 × 4 plot points must be resolvable. We use, therefore, all 1024 addressable plotting positions. The individual plot points overlap, but this does not impair picture resolution. The overlapping has the beneficial effect of increasing the maximum photographic density in the picture to about 1.1, corresponding to a minimum reflectance of about 8%. KODAK Ektaline paper was used in this experiment.
Figure 6 shows the characteristic curve for this scheme. The 240 plotting levels are shown on the abscissa, and the measured densities on the ordinate. This curve exhibits the toe and shoulder effects common to photographic processes. We can correct for these, however, by numerical manipulations on the video before plotting. This can be conveniently done by means of table lookup, to assign the correct plotting level to each desired density or reflectance value.
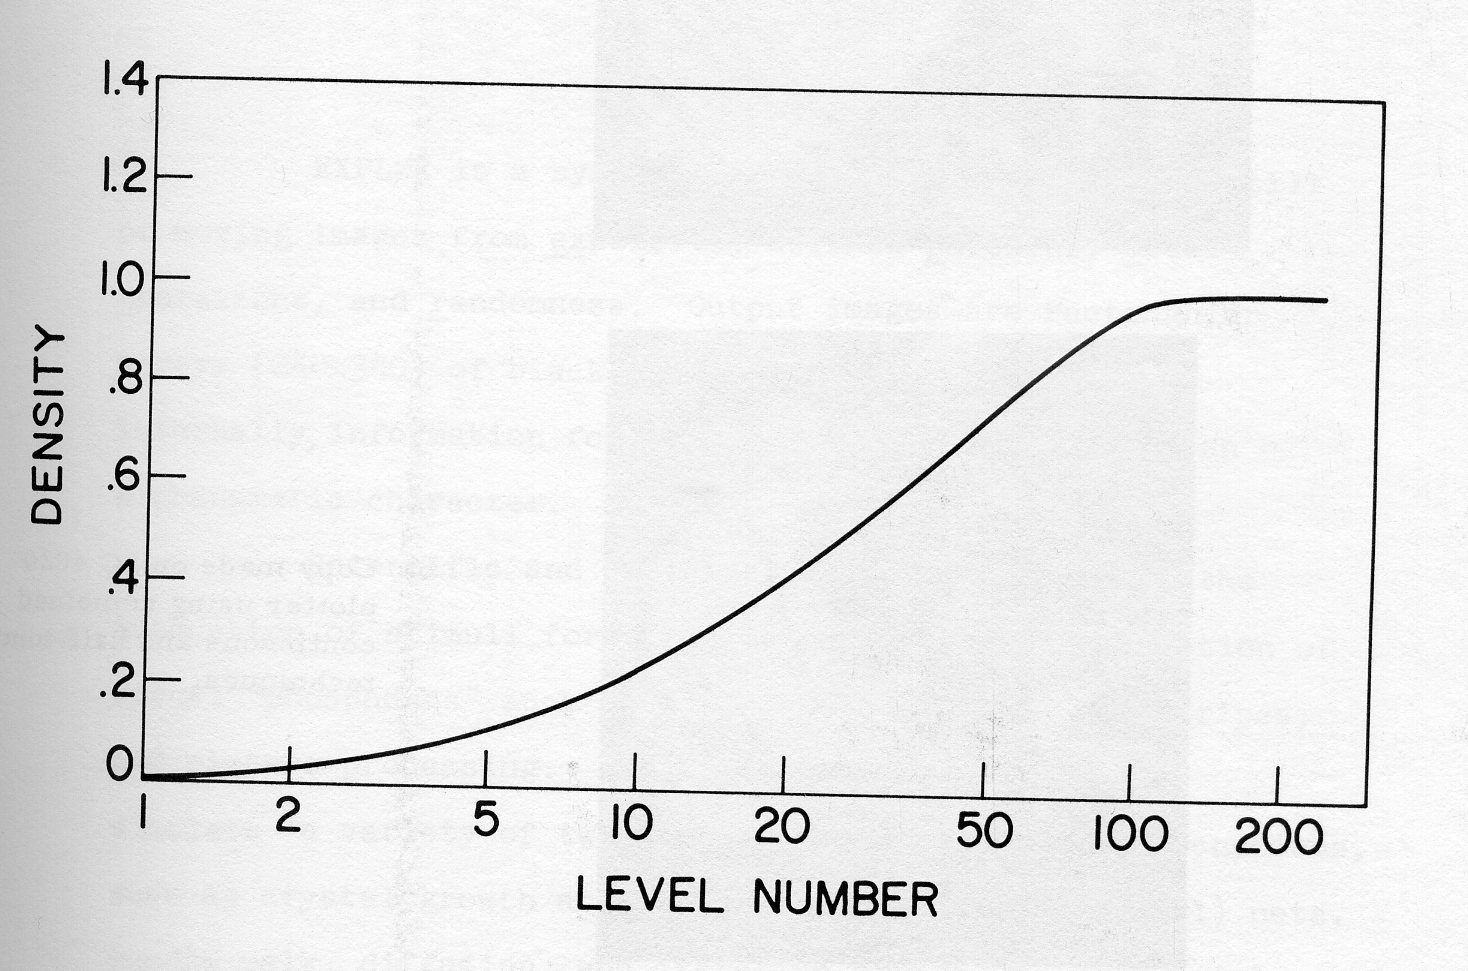
Figure 7 shows an image thus produced. The density difference between levels 1 and 2 is approximately 0.03, which is just visible. Except for this one step, the levels blend imperceptibly into each other and give the effect of a continuous gray scale.
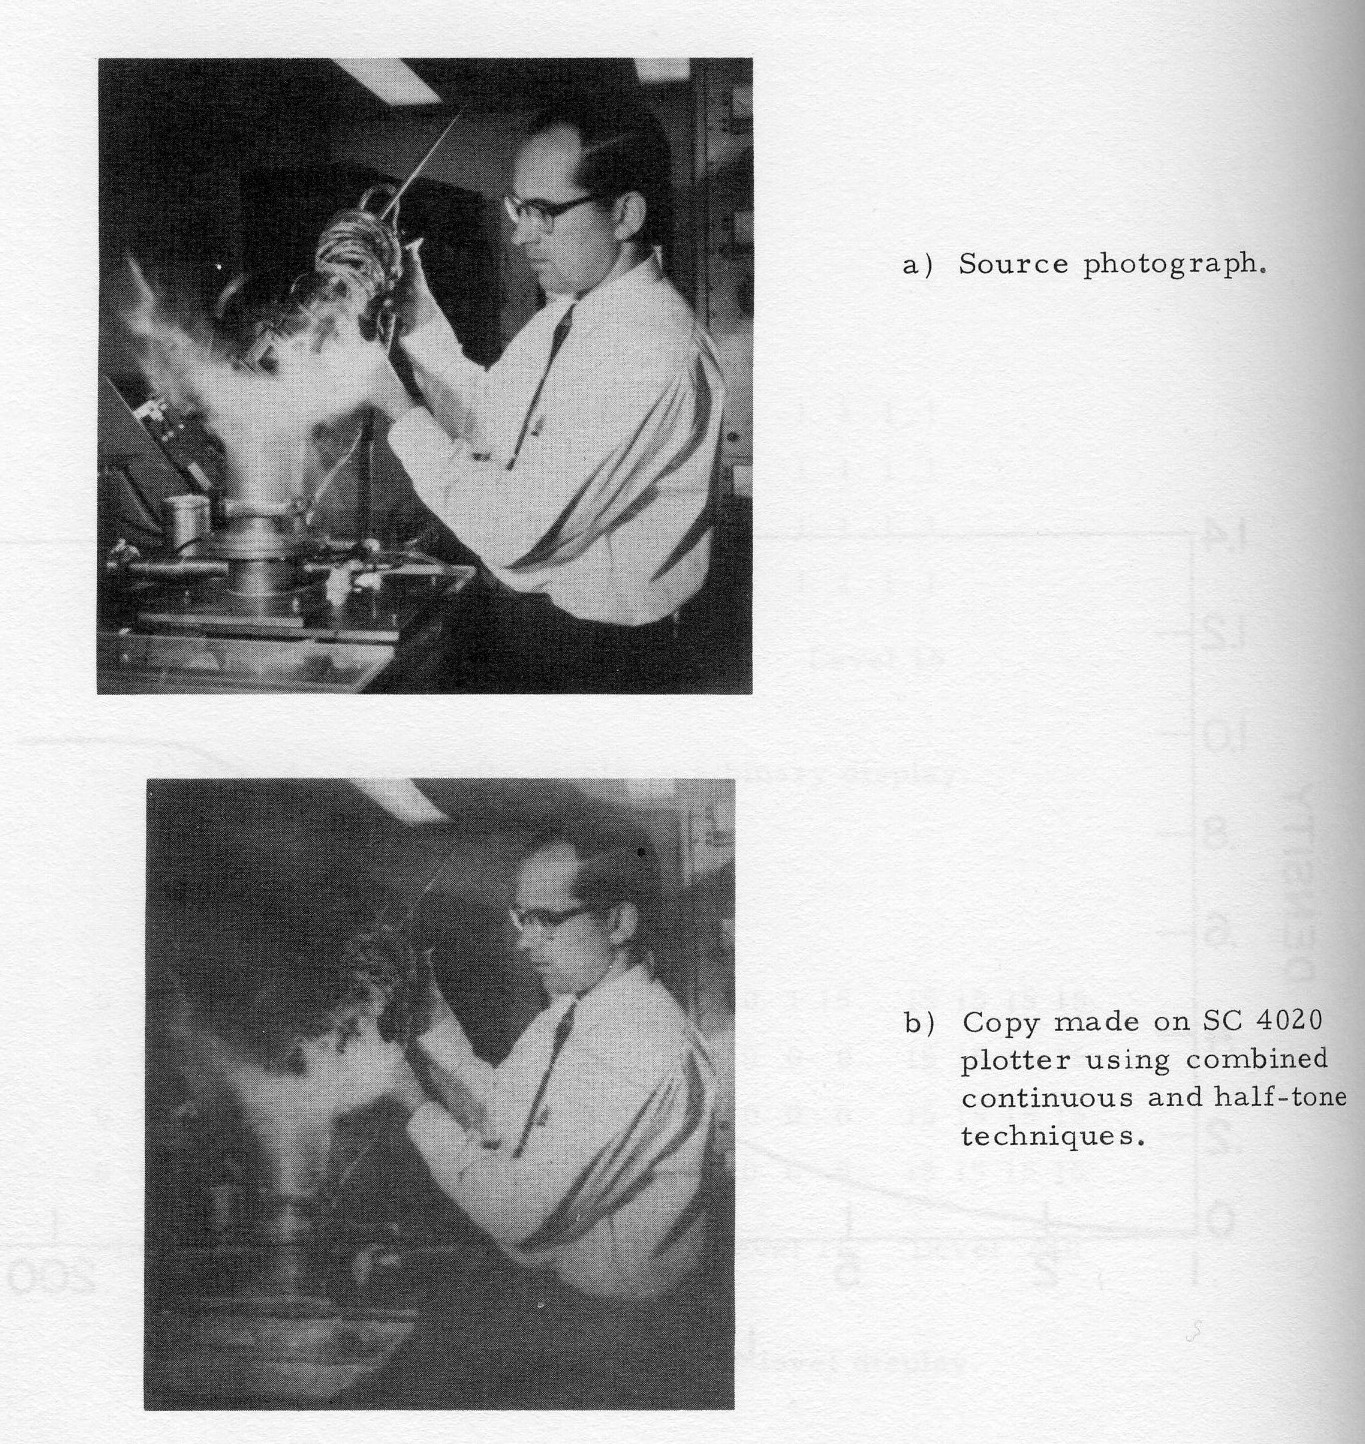
It might be objected that 240 levels are in excess of the capability of the photographic paper, and that fewer levels should therefore be used. This objection, however, would be valid only if we wanted to distinguish the levels visually. In fact, we want just the opposite - the effect of a continuous tone scale. It is, therefore, quite permissible to use a large number of levels in order to approximate the desired continuum. Furthermore, if we think of the quantizing error of video as one noise source among many, it becomes clear that effectively eliminating one noise source can only improve the picture, even if other noise sources remain (e. g. photographic grain or non-uniformity).
In conclusion, then, we have demonstrated a method for increasing the number of gray levels in a display, at the expense of spatial resolution. When applied to the Stromberg-Carlson 4020 plotter, equipped with the Specified Intensity Plot feature, this method provides up to 240 gray levels. This is more than sufficient to eliminate the effects of video quantizing noise, and given the impression of a continuous gray scale in the picture.
EXPLOR is a system for computer-generation of still or moving images from EXplicitly defined Patterns, Local Operations, and Randomness. Output images are rectangular arrays (240 × 340) of black, white, and twinkling dots; internally, information for each position is encoded as an alphanumeric character.
Scientific and artistic applications include the production of stimuli for visual experiments, the depiction of visual phosphenes such as moving checkerboards and stripes, and picture processing. The system may also be used to simulate a variety of two-dimensional processes and mechanisms, such as crystal growth and etching, neural (e.g. retinal) nets, random walk, diffusion, and iterative arrays of logic modules.
The EXPLOR system is useful for the production of still and moving pictures for a variety of research, educational and artistic purposes, such as the simulation of two-dimensional processes and the generation of displays for psychophysical experiments on human vision.
Each of the images generated is a two-dimensional array of white and black dots like those in Figs. 1 through 8, to be described later. Within the computer information for each position is stored as a digit 0,...,9, or a letter A,B,...,Z; the programmer specifies which of these characters are to be output as black and which as white dots, and which are to twinkle, i.e. be chosen at random (probability = 1/2), frame by frame, to be black or white.
The programmer imagines significant areas for different modes of operation as shown below. The normal run mode area is 340 units wide by 240 high; in the test mode, only the indicated 132 × 55 area is computed internally, and it is output by printer, not via microfilm:
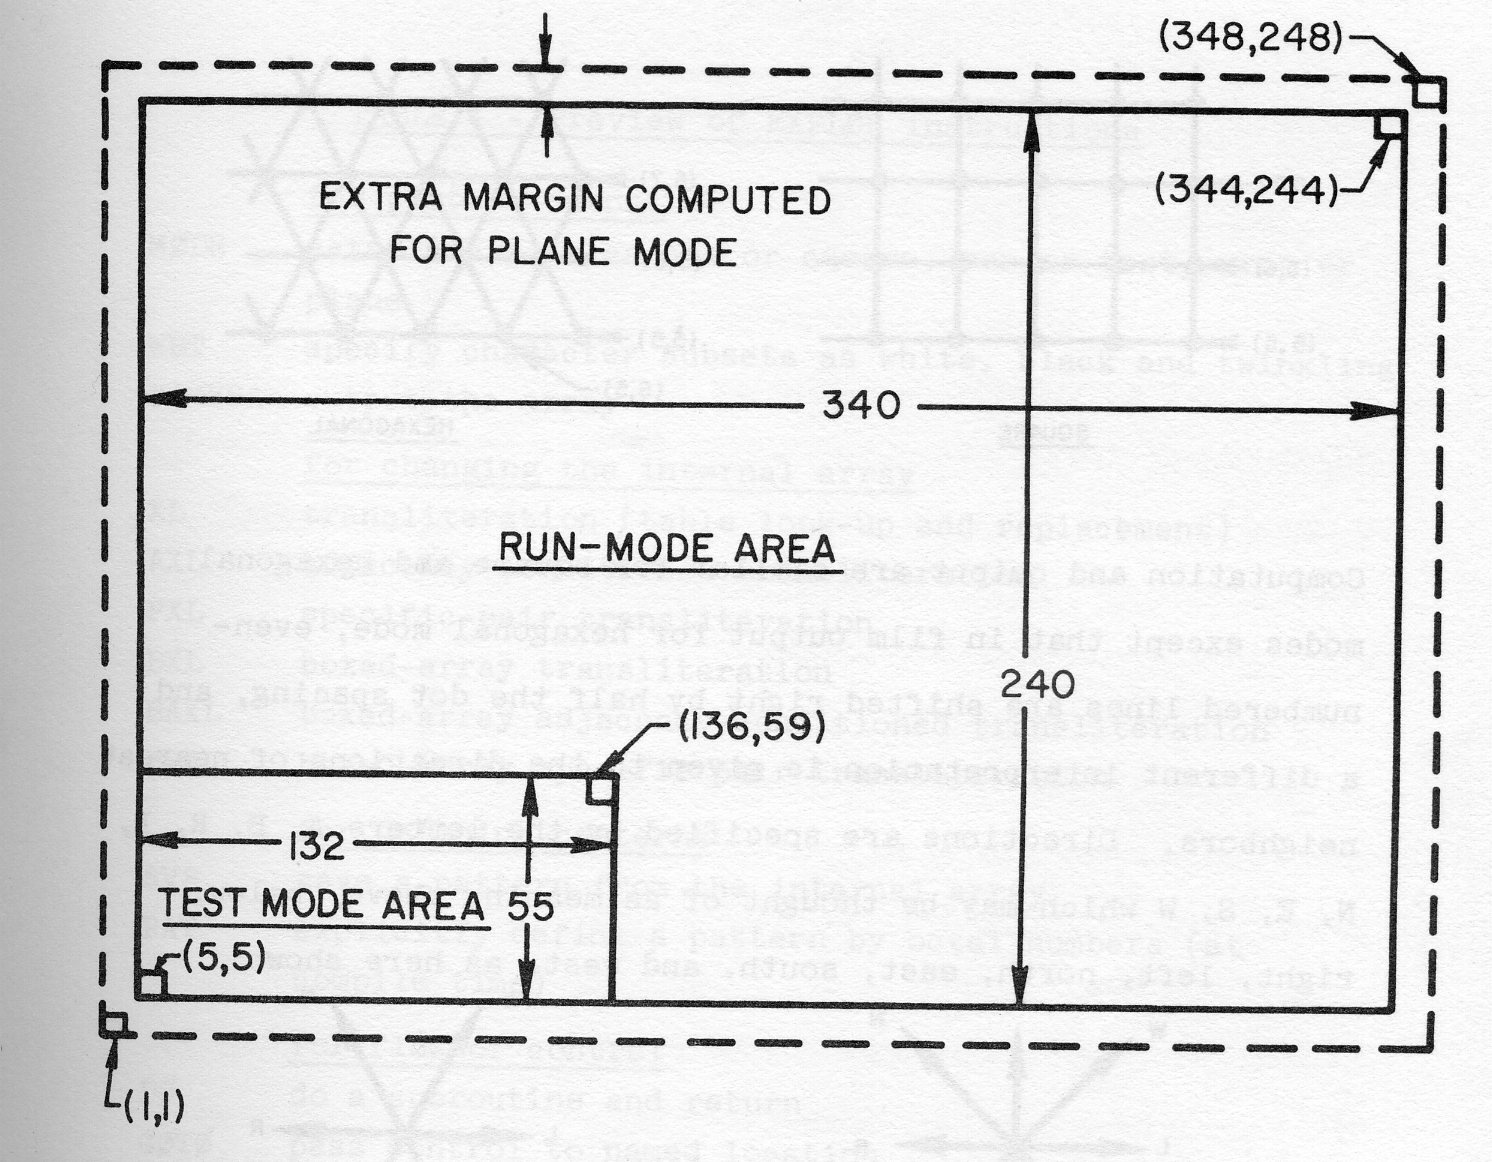
Another pair of modes, wrap vd plane, specifies whether the surface is considered to be a torus with opposite edges connected, or whether it is part of a large plane, in which case an extra 4 units of margin are computed, preserved and updated but never output. A final choice of modes is between square and hexagonal arrangements of units:
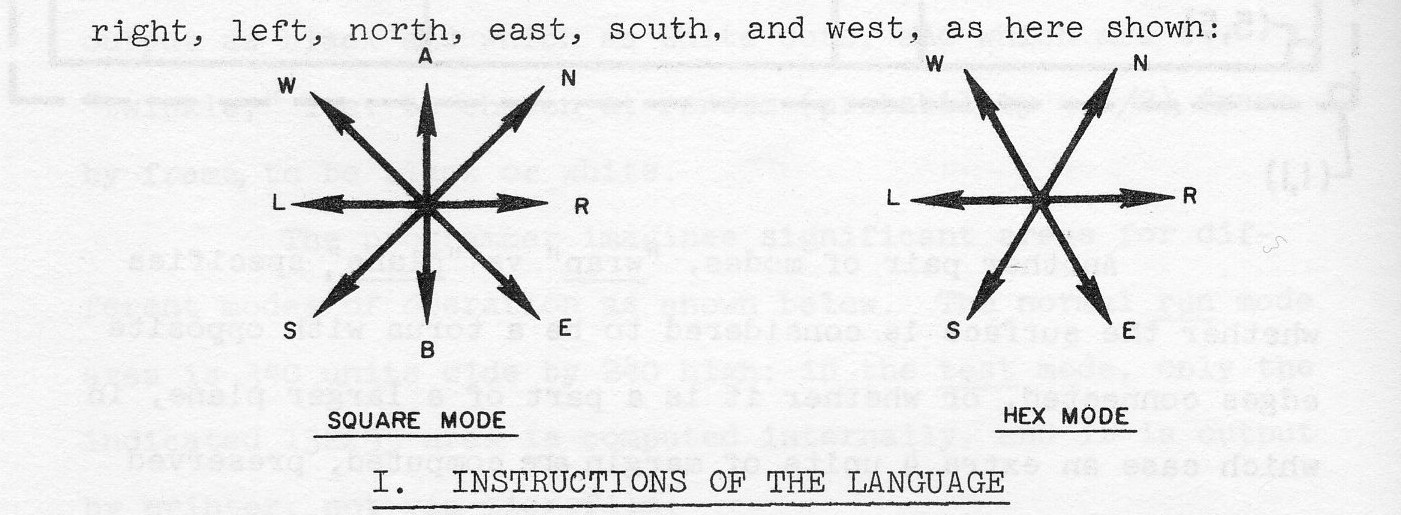
Computation and output are similar for square and hexagonal modes except that in film output for hexagonal mode, even-numbered lines are shifted right by half the dot spacing, and a different interpretation is given to the directions of nearest neighbors. Directions are specified by the letters A, B, R, L, N, E, S, W which may be thought of as meaning above, below, right, left, north, east, south, and west, as here shown:
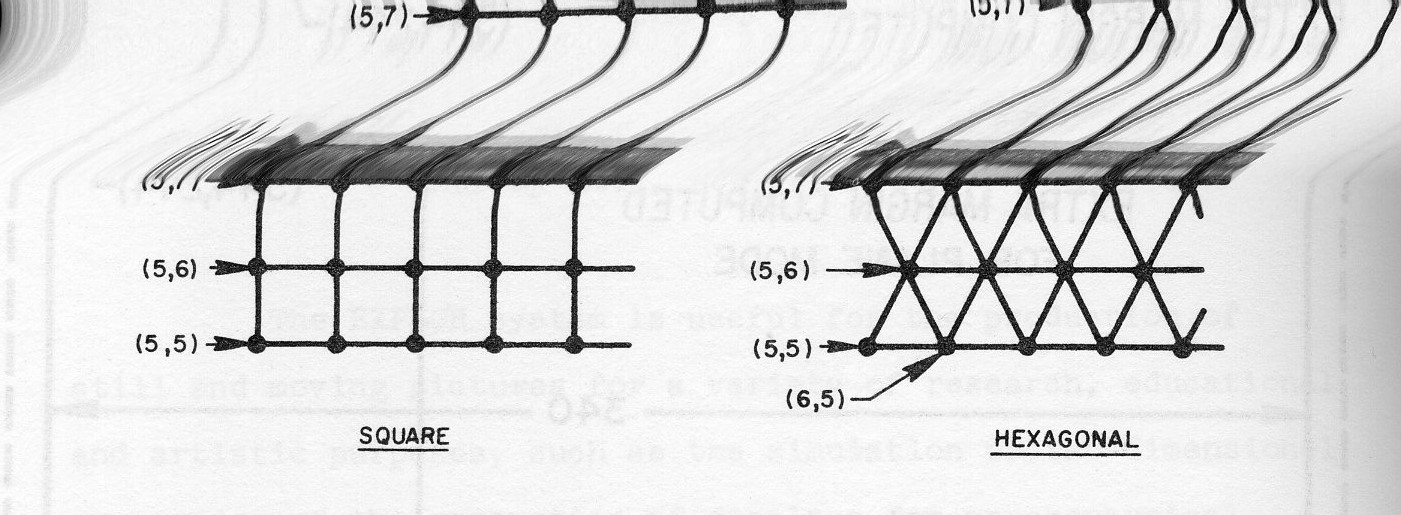
EXPLOR is a macro language. A summary of instruction names and their purposes are given in Table I; each of these and its parameters will be described in detail after a few general considerations that apply to most instructions.
Instructions have the form name
name opcode (n,p)list-of-arguments, goto
where name and goto are optional: a name is required only if control passes to this instruction from other than the one above it, or if this instruction is to be modified by another instruction; if and when the operation is performed, a goto if present causes control to pass to the named instruction, otherwise it goes to the line below.
The periodic and probabilistic indicator (n,p) determines whether the operation and goto will be effective when control reaches this point: every nth time through this point, the system tries to perform the operation, succeeding with probability 1/p (p is an integer); otherwise the operation is not performed and control goes to the next line, whether or not a goto is present. Alternatively, if an X precedes the n and/or the p, then the system tries all times except every nth time, and/or succeeds on all but 1/p of the trials. Examples and their meanings are here given:
(1,1)      always do this operation when control gets here
(1,16)     do this one with probability 1/16
(4,1)      do this one every fourth time
(8,2)      every eighth time through, flip a coin to decide
(X,50,l)   except for the 50th, 100th, etc. times, do it
(1,X,9)    do it with probability (1-1/9)
(X,2,X,50) almost always (p = 1-1/50), do it on the beat
A transliteration, noted as (xlit) in many descriptions of instructions below, is a scheme for replacing some or all of the 36 characters by other ones. It may be specified in one of four ways: First, a complete sequence of 36 characters specifies, in order, the characters into which 0,1,...,9,A,B,...,Z are to be translated. Thus (1234567890BCDEFGHIJKIM N0PQRSTUVWXYZA) says that each digit and letter go into the next higher one, with 9 changing to 0 and Z to A. Secondly: if the sequence is truncated, it is assumed that characters whose positions do not appear remain unchanged. Thus (ABCD) says 0 goes to A, 1 to B, 2 to C and 3 to D, everything else remaining as it was. Third, if the sequence ends in ..., it is assumed that the last character mentioned fills the remaining positions. Thus (012ABC...) means the same as (012ABCCCCCCCCCCCCCCCCCCCCCCCCCCCCCCC) and the designation (0...) means that everything becomes zeros. Finally, only specific transitions (at least two) may be specified, separated by commas. Thus (AB,CX,DE) says that A's become B's, C's become X's and D's become E's. If only one such transition is wanted, then a dummy, e.g. change C's to C's, must be added to distinguish this format from the second mentioned: (AB,CC).
MODE     (n,p)(list)goto
e.g.
MODE     (1,1)(WRP,RUN)
establishes the modes of operation by a list of up to three indicators from the following set:
The specified mode remains in effect until countermanded by a subsequent MODE instruction. Default mode is (TST,WRP,SQR).
WBT  (n,p)(whites,blacks,twinkles)goto
e.g.
WBT  (1,1)(01234,56789,ABCXYZ)
specifies which characters are output as white, which as black and which ones twinkle (i.e. are independently chosen spot-by-spot, frame-by-frame, to be black or white with 50/50 probability.) In the example, 0 to 4 are white, 5 to 9 black and letters A, B, C, X, Y, and Z twinkle; other letters retain their previous significance. Printed output - i.e. from TST mode - is unaffected by WBT: here zeros come out as blanks and all other characters appear as themselves.
CAMERA (n, p)frames,goto
e.g.
CAMERA (4,1)2
causes the indicated number of output frames of film to be produced if the mode is RUN; if TST, a single page of printout occurs for every seventh frame of specified output.
XL (n,p)q(xlit)goto
e.g.
XL (2,1)3(56,78)
probabilistically subjects all characters of the array to the specified transliteration. In the example, every other time control reaches this point, the instruction is effective - at which time about one-third of the 5's are changed to 6's and about one-third of the 7's are changed to 8's, other characters remaining as they were.
AXL (n,p)nums,dirs,chst,q(xlit)goto
e.g.
AXL (1,1)234,RNESW,ABCD,5(XXXXXXXXXX)
is a similar probabilistic transliteration but it applies only to those characters made eligible by adjacent characters: if certain numbers of neighbors in specified directions are among the given character set, then, with probability 1/q the transliteration is applied. In the example, if exactly 2 or 3 or 4 of the neighbors to the right, north, east, south or west are A's or B's or C's or D's, then about one-fifth of the digits 0-9 thus situated are changed to X's.
PXL  (n,p)dir,q(tpls)goto
e.g.
PXL  (1,1)R,1(12A,13B,24C,23X,14Y,348)
transliterates one member of specific pairs. For this operation, the array must contain only digits 0 to 7. In the example, the direction relation is right of and it says that 1's with 2's right of them become A's, 1's with 3's right of them become B's, 2's with 4's right of them become C's, etc. All three of the foregoing transliterations may be applied inside of regularly arrayed boxes specified by:
x,y   coordinates of center of top right box
w,t   how wide and tall each box is
h,v   center-to-center horizontal and vertical spacing
c,r   number of columns and rows of boxes.
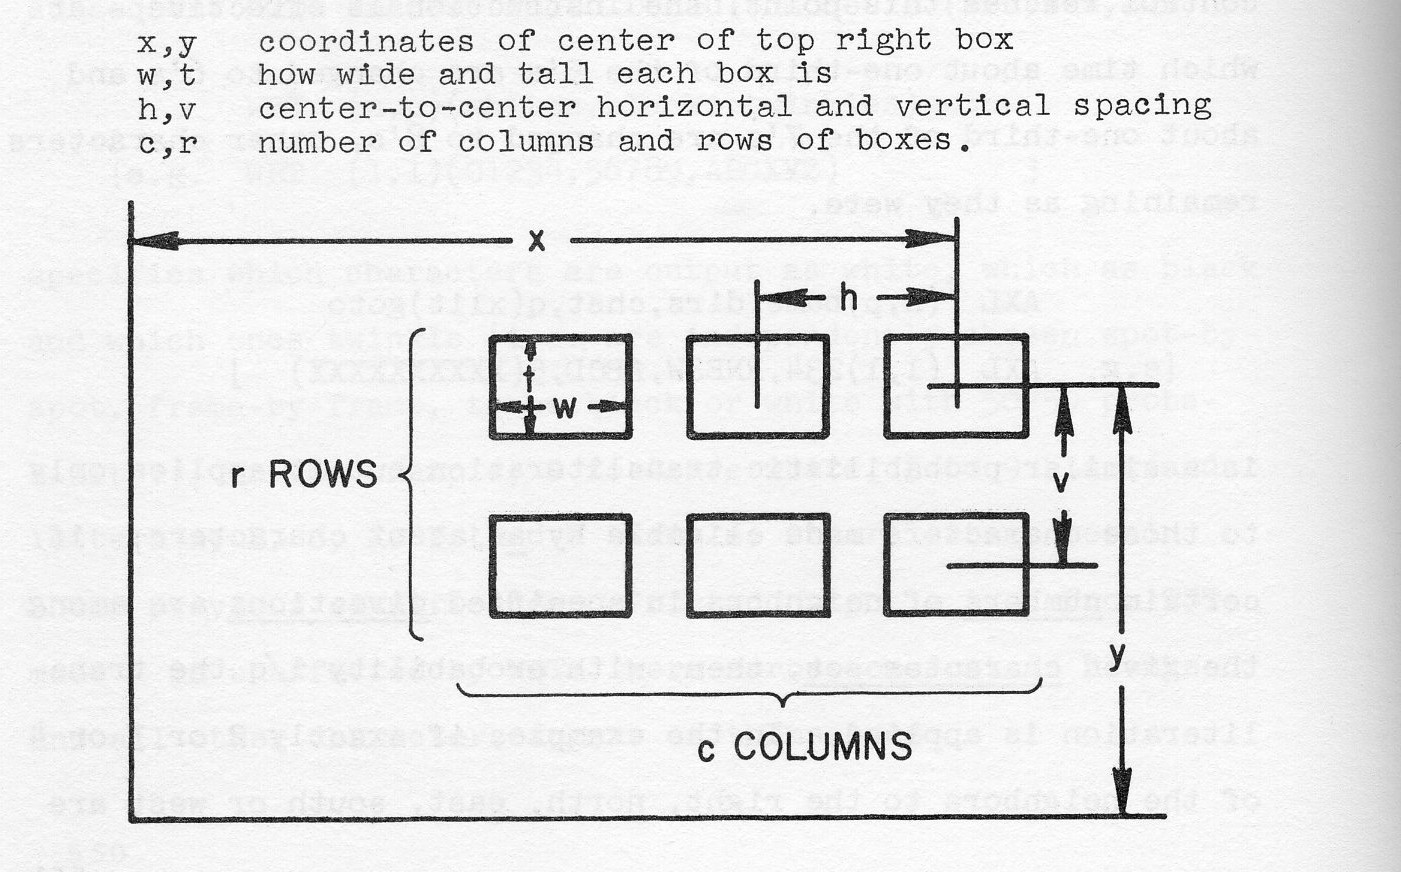
An additional parameter, pat is either the name of an explicit pattern prescribing exactly which boxes of such an array should in fact be treated, or if an integer, it is the reciprocal of the box-by-box probability of treating the box. If w > h and/or if t > v, boxes overlap; overlapped areas are multiply-transliterated. Parts of boxes or entire boxes wrap around if the mode is WRP, otherwise those parts or entire boxes falling outside the frame are ignored. The three instructions have B prefixed to the op code, thus:
BXL  (n,p)pat(x,y,w,t,h,v,c,r)q(xllt)goto
BAXL (n,p)pat(x,y,w,t,h,v,c,r)nums,dirs,chst,q(xlit)goto
BPXL (n,p)pat(x,y,w,t,h,v,c,r)dir,q(tpis)goto
Explicit patterns, specifying a subset of boxes of a rectangular array, are defined by 12-digit octal numbers, (one digit represents three boxes, a one-bit meaning treat the box). All patterns thus defined are multiples of 36 in width, leading zeros being optional. If the number of columns is more than 36, then two or more of the 12-digit numbers are taken to specify the top row of the pattern, the next group of numbers defines the next row, etc. Thus the pattern named TABLE, which may be taken as a side view of a long 85 × 4 table, is coded remotely (not in line) as follows:
TABLE  PAT 37777,777777777777,777777777776
       PAT 00000,200000000000,000000200000
       PAT 00000,200000000000,000000200000
       PAT 00000,200000000000,000000200000
A pattern may be picked up from the array and saved by the same pattern operation which gives the pattern a name and specifies x and y location of the square at the top right corner of the area:
SVP (n,p)name,x,y,width,height, goto
A pattern thus defined from the internal picture is the indicated height and a multiple of 36 wide (wide enough to accommodate the specified width): The pickup routine does not wrap around in picking up characters from the array. Characters picked up are translated according to the current WBT setting, white ones turning into one bits, black ones into zeros and twinkling ones are randomized and preserved as unchanging one or zero bits.
GOTO (n,p)goto
when operative, according to (n,p) simply causes control to pass to the indicated goto. Another transfer of control is conditional upon whether the first parameter is greater than, equal to, or less than the second:
IF (n,p)(parainm1,pred,param2)goto  pred = GT,EQ,LT
e.g.
IP (3,2}(SIZE,GT,16)LOC7
In the example, if according to (3,2) the test is operative and if the current value of the variable SIZE is greater than 16, then control goes to the instruction named LOC7. Gotos, clearly, are mandatory for GOTO and IP statements.
DO (n,p)subname,goto
causes the current instruction location to be stacked on a pushdown list and control to go to the subroutine whose first instruction has the indicated name. A subroutine normally terminates logically with the special goto DONE, which causes a pop from the pushdown to direct control so as to continue from beyond the call (to the goto of this instruction if there is one, otherwise to the next line).
Many instructions may be operated upon directly (the system is largely interpretive) or indirectly by changing values of parameters referenced. Table II contains a resume of all instructions; there doubly underlined parameters are character strings that may be changed directly by XLI instructions below, or pattern names changeable by CHP; and singly underlined parameters may be named variables which may be changed in value by CHV:
CHV  (n,p)param, change, val1,val2,goto [change = SET, ADD, SUB,MPY, DIV]
e.g.
CHV  (1,1)LNGTH, ADD, 5,15
sets the parameter to, or adds to it, or subtracts from it, or multiplies it by, or divides it by a value randomly chosen between val1 and val2, inclusive. In the example, the parameter LNGTH has added to it a number from 5 to 15. If no random selection is wanted, then only the desired number or parameter name need be given as val1, except that if there is a goto, then val2 must also appear (in this case redundantly) in order to preserve the appropriate parameter position for the goto. All parameters have value = 1 until changed by CHV. If a zero value occupies a probability position, p or q, it is taken to be 1.
CHP  (n,p)inst,newpat,goto
e.g.
CHP  (1,1)LINE9,PAT7
causes a change in the named pattern of a BXL, BAXL or BPXL instruction.
XLI  (n,p)name,part,q(xlit)goto
e.g.
XLI  (1,1)LINE5,DIRS,1(NR,RE,EB,BS,SL,LW,WA,AN)
literally transliterates characters of a part of many kinds of instructions, according to the part specified:
NUMS      the numbers of AXL or BAXL
DIRS,DIR  the direction(s) of AXL, BAXL, PXL, or BPXL
CHST      the character set of AXL or BAXL
XLIT      the transliteration of XL, AXL, BXL, or BAXL
WBTS      the character strings of a WBT instruction
TPLS      the triples of PXL or BPXL
In the example, the instruction named LINE5 has its named directions changed, each to the next most clockwise direction.
In considering transliteration of instructions by XLI, all character strings may be considered to be stored literally as originally written until later changed; the only characters accessible to change are the digits and letters originally or subsequently appearing. Therefore, some foresight is often necessary if XLI is to be used, for example in providing dummy directions such as X, Y and Z which are ineffective until these characters are transliterated into meaningful directions.
Highlighted parameters may be given explicitly as integers, or as named variables. Gotos are optional except for TEST and GOTO. Doubly underlined parameters may be changed by instruction-modification instructions CHP or XLI.
             for picture output
MODE   (n,p)(list)goto   [WRP vs PLN, RUN vs TST, SQR vs HEX]
WBT    (n,p)(whites,blacks,twinkles)goto
CAMERA (n,p)frames,goto
             for changing the array
XL     (n,p)q(xlit)goto
AXL    (n,p)nums,dirs,chst,q(xlit)goto
PXL    (n,p)dir,q(tpls)goto
BXL    (n,p)pat(x,y,w,t,h,v,c,r)q(xlit)goto
BAXL   (n,p)pat(x,y,w,t,h,v,c,r)nums,dirs,chst,q(xlit)goto
BPXL   (n,p)pat(x,y,w,t,h,v,c,r)dir,q(tpls)goto
            for defining patterns
SVP    (n,p)name,x,y,width,height,goto
PAT    list-of-octal-numbers
            for flow of control
DO     (n,p)sub,goto
GOTO   (n,p)goto
TEST   (n,p)(param1,pred,param2)goto  [GT,EQ,LT]
            for instruction modification
CHV    (n,p)param,change,val1,val2,goto  [change= SET,ADD,SUB,MPY,DIV]
CHP    (n,p)inst,newpat,goto  [for BXL,BAXL or PXL]
XLI    (n,p)name,part,q(xlit)goto   [part= NUMS,DIR(S),CHST,XLIT,WBTS,TPLS]
The flexibility of the language will be demonstrated, and some of its uses illustrated, by eight examples of programs and their pictorial results. These appear together in sets in Figures 1 through 8. The program presented in each case is assumed to be preceded by the initialization
MODE  (1,1)(RUN, WRP, SQR)
WBT   (1,1)(ABCD,0123,WXYZ)
XL    (1,1)1(0...)
which, unless explicitly countermanded by other instructions listed, establishes the ground rules for mode and output, and clears the entire surface to black. Each listed program is assumed to be followed simply by a command to output one frame:
CAMERA (1,1)1
In each case, there is one variable with two alternative values: the upper one causes the left-hand set of outputs, the lower the right-hand set. Another variable shows three alternatives which yield the top, middle and bottom pictures, respectively. In all but the last example, the latter set indicate the interruption of an iterative process after different numbers of iterations.
The first example (Fig. l) is related to crystallization, etching, annealing, and nucleation on a substrate (i.e. simultaneous environment-dependent sublimation and crystallization) [1]. The computation starts with either 1/2 or 1/3 white spots (A's) on a black background (0's). The program then agitates by turning black (A's to 2's) one-sixth of the white spots above, below, right of or left of black ones, and then turns white (C's) one-sixth of the black spots next to white ones. (Next for computational purposes, all blacks are recoded as 0's and whites as A's). Then the program coalesces by turning white the black spots with predominantly white neighborhoods (i.e., where 3 or 4 of the 4 orthogonally adjacent spots are white), and by likewise turning black the white spots in predominantly black neighborhoods. The process iterates, performing the coalescing operation twice after each agitation.
Other potential uses of EXPLOR are the generation of highly detailed patterns for experiments on vision [2], and simulation of some of the visual phosphenes, such as squirming checkerboards or fringe patterns, which a person sees when he closes his eyes and presses upon them.
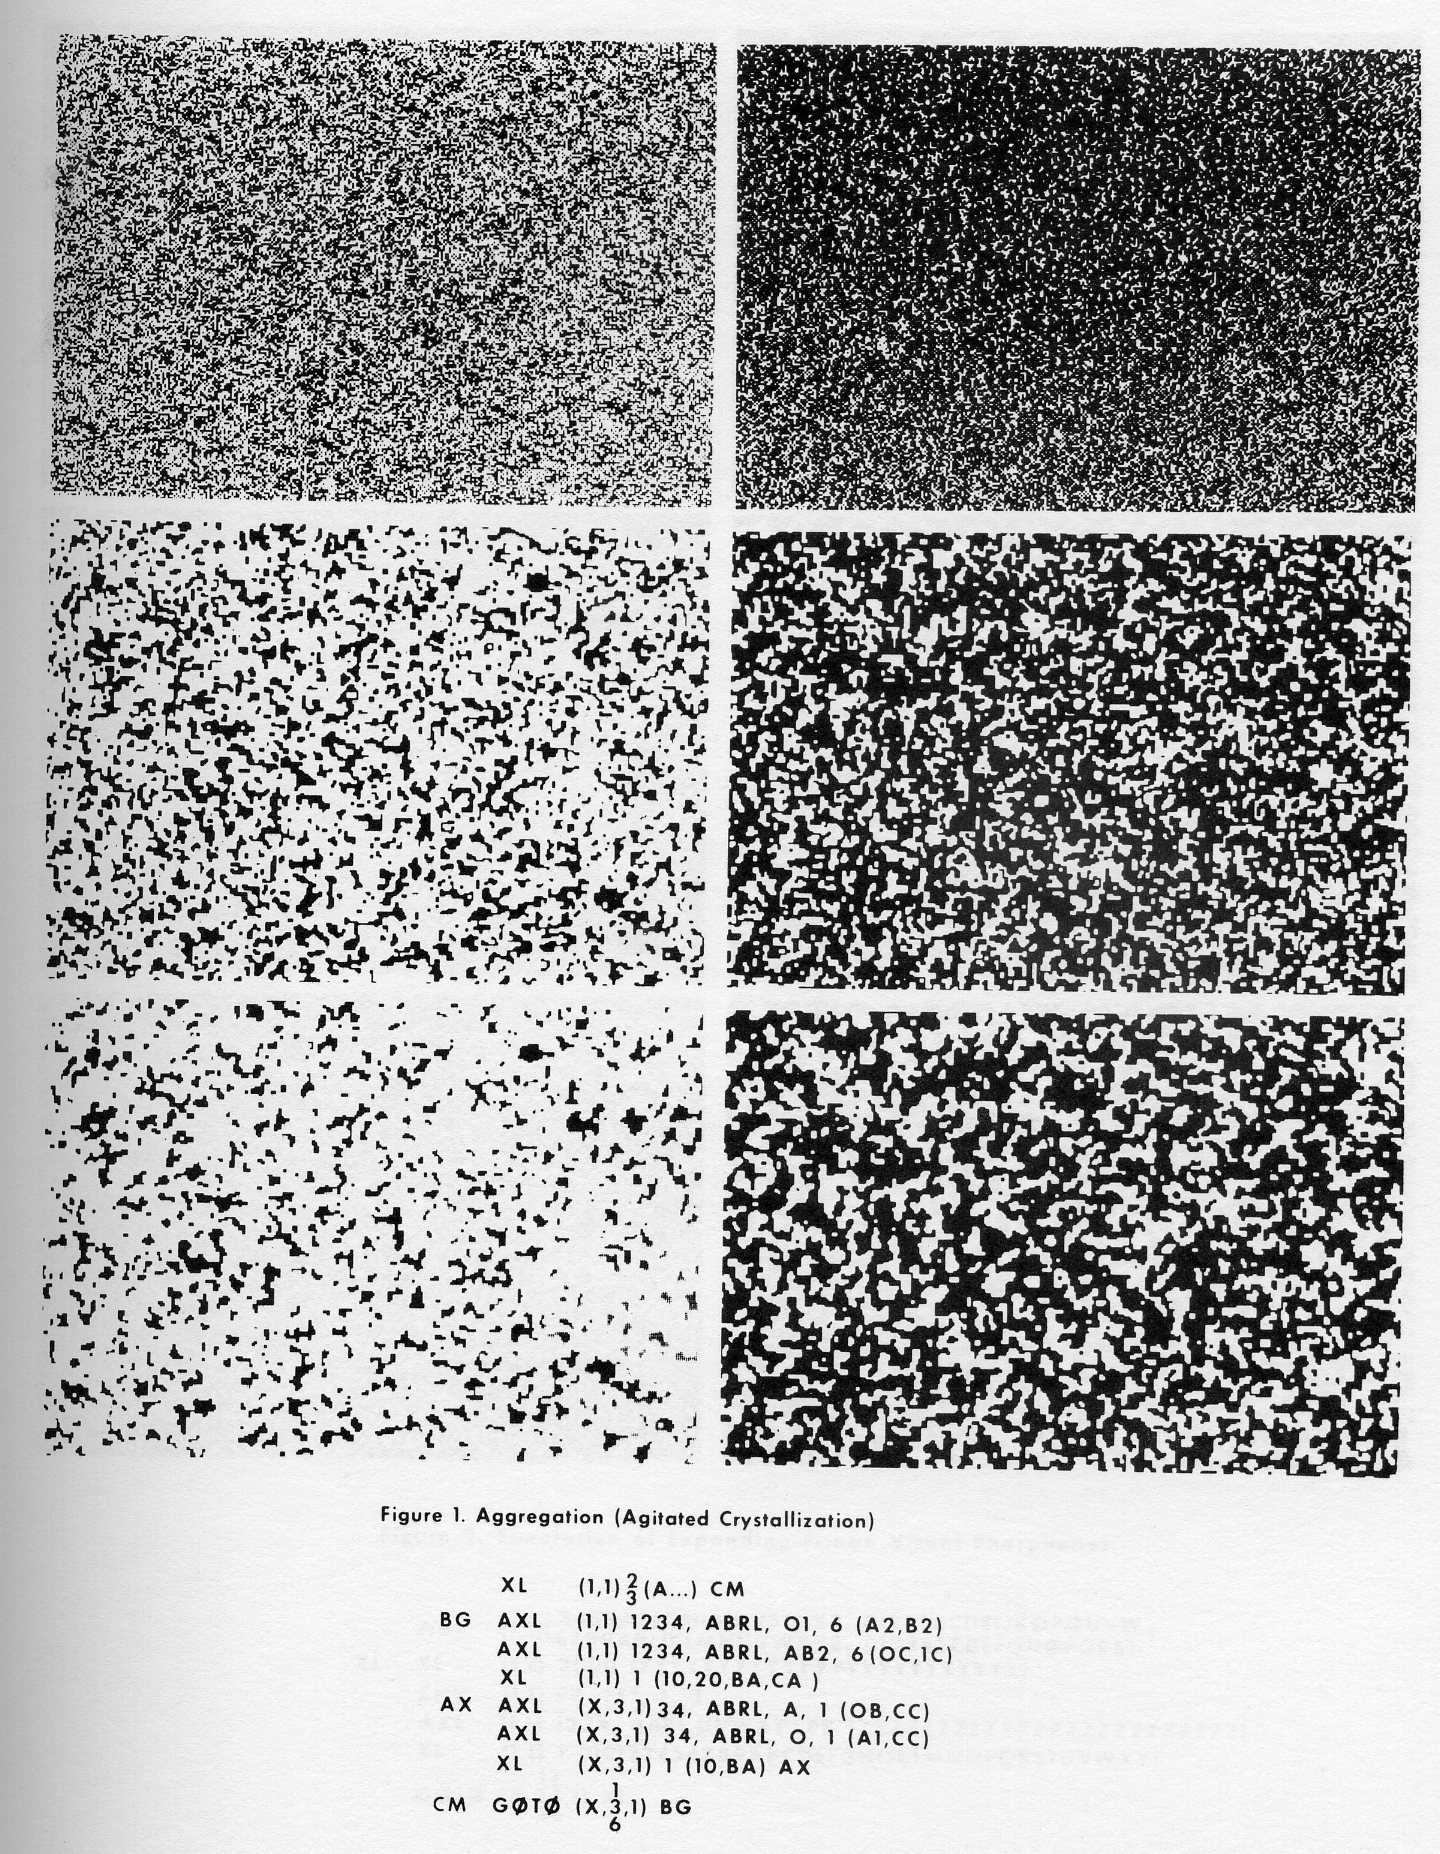
Figure 2 shows a program for generating expanding fringes from randomly placed nuclei (Y's). The area around a nucleus expands at each step to include all of, or half of, or one-third of the adjacent spots, this probability being chosen at random for each iteration. Each spot progresses backward through the alphabet as it ages, according to the transliteration (00123456789ABCDEFGHIJKIMN0PQRSTITVWXY). Spots represented by N, and older ones, are eligible, with 1/3000 probability, to become new nuclei for expanding fringes. The left-hand and right-hand outputs show fringes which are three and six iterations thick, respectively.
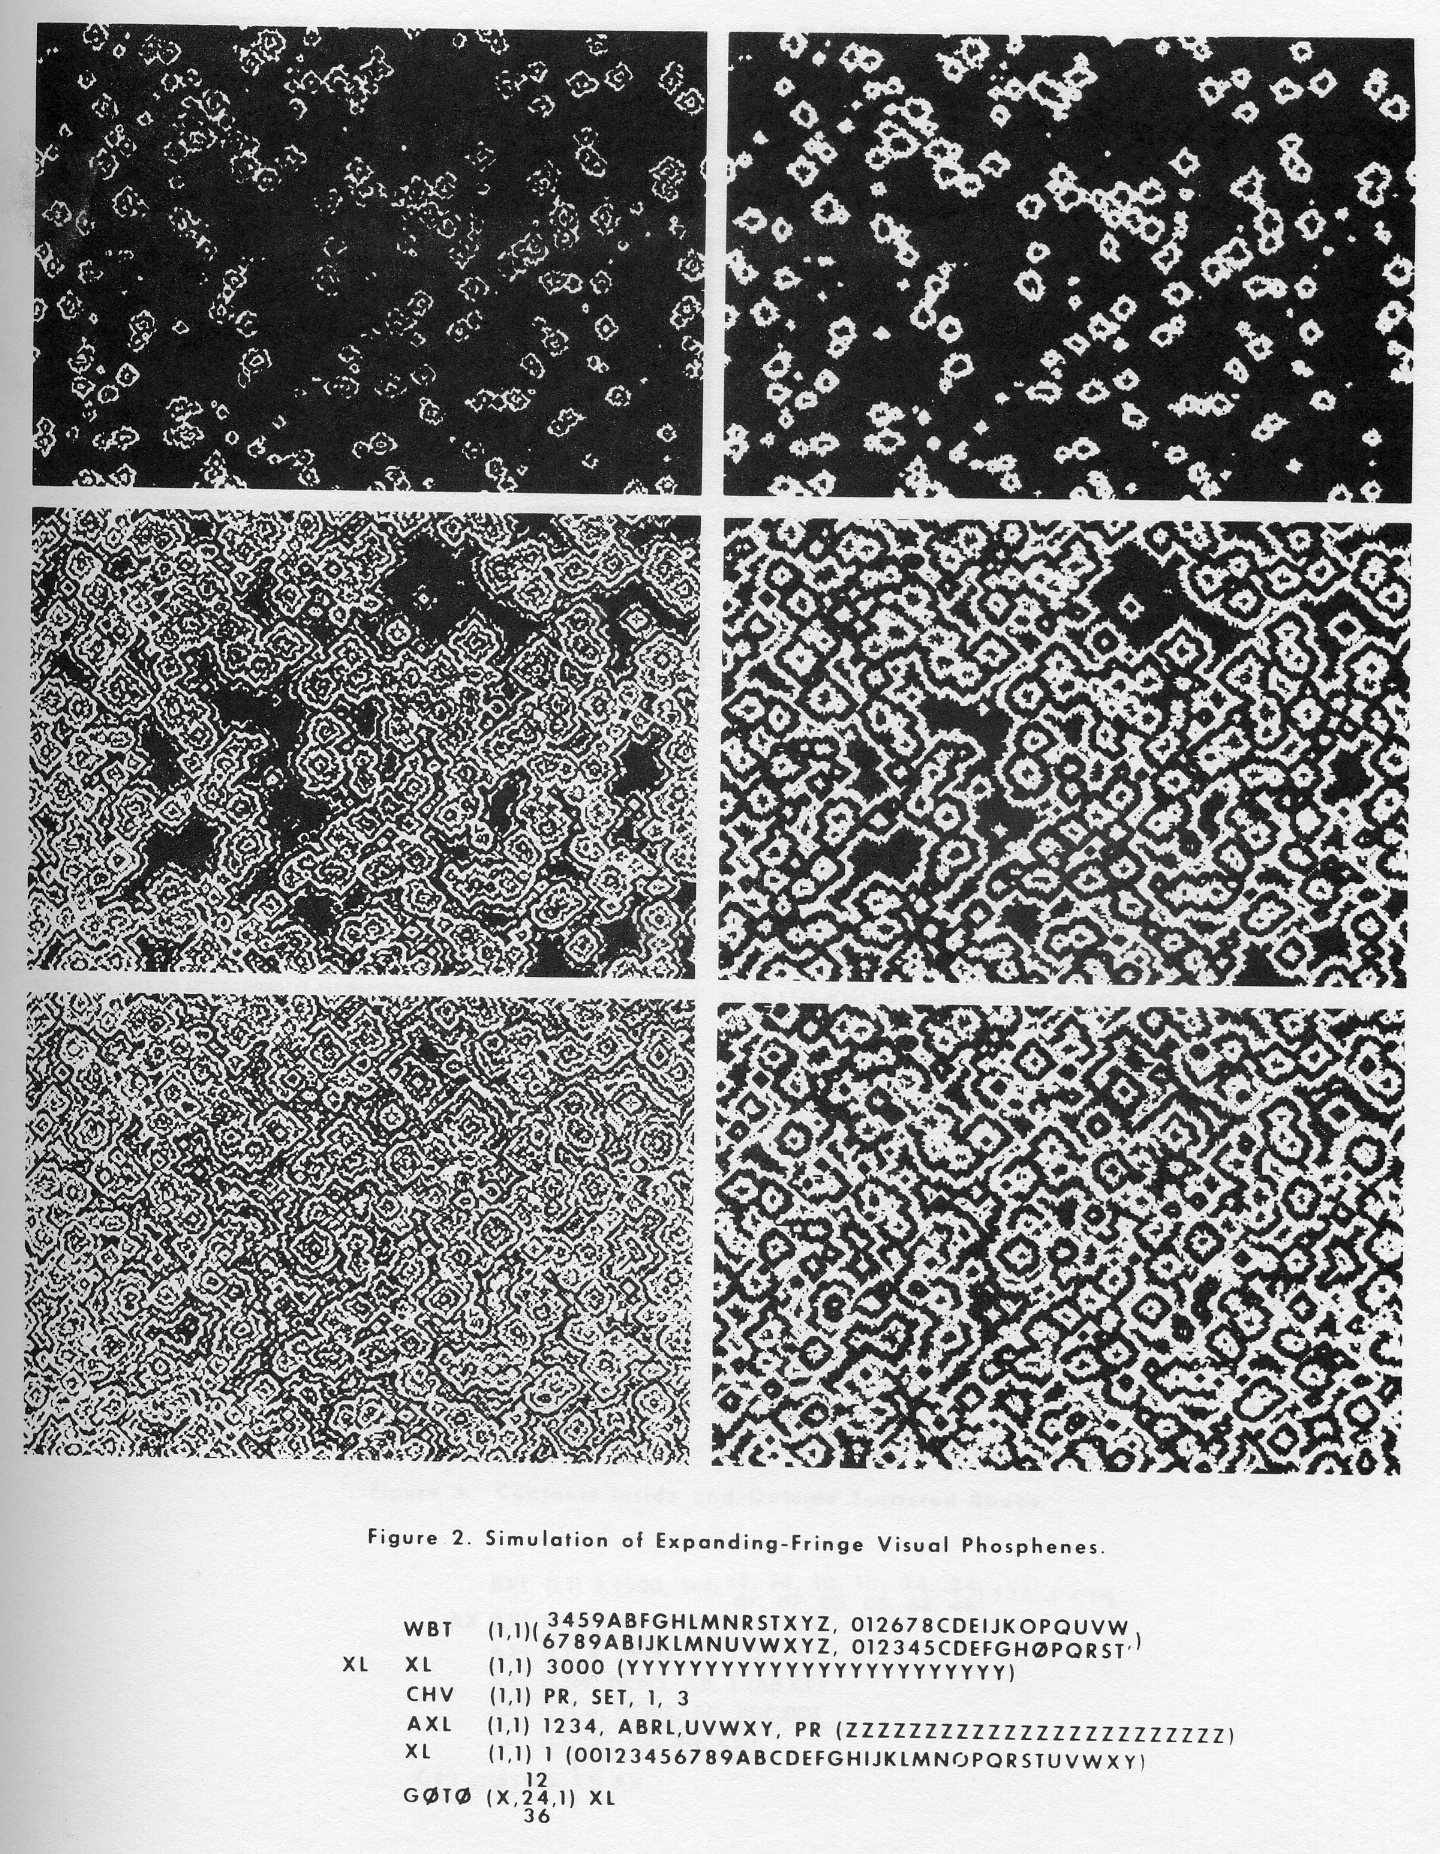
Figure 3 simply illustrates the production of interesting designs by starting with a probabilistic selection from an array of overlapping boxes. Into solid black areas, white and black layers are successively defined; into white areas the converse.
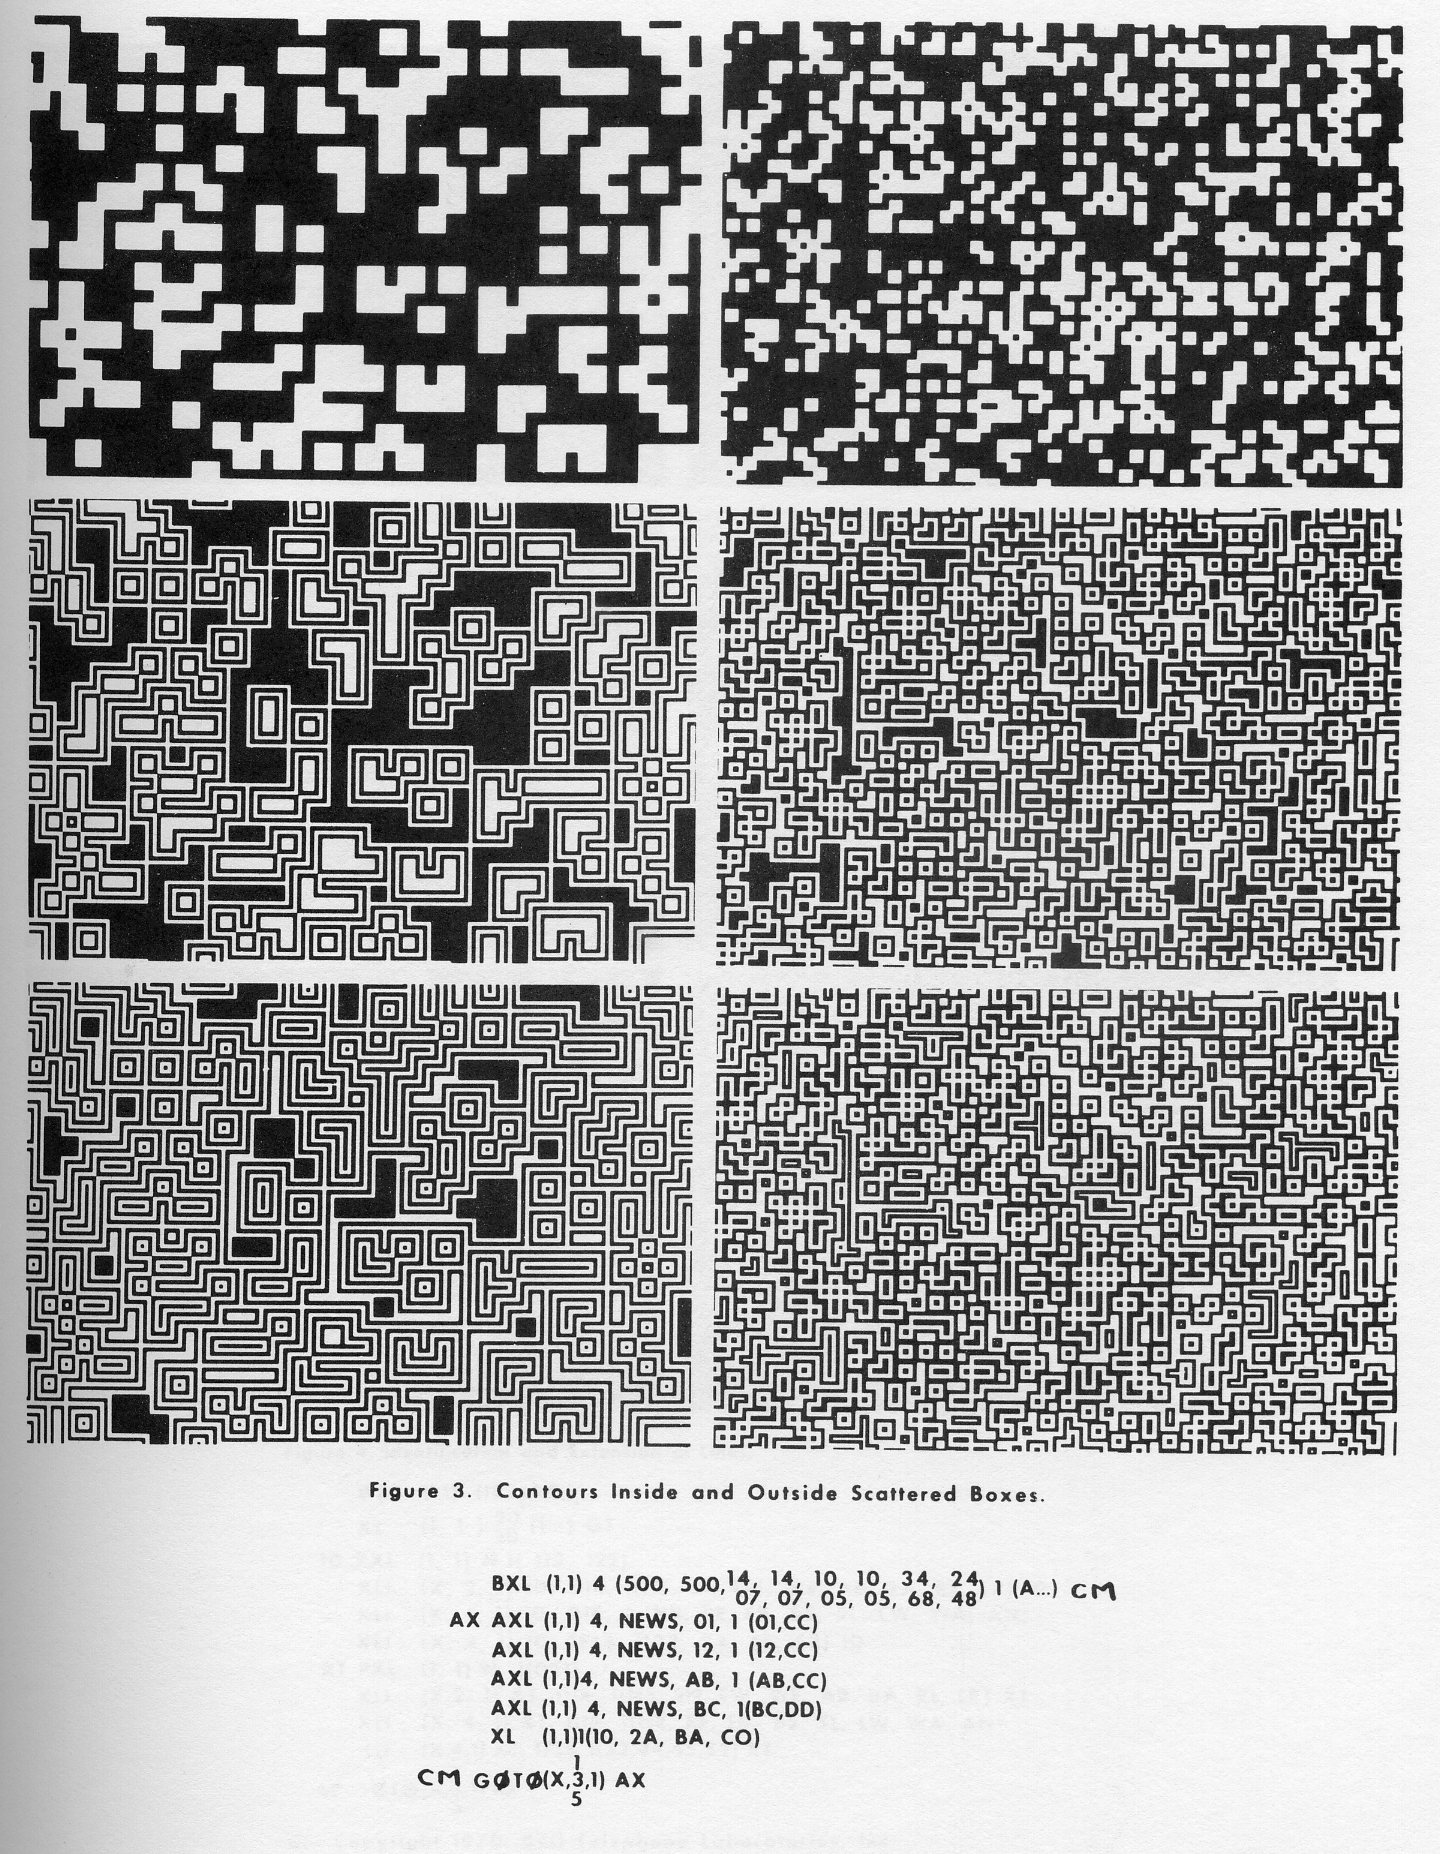
The example of Fig. 4 is related to picture processing; it demonstrates the use of the PXL instruction in identification of and extension of short line segments [4]. Starting with a scattering of 1/10 or 1/20 white (1's in this case) on black, the first PXL instruction changes 1's with 1's (or 2's) north of them to 2's. The result is that any north-south diagonal lines, except for the north end, are changed to 2's. The next instruction flips the direction in the PXL in order to catch the unchanged end. The following two instructions change the direction, by 4-5° clockwise, of the line treated and transliterate the triples of the PXL so that horizontal lines get changed to 3's, east-west lines to 4's and vertical lines to 5's. Whereas the first PXL and the three following XLI's serve to identify endpoints of the 4 orientations of lines, the second PXL and its following XLI's serve, in similar manner, to extend the line segments one unit.
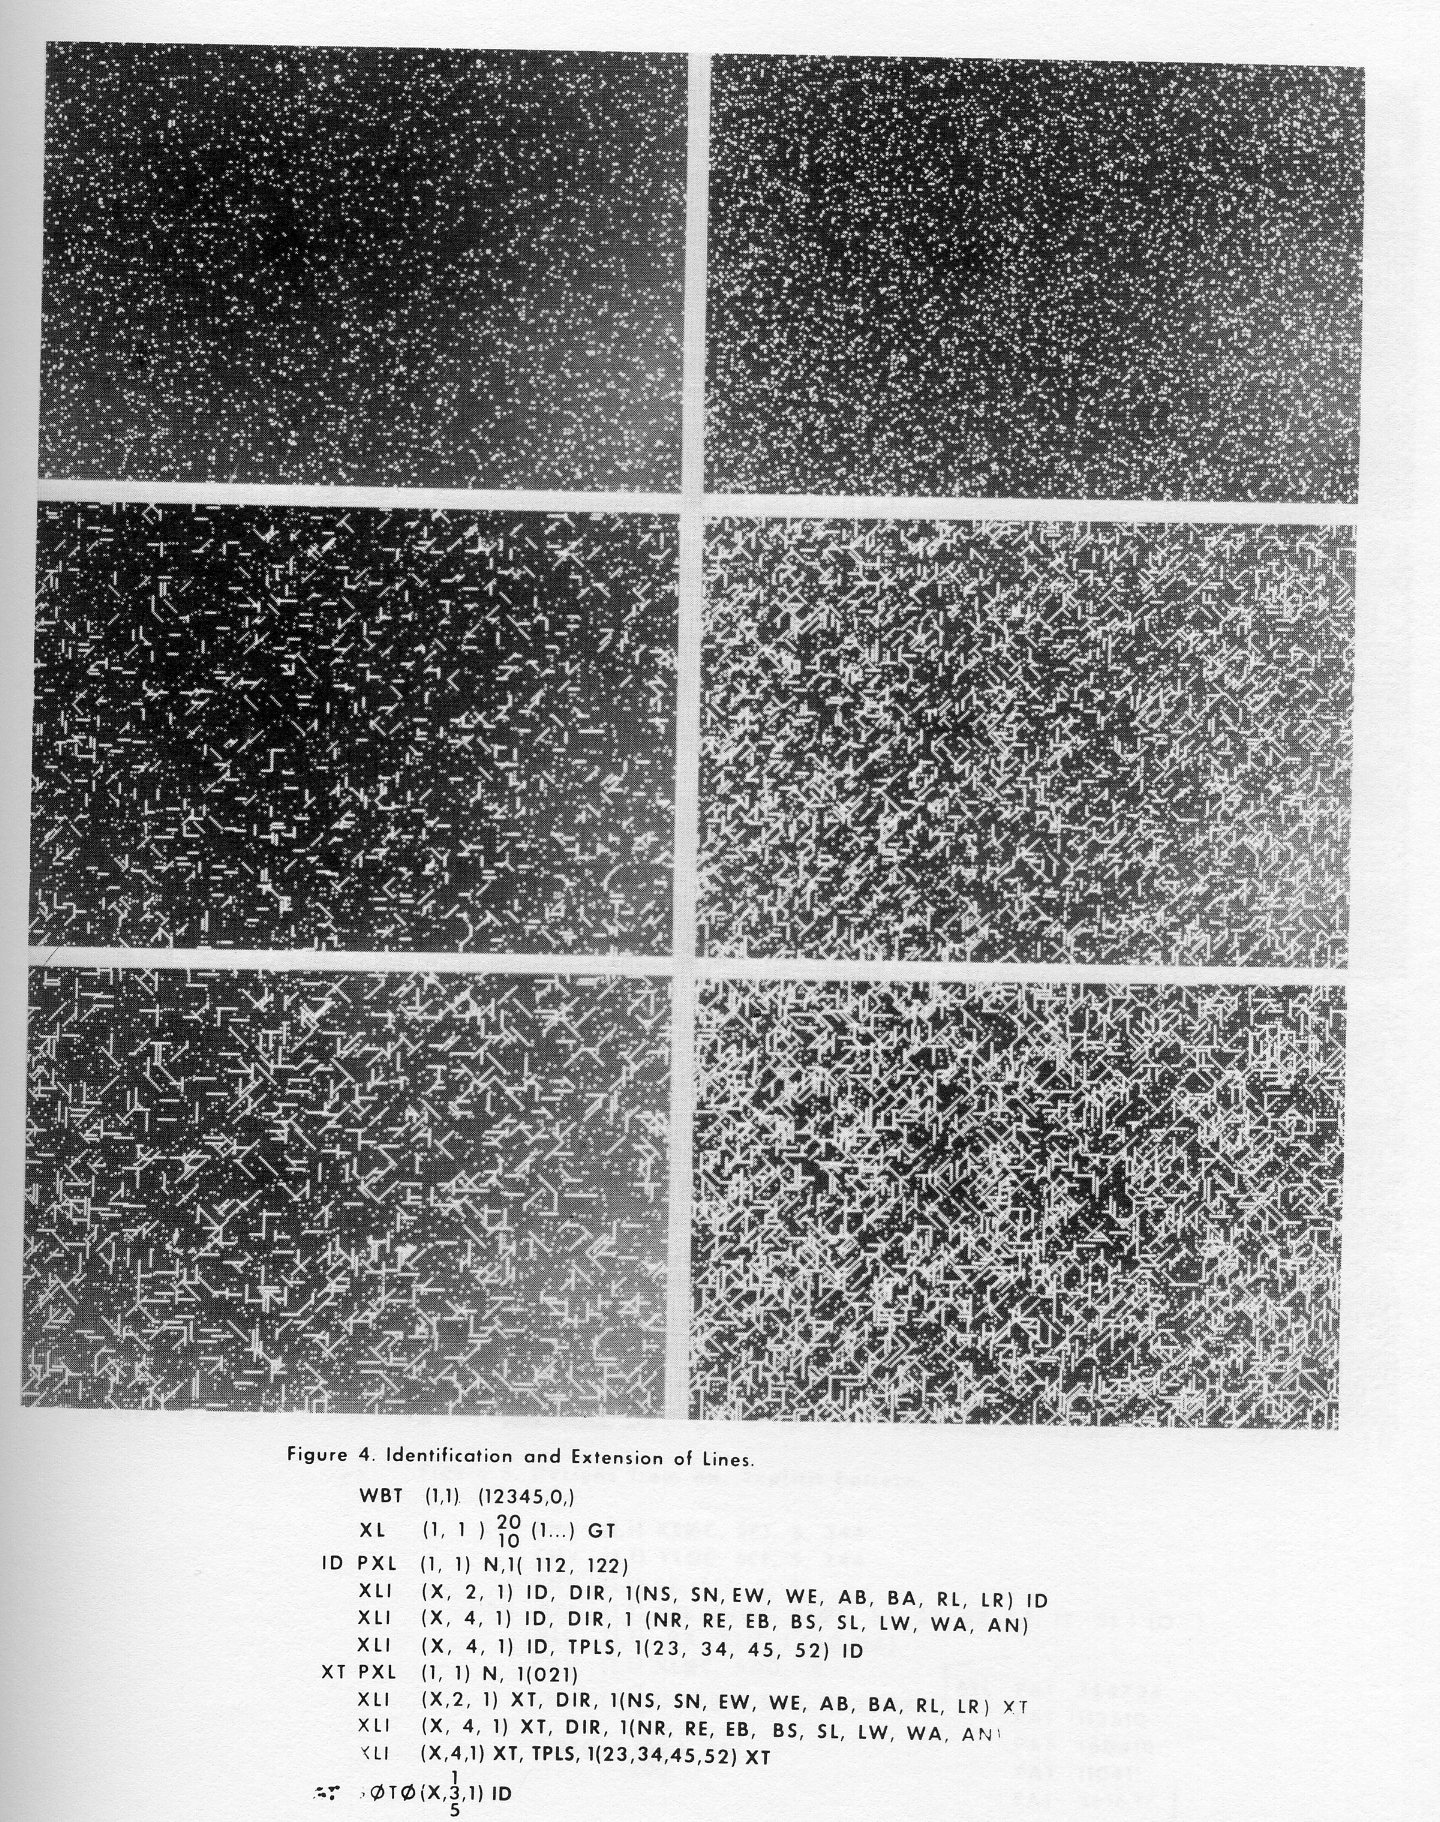
Figure 5 illustrates the production of designs based on an explicitly defined pattern, in this case the letters BTL. Each time the pattern is laid down., an x-y location is chosen at random, also a size from 2 to 5. The pattern is first written in 0's, then displaced downward and to the right and written in A's. In the left-hand outputs only one black-white pair is written each time; in the right hand set, four successively displaced black-white pairs are overlaid each time.
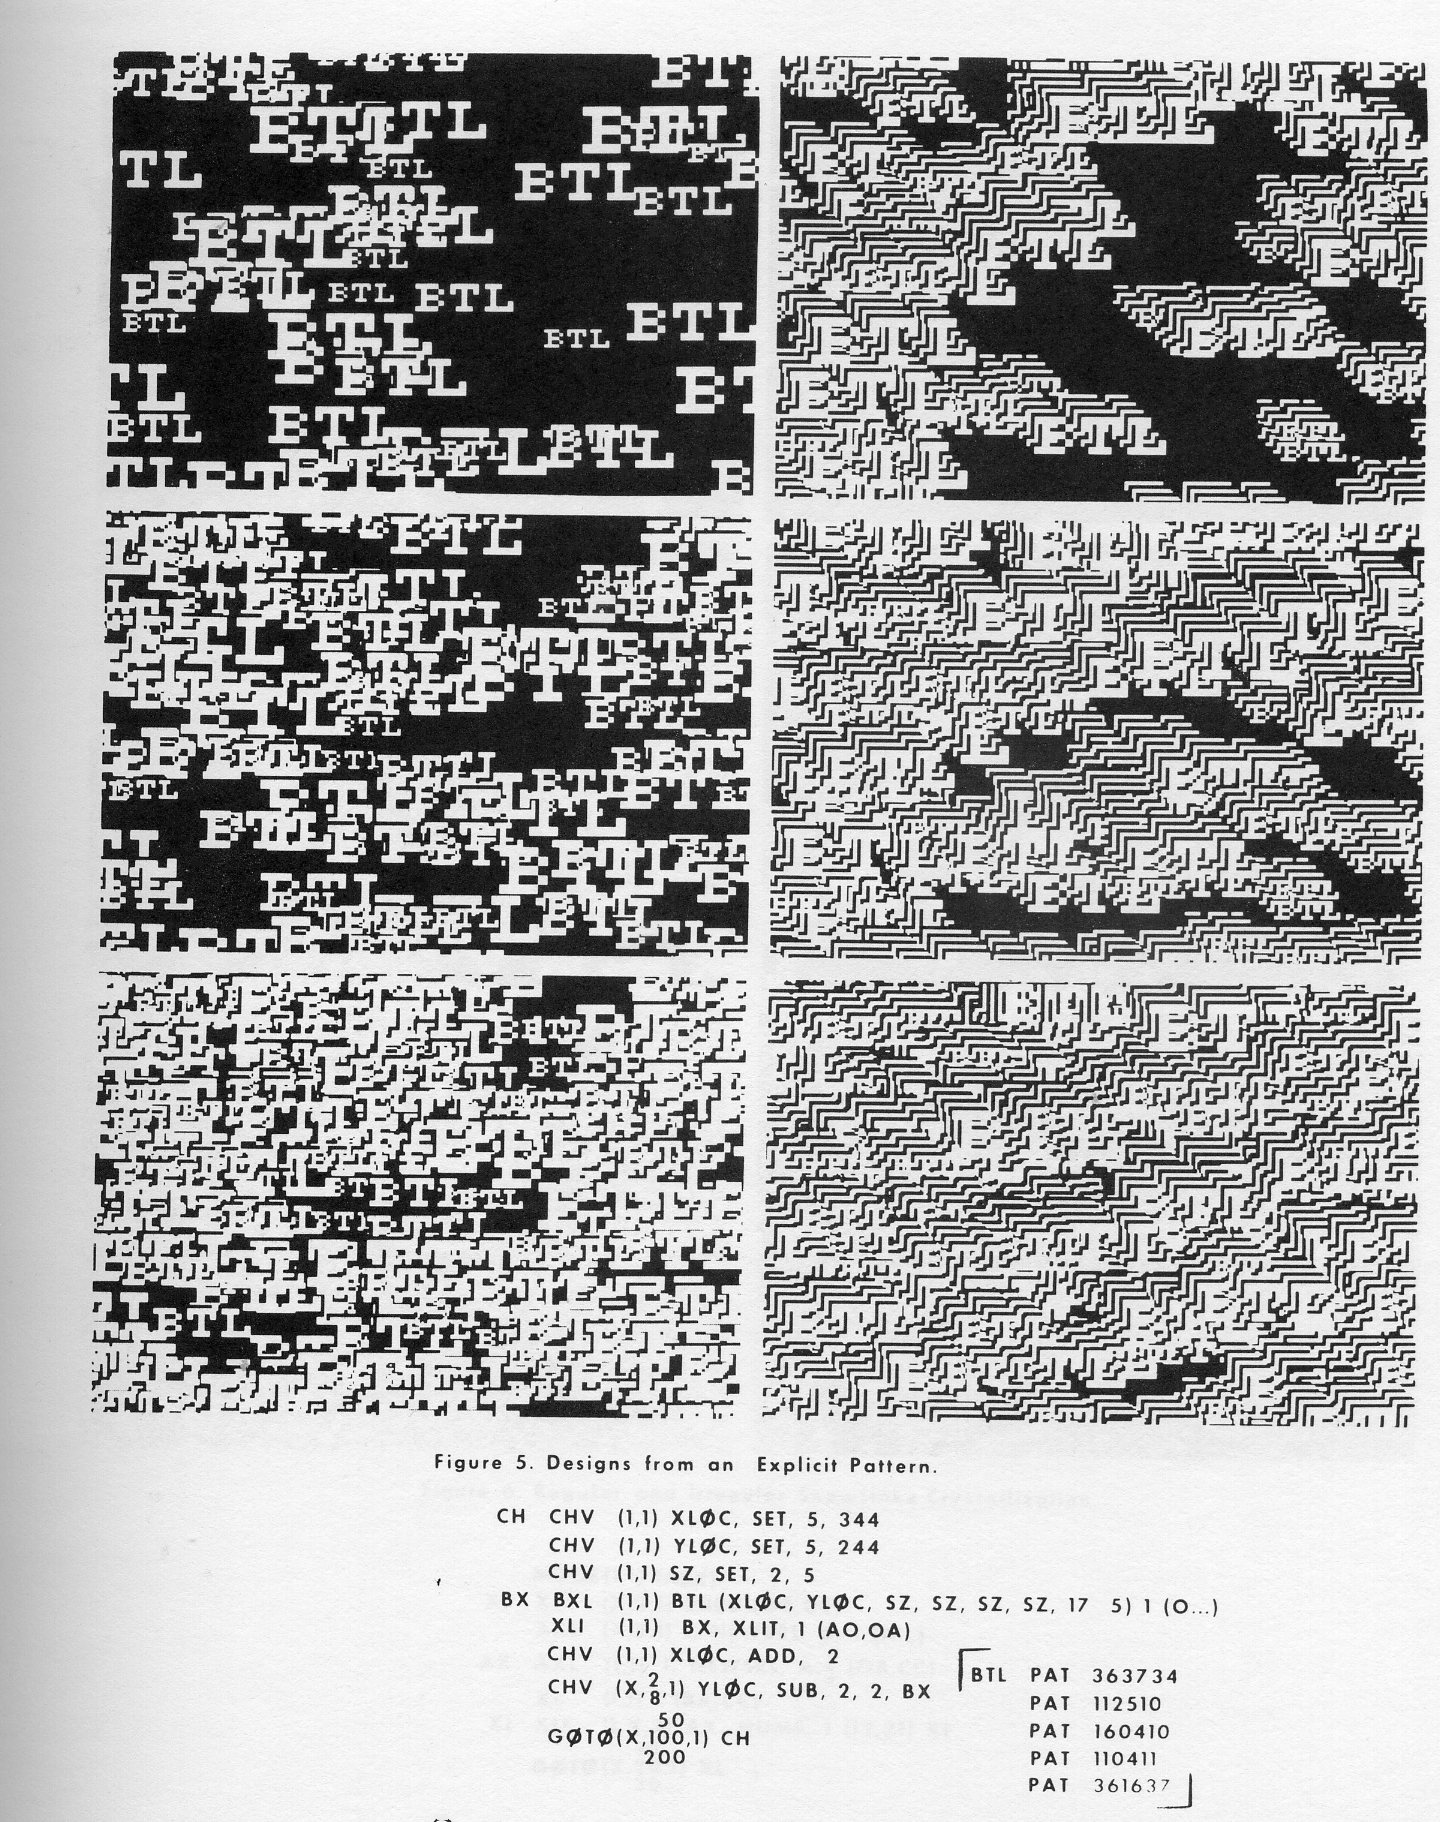
Figure 6 demonstrates computation and output for the hexagonal mode, used here for simulation of snowflake crystallization. Each snowflake starts from a nucleus of a B totally surrounded by A's; growth is either regular or probabilistic, and into spots adjacent to either one or two crystallized spots, the latter choice being determined at random each time through the loop.
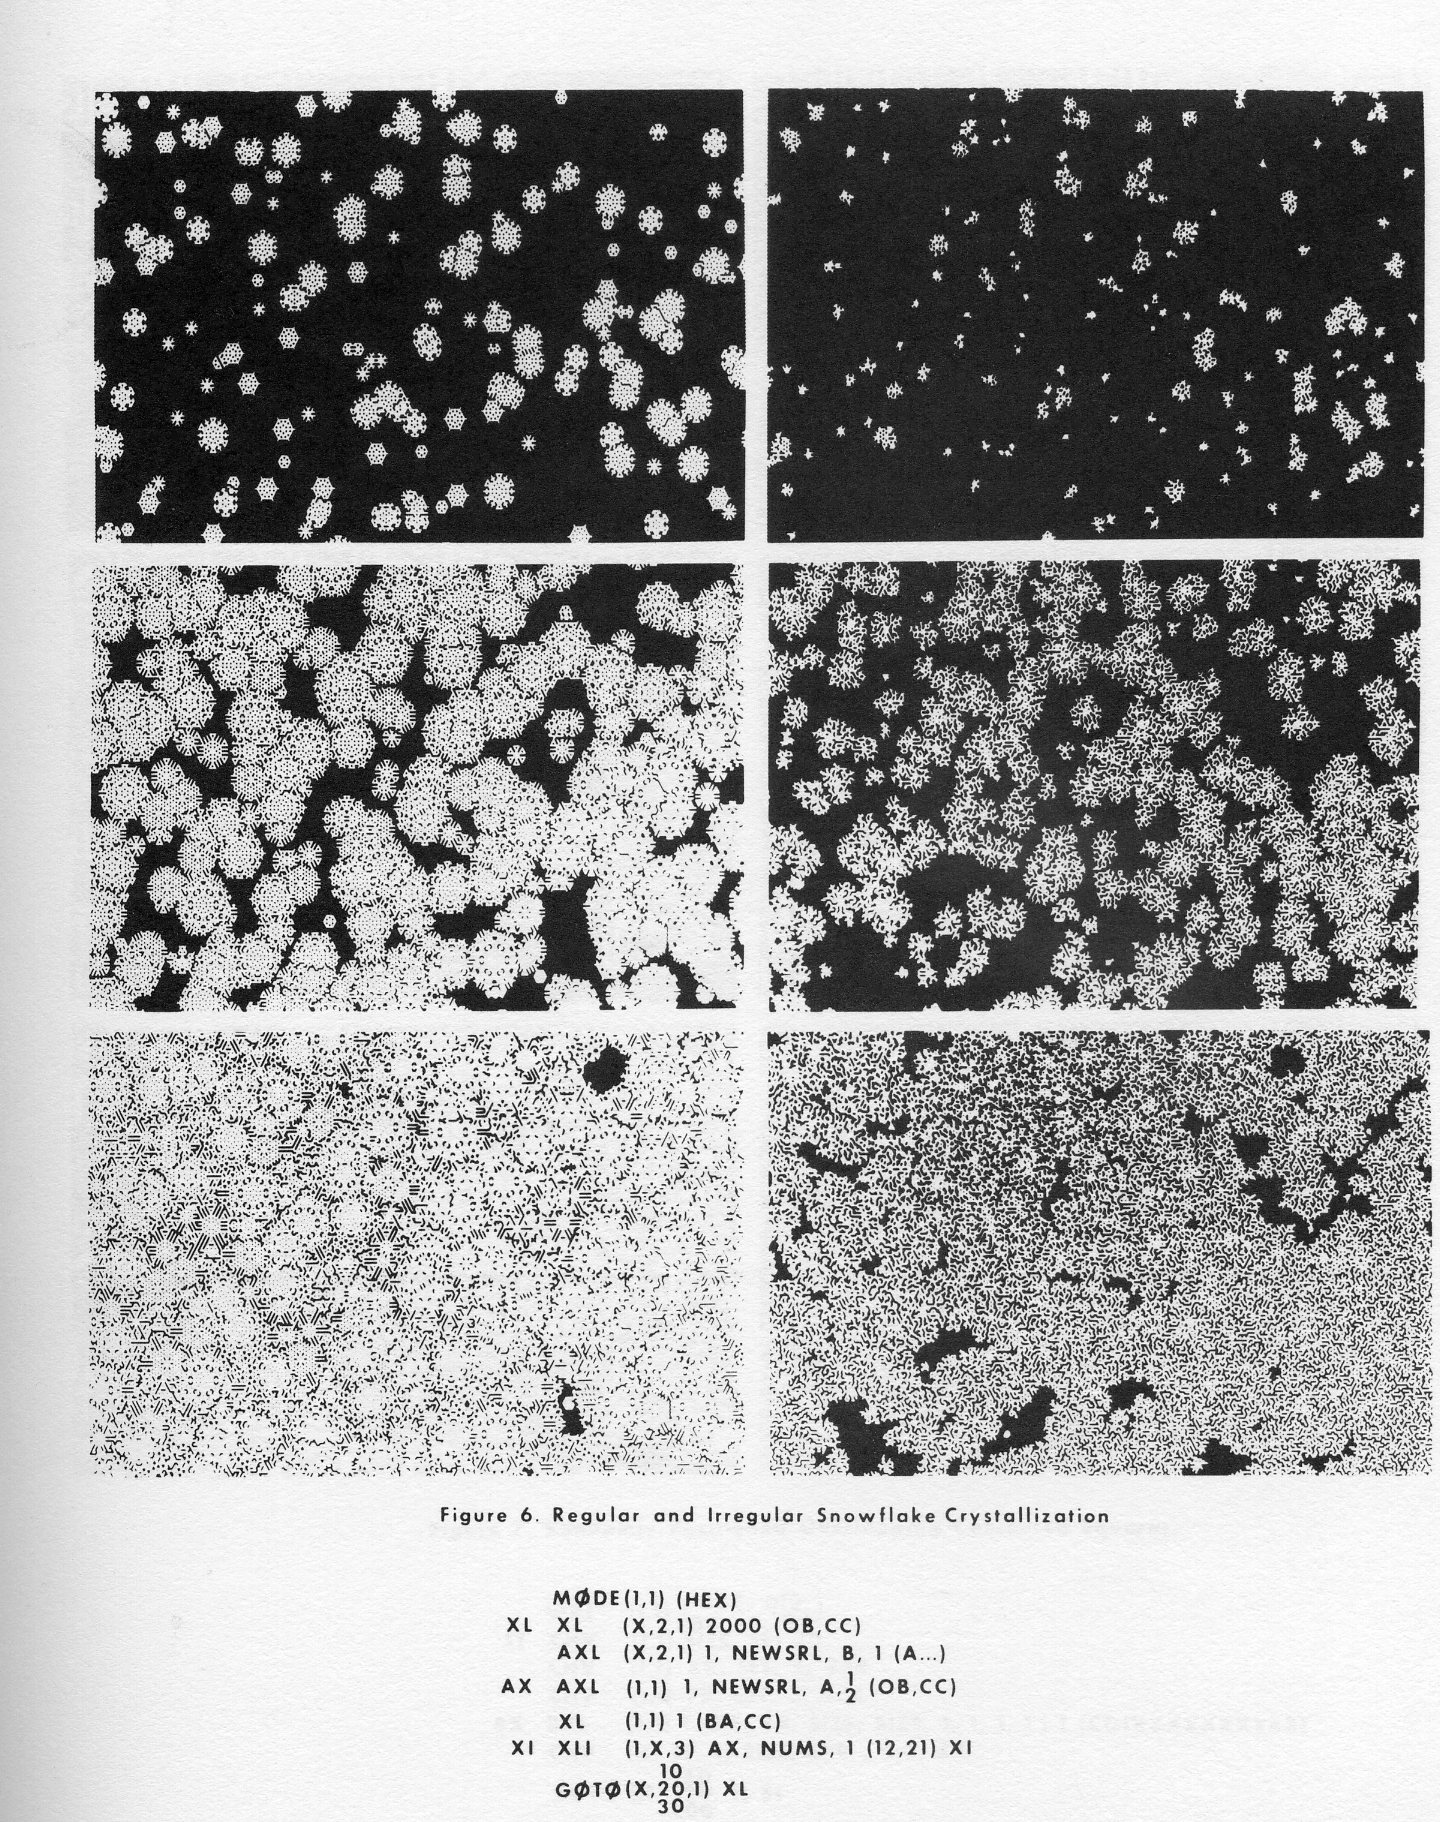
Figure 7 shows further artistic effects obtained by cyclic transliteration of randomly positioned sets of squares within squares. Where sets overlap, more complicated and subtle patterns emerge. The left-hand illustrations are similar to scenes from a film produced largely by the BXPLOR system [5]; the right-hand illustrations demonstrate the use of twinkling spots in outputs.
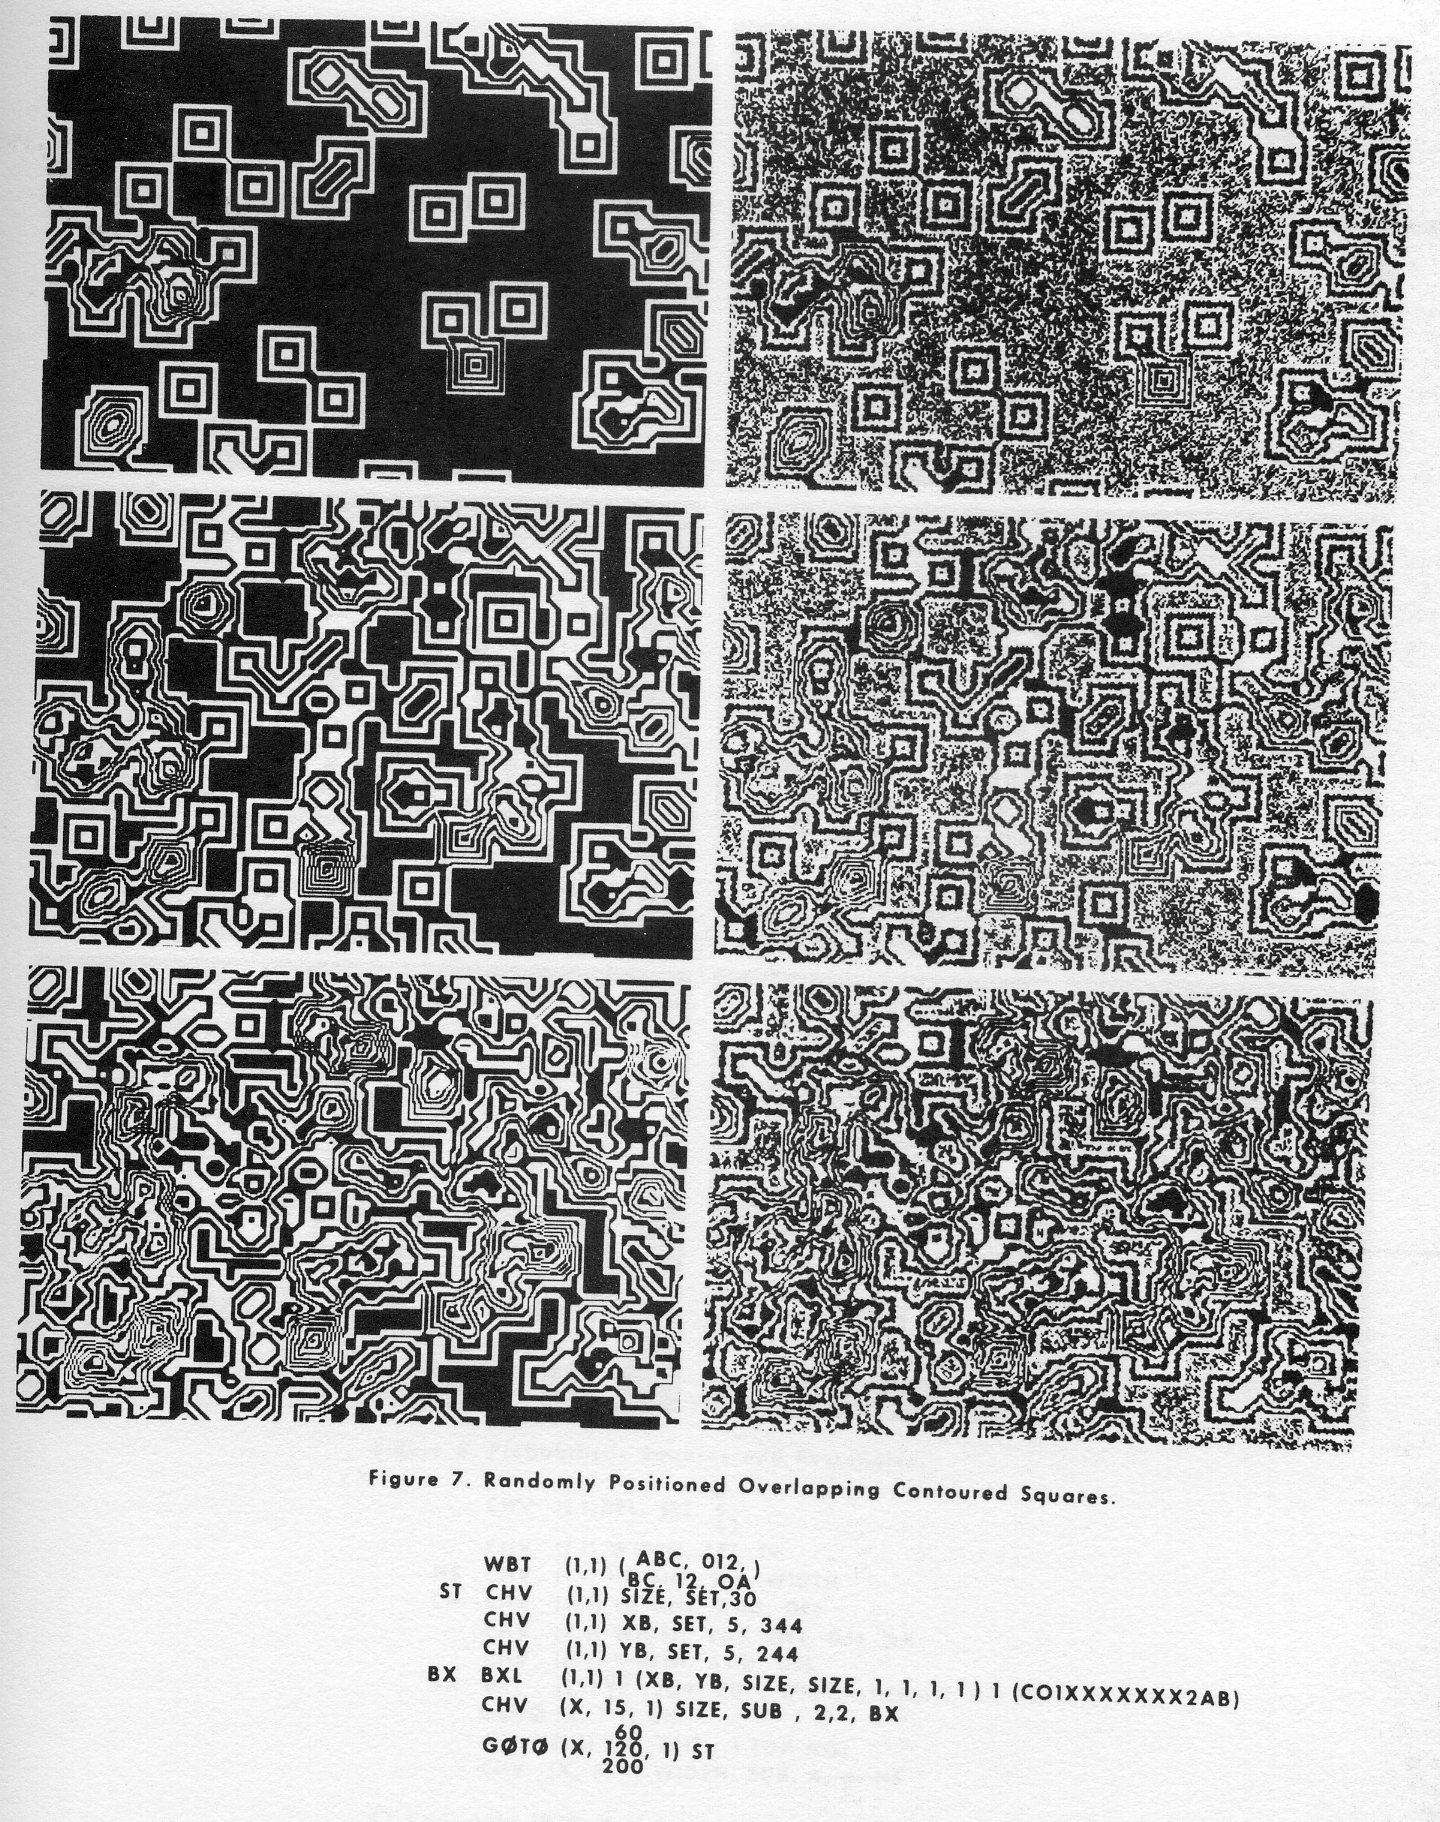
The last example, Fig. 8, is another demonstration of artistic effects, generated here simply as a probabilistic collection of squares and rectangles. The forms are drawn in five successively smaller sizes, alternating between black and white.
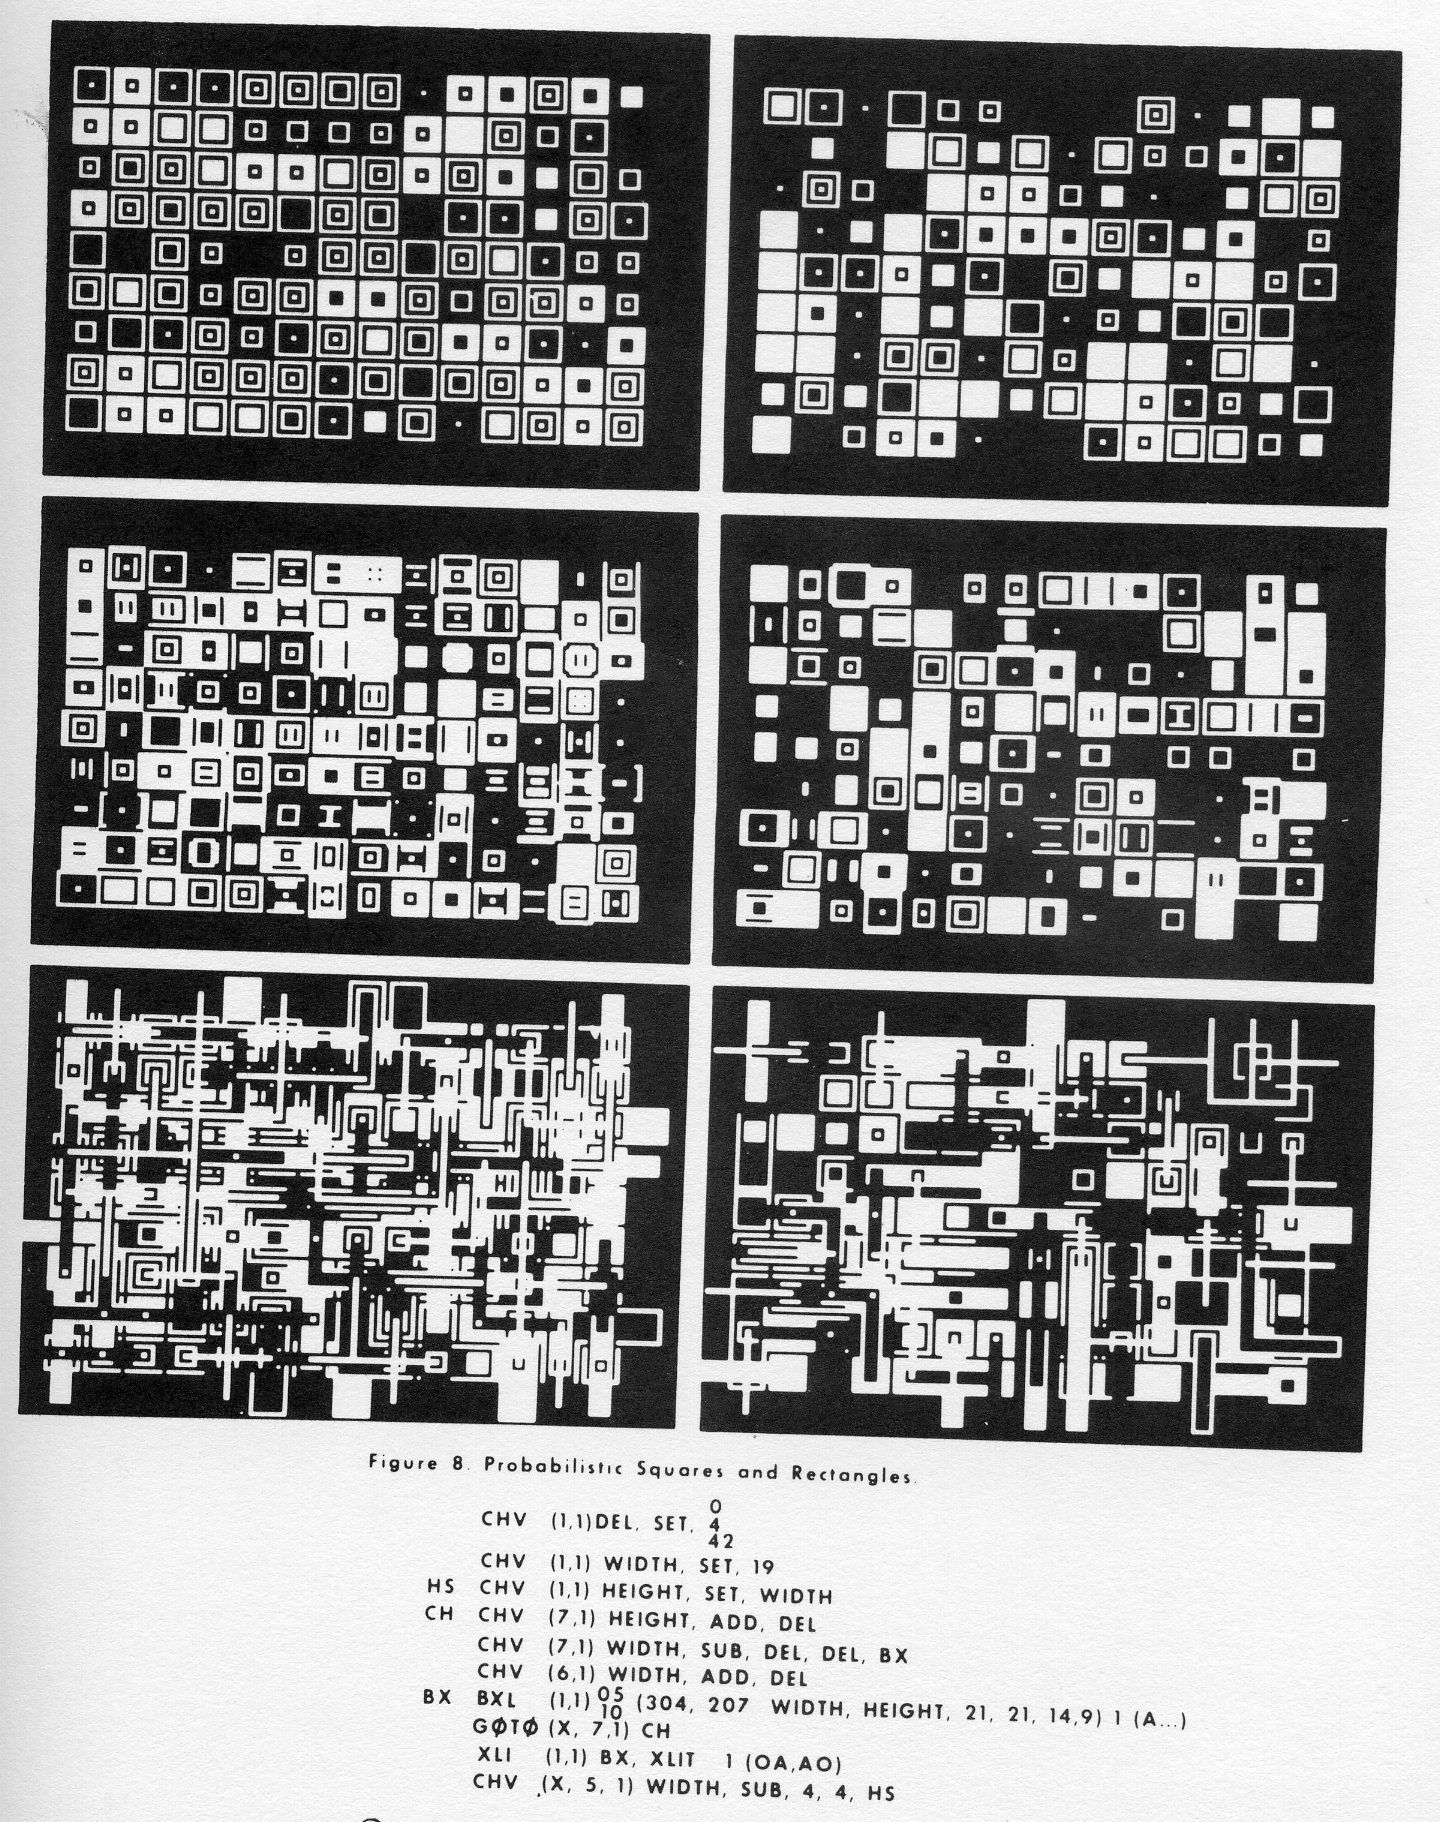
The prototype version of EXPLOR was implemented, because of historical reasons, in BE-FAP [6] on an IBM 360/50 emulating an IBM 7094 (with hardware-implemented convert instructions); it occupies 420008 locations, which includes the internal picture storage. The output device is a Stromberg DatagraphiX 4060, using a 4020 simulator modified in the following ways: right and left margins were extended giving an effective raster of 1024 × 1366; the period is output as the largest plotting dot, and character spacing in typewriter mode is changed to four 4020 units.
Additional facilities, and also restrictions, implied by these circumstances are discussed in the following paragraphs
All of the conventions of Bell Labs macro FAP apply as concerns instruction names and gotos, blanks, op code and argument positions, continuations on next card, comments, and macro-extension of the language. Variables are restricted to positive integers from 0 to 32767. Furthermore, there are limitations on character strings and numbers of arguments as follows:
The order of computation on the internally stored picture is as follows: for the sake of speed, an entire machine word (6 characters) is treated simultaneously; changes within a word do not alter the effective environment of other characters in that word. Effects can, however, propagate from word to word: order of computation within a box (or the whole frame) is bottom line first, left to right. The order of treating boxes of an array is top line first, right to left.
Actually measured run times for various operations and circumstances are as follows:
For boxed-array operations (BXL, BAXL, and BPXL) figures given for (b) and (c) decrease in proportion to the area treated; for test mode operation, all times are cut by a factor of ten because only a small part of the surface is computed.
All other operations are essentially preparatory the time which they consume is insignificant compared with those given above.
The EXPLOR system is a convenient, versatile, and efficient system for generating scientific and educational as well as artistic displays. All pictures generated derive from explicitly defined patterns, local operations and randomness.
The system has unique facilities for specifying periodic and/or random application of its operations, and flexible means of specifying uniform or locality-dependent translation of internal symbols.
The current version has a particularly fast-running scheme for spot-by-spot randomization; in this and most other respects it should serve as a good model for other implementations.
1. A. J. W. Moore, Nucleation of Solids from the Vapor Phase, J. of Australian Inst. of Metals II, No. 4, pp. 220-226, (November 1966).
2. B. Julesz, Computers, Patterns, and Depth Perception, Bell Laboratories Record 44, No. 8, pp. 261-26? (September 1966).
3. G. Oster, Phosphenes, Sci. Am. 222, No. 2, pp. 83-8? (February 1970).
4. L. G. Roberts, Machine Perception of Three-Dimensional Solids, Technical Report No. 315, M.I.T. Lincoln Laboratory, Lexington, Mass., (May 1963).
5. Pixillation, a 5 min. color, 16 mm film by Lillian Schwartz and Ken Knowlton, sound by Gershon Kingsley, 1970. Produced for and distributed by AT&T, Attn: Martin Duffy, 195 Broadway, New York, New York.
6. 7094 Bell Telephone Laboratories Programmer's Manual, Bell Telephone Laboratories, Inc., Murray Hill, New Jersey (1963).
SUB CHAIRMAN: Jim Tsukida - Pacific Missile Range
SUB CHAIRMAN: Don Stanley - Lockheed - California Company
It was the intent of this workshop to identify ten assets and ten limitations of a scientific microfilm plotting system for the areas of applications, hardware and operations, and software. Each attendee was asked to identify three assets and three limitations of his system based on his particular area of interest. Then the sub-chairman was to provide a consensus report of these assets and limitations by giving 10 assets and 10 limitations. The sub-group then prepared a consensus report of how each of the 10 limitations should be solved. Finally, each sub-group took one limitation and attempted to develop a ten step procedure of how to solve this limitation. This technique was very good from the standpoint of insuring that each member communicated his own feeling on paper and vocally during the workshop. Although the results were not earth-shattering, some very good information was obtained. (See consensus reports that follow. )
NOTE: People in this group used over 15 different types of host computers.
The use of computer animation in chemistry is rapidly growing, both for research and for education. This symposium brings together for the first time the diverse group working in the field, in hopes of nucleating communication. Those involved include chemists, physicists, and biologists. The common pattern which runs through their work is the use of computers to create visual images illustrating chemical structures and processes.
The accompanying test run displays some important structural features of myoglobin, a very large molecule which is a protein active in supplying oxygen to muscle tissue. All proteins are made up of sub-units called amino acids, of which myoglobin has 153 connected into one continuous chain which folds around into a box-like superstructure. The film begins by showing the 3-dimensional arrangement of the amino acids in myoglobin by building the chain one link at a time (the amino acids are represented by a single blue circle in the position of the alpha carbon). The completed chain, called the backbone, is then rotated to show its structure.
We next display a structural feature found in many proteins and particularly prevalent in myoglobin, the alpha helix, in which a section of the chain winds into a coil - a girder which gives the box rigidity. The helix is separated from the rest of the molecule and its bonding displayed. The red groups are peptide bonds which join the amino acids in all of myoglobin but which, for simplicity, were earlier represented by straight blue lines. The yellow bonds are hydrogen bonds between atoms of the peptide bonds, which serve to hold the chain in its helical conformation. The green structures are the remaining part of the amino acids called the residues. The residues, like the peptide bonds, were omitted earlier for simplicity.
The alpha helix is then returned to its place in the backbone and the three components of the active site (the raison d'etre of this protein) are added one at a time. First, two important residues (histidines) appear in green. They help to support the iron-containing meme group, which next appears in red. The iron (solid red) of the meme and histidines hold the oxygen, which appears in a yellow ball. The entire structure is then rotated.
We next zoom in on the active site to show the bonding of the iron and oxygen in detail. The iron is octahedrally coordinated, bonded to the four planar nitrogens of the pentagonal pyrrole groups and also bonded above and below to oxygen and one of the histidine side chains. The oxygen is held by electrostatic bonds to the iron and the other histidine. The meme group itself is an interesting structure and is now rotated to display its planar, very symmetric form. We then climb back out of myoglobin and view it rotating.
A Protein Primer is a production of The Senses Bureau, a group of students under the leadership of Professor Kent Wilson at the University of California at San Diego. The director of the film is Bob Weiss, the cinematographer is Noel Bartlett, and the programmers are Watie Alberty, Fred Heidrich, and Charles Morgan. The images were generated on a magnetic tape by a CDC 3600 computer using the program ORTEP from Oak Ridge Laboratories. A separate tape was written for each of the four colors used. The tapes were then processed using a 35mm pin-registered camera attached to a DatagraphiX 4060 provided by DatagraphiX of San Diego to produce four black-and-white strips of film {Kodak Recordak Dacomatic), which were overlayed through filters onto a single 16mm master at Cinema Research, Inc. of Los Angeles. The sound track, composed by Gino Piserchio on a computer of sorts - the Moog Synthesizer, was then added on optically at Hollywood Film Enterprises.
