
This appendix contains some relevant data on computing provision by SERC. Figure 1 gives a summary of SERC installed' computing equipment at January 1984 including both central and distributed systems.
Figure 2 gives some historical information on the central systems provided by SERC. The actual and inflation corrected costs are given as well as the power (in MIPS) of the systems.
Figure 3 shows the information in graphical form and clearly shows the rapid growth in both computer power and disc capacity. The inflation corrected capital cost of the installed systems has decreased by a factor of 10 while the installed power has increased by a factor of 100.
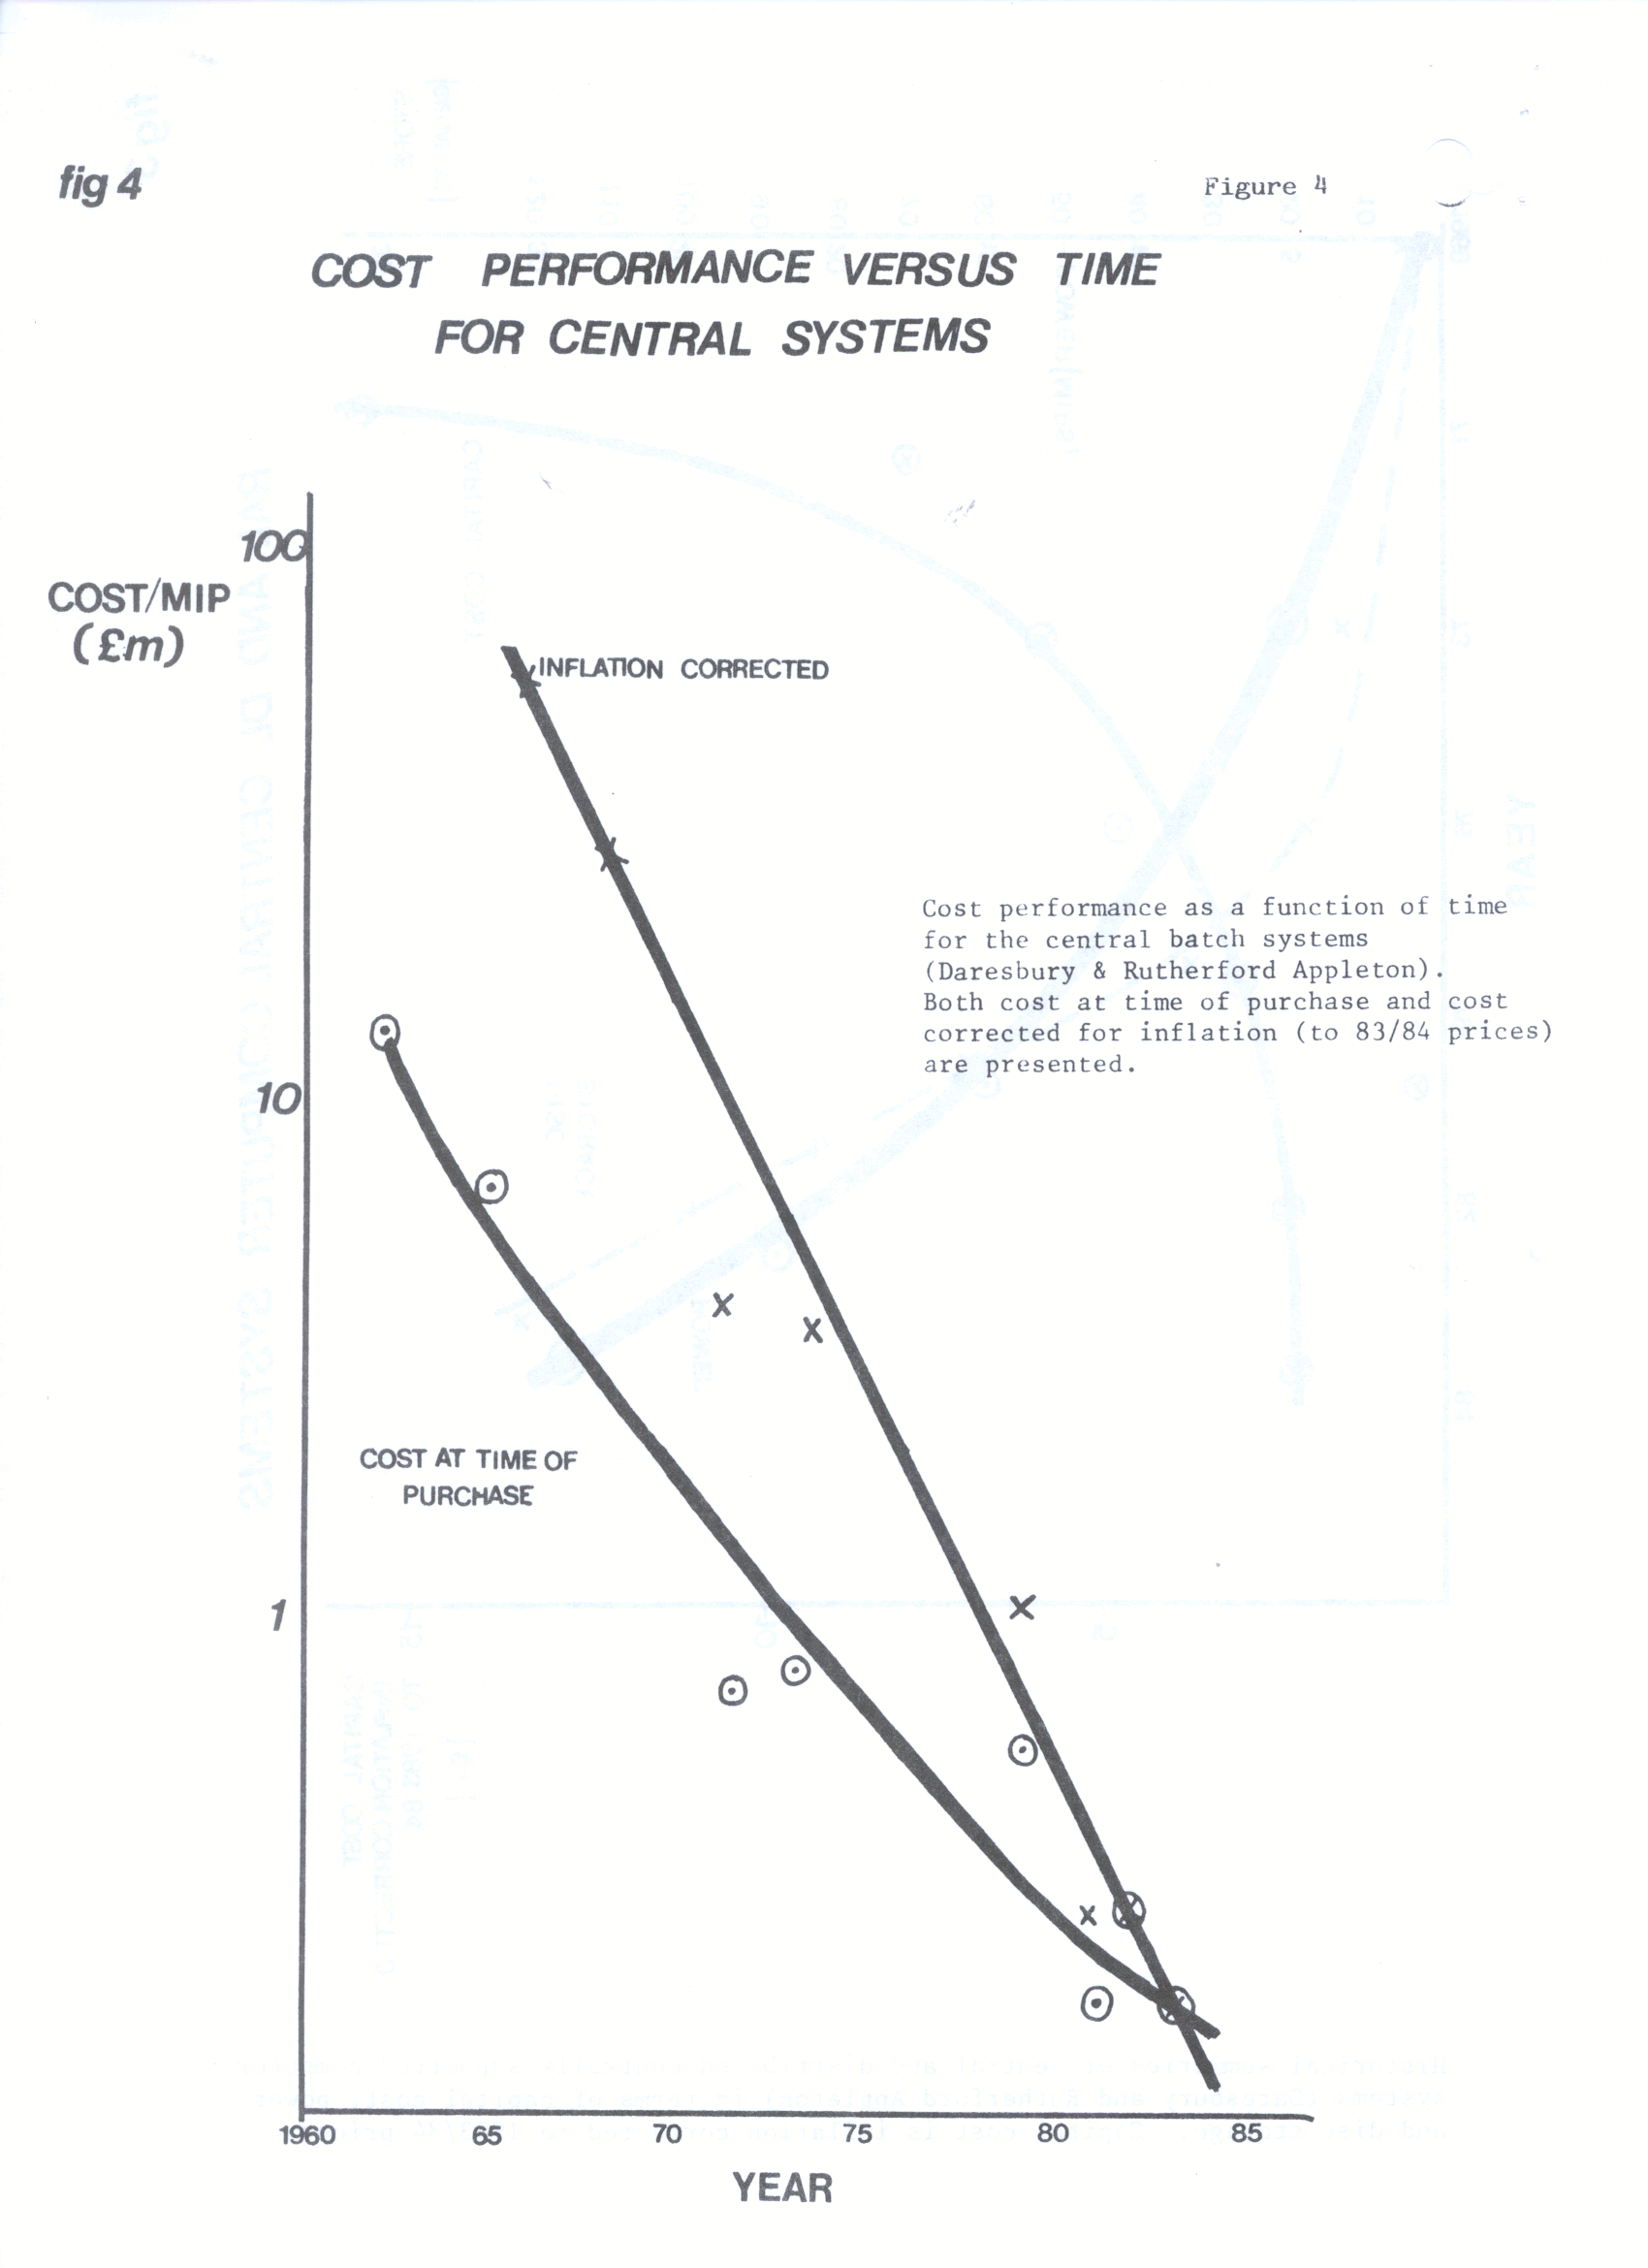
Figure 4 shows the same information as the cost per MIP installed in real terms the cost has decreased by a factor of 1000 in 20 years which is an improvement by a factor of 1.41 per year.
Figure 5 gives in tabular form the distributed systems installed by the Boards for different years.
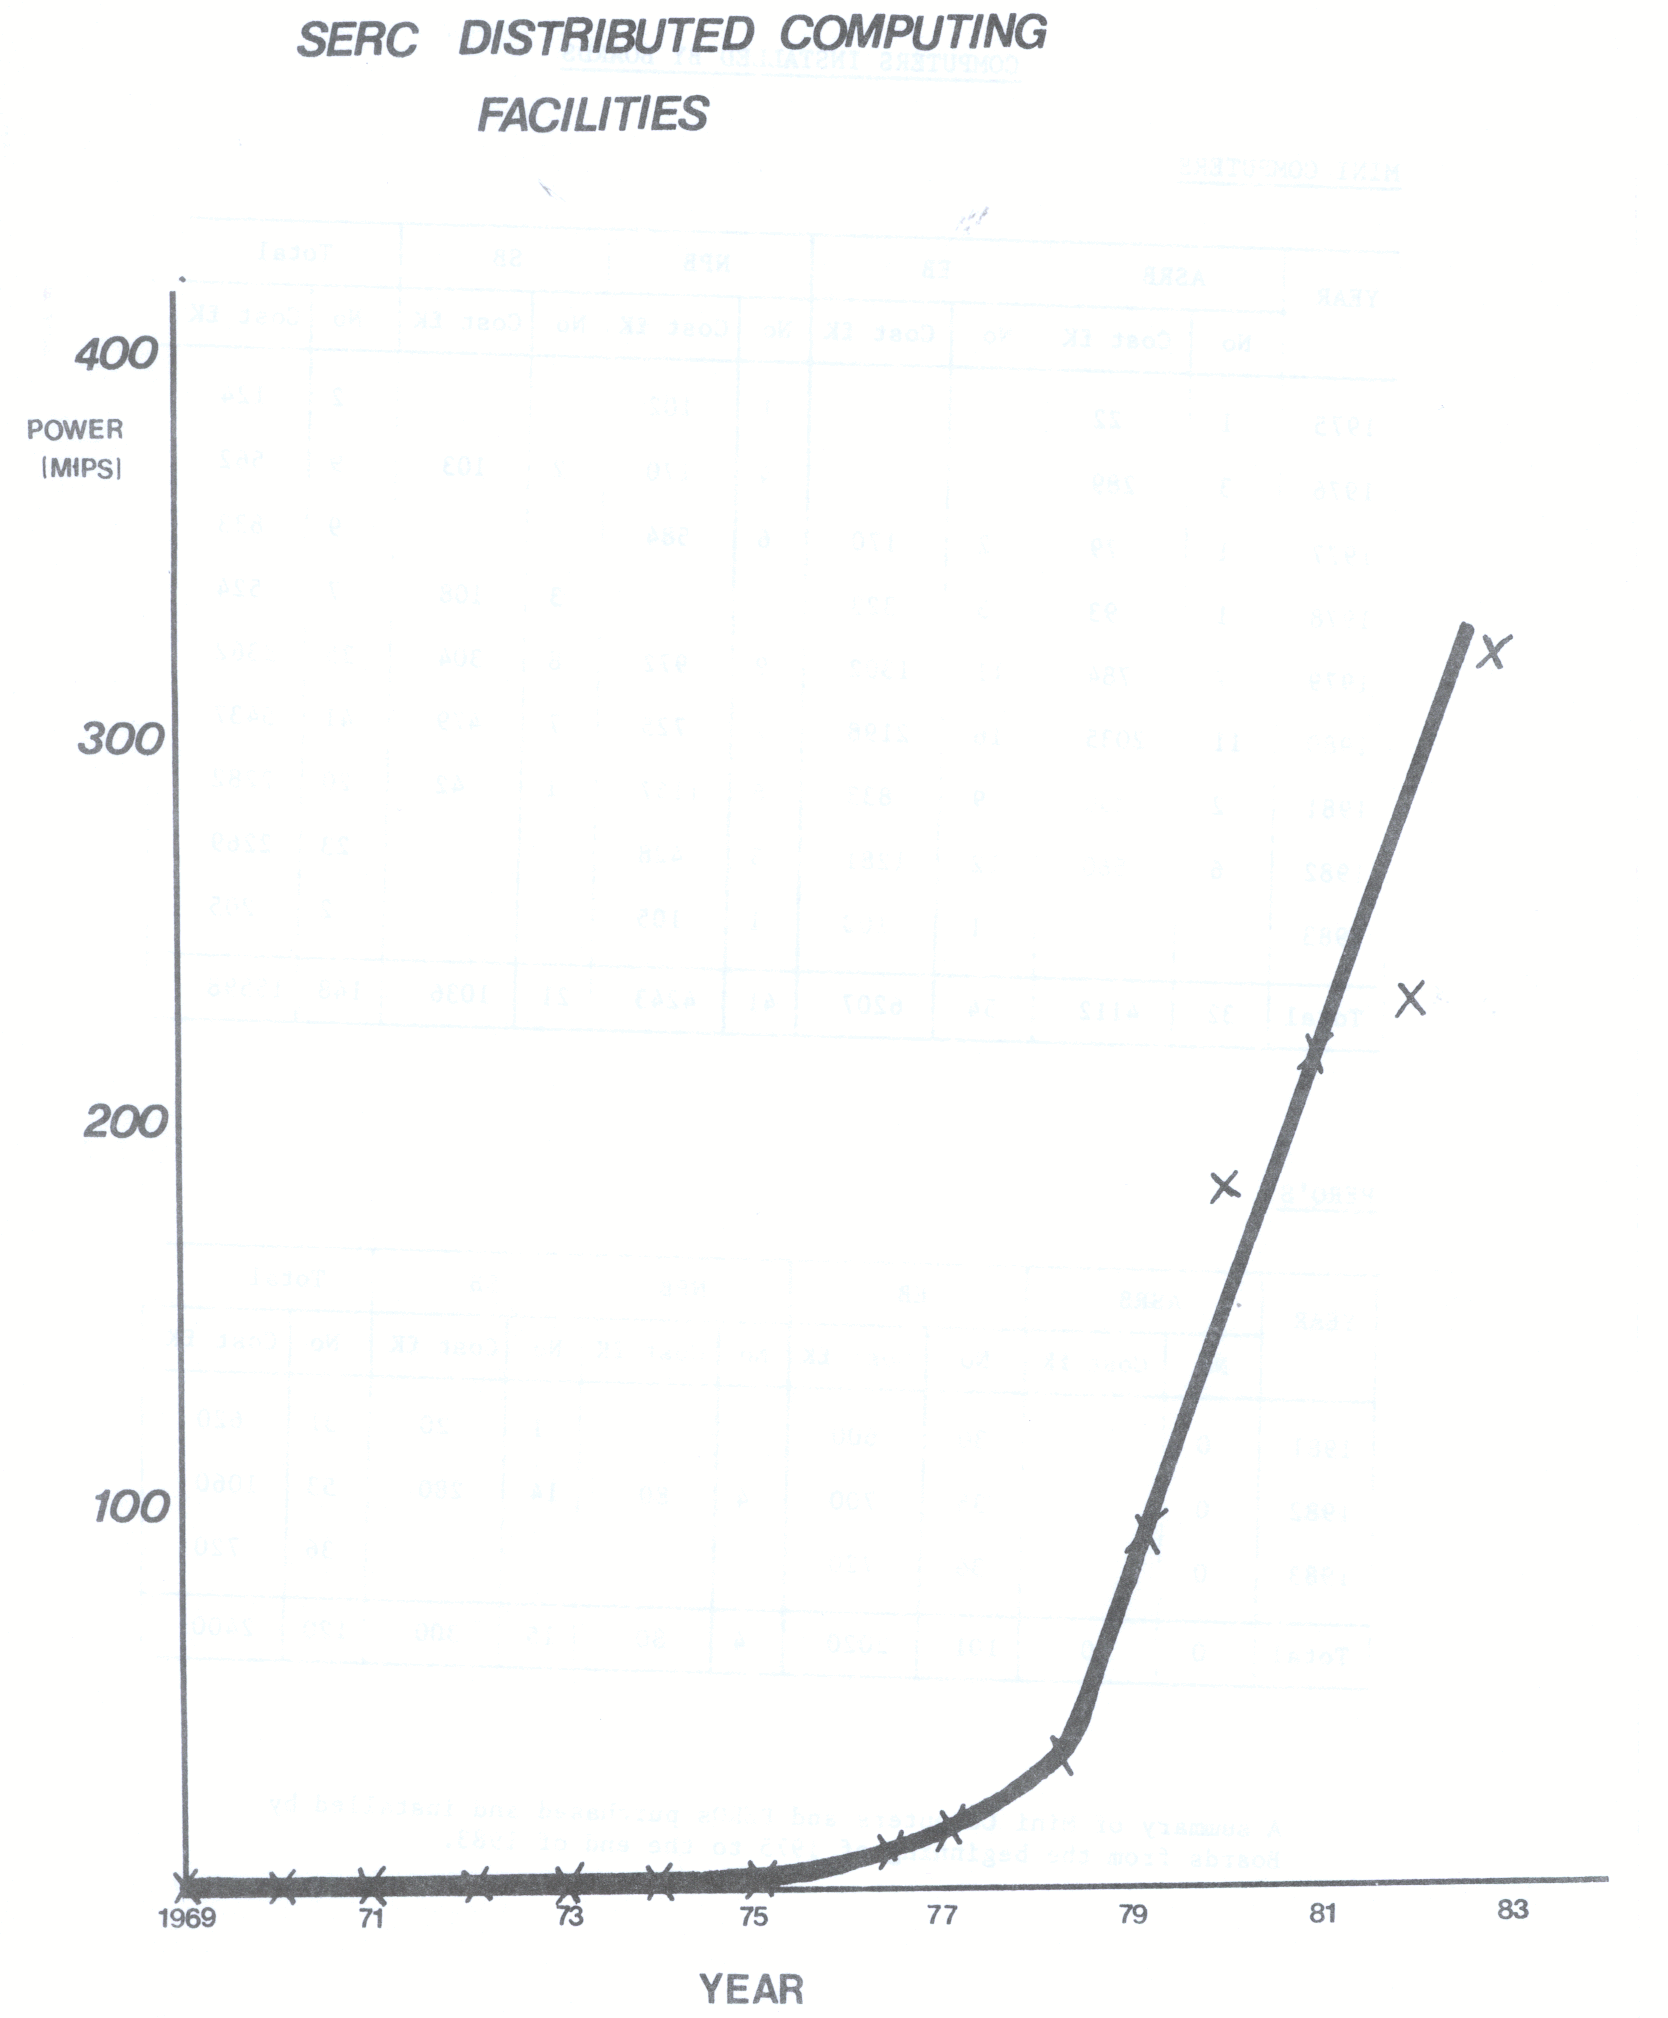
Figure 6 shows the total power of distributed systems installed as a function of time showing the very rapid growth from 1978.
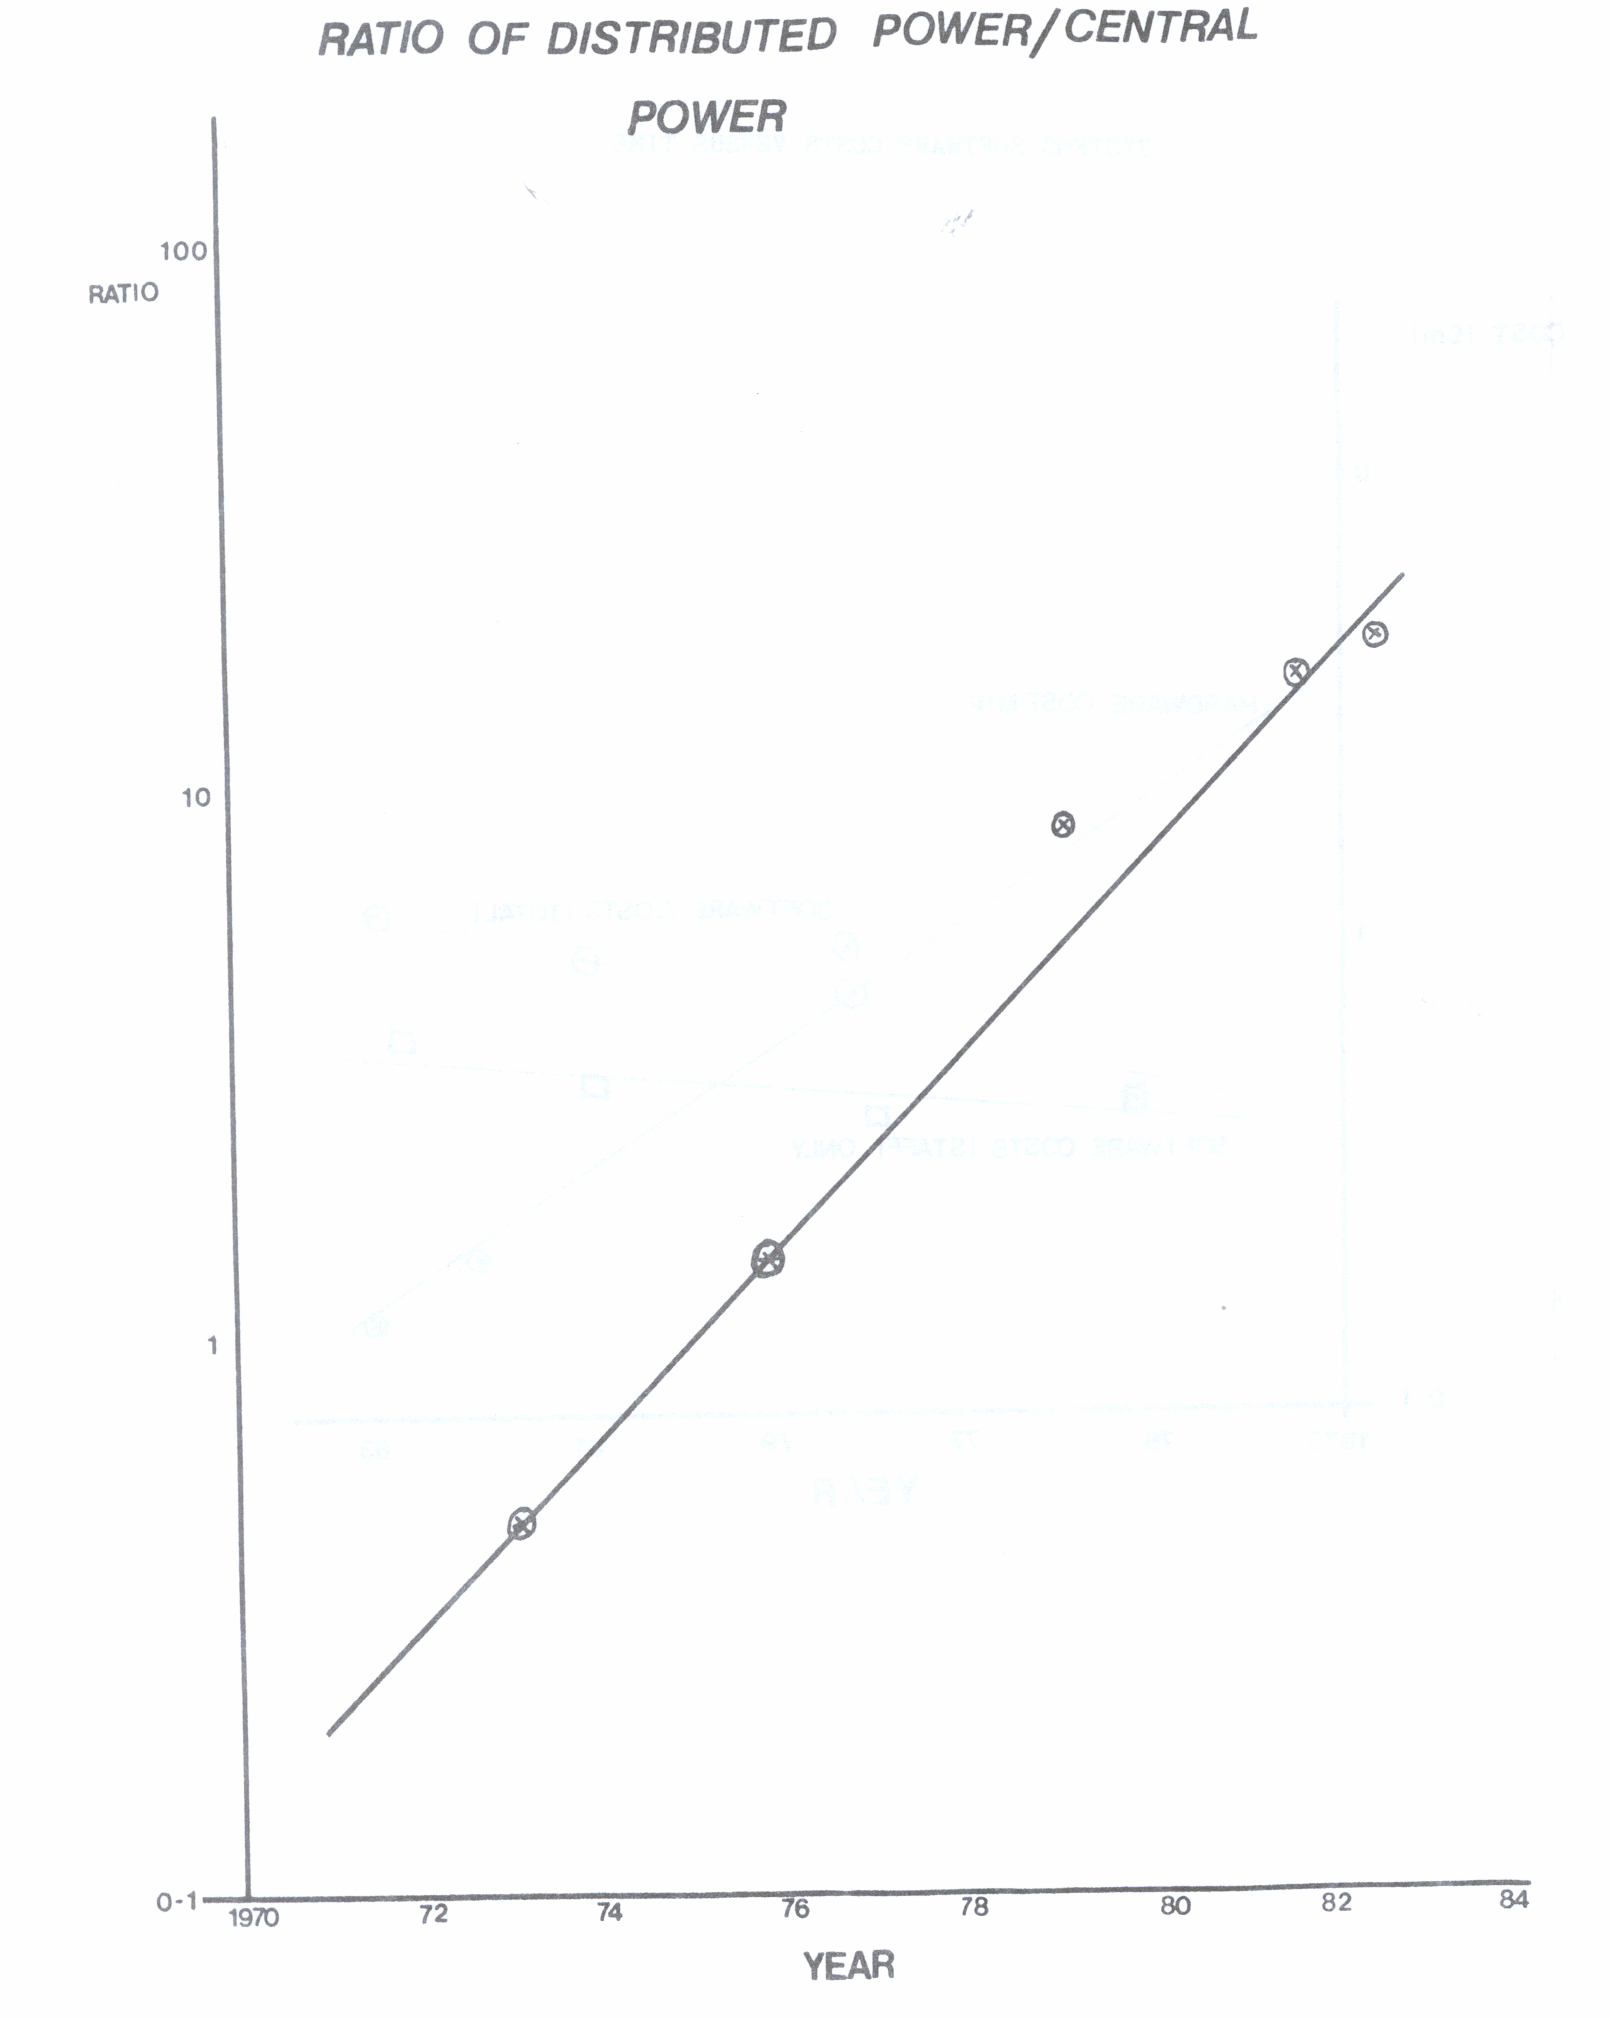
Figure 7 shows the ratio of power distributed to that provided centrally. Until 1976 there was more power centrally but now there is an order of magnitude more power distributed than that provided centrally.
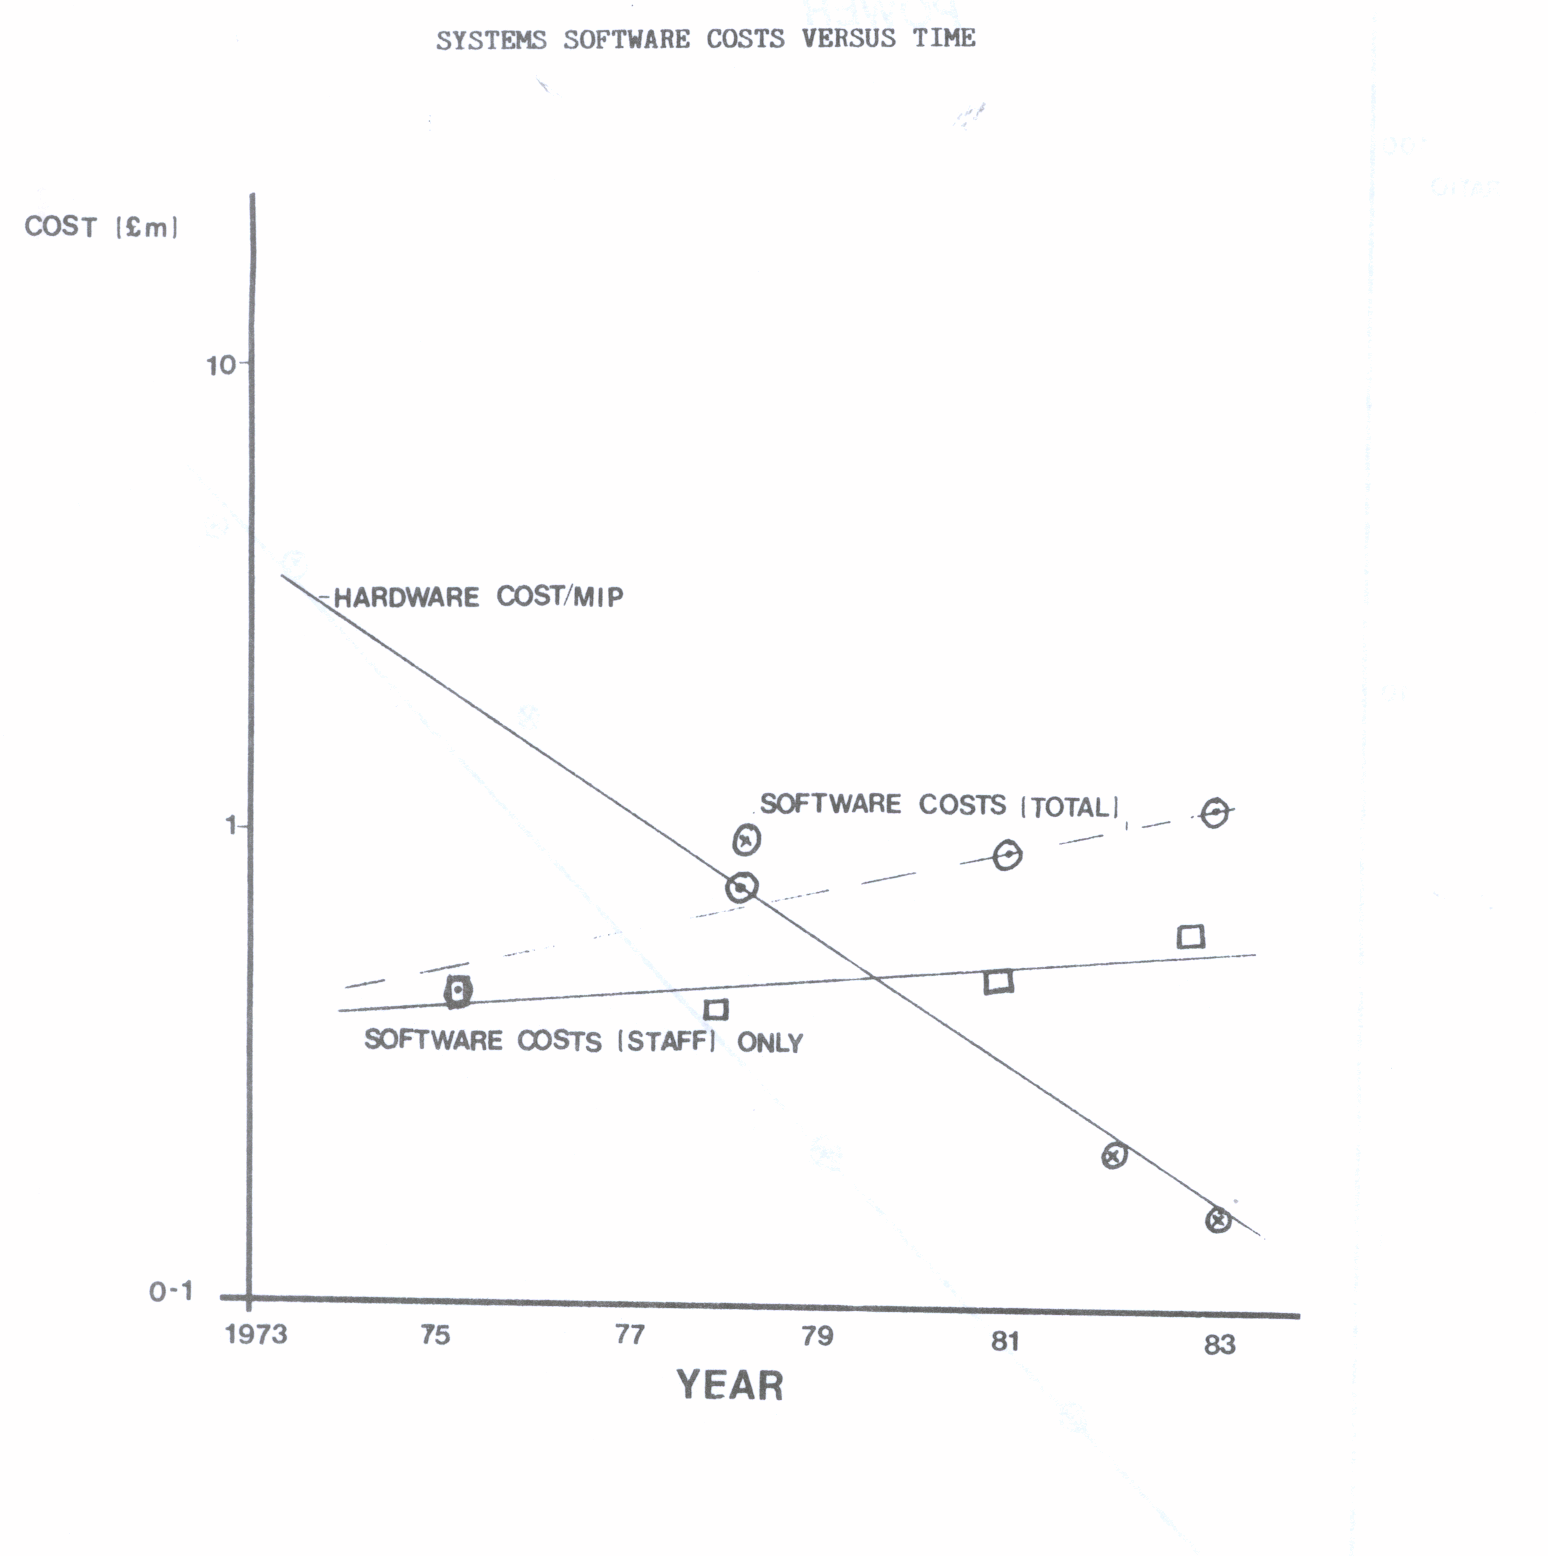
Figure 8 shows the inflation corrected costs of software support for central systems. These costs have increased slowly due to increases of charges for software - the staff costs have been approximately constant at about £0.5M per year. The current total cost of about £1M per year now exceeds hardware costs - it is now equivalent to the capital cost of a 6 MIP system. It is clear that in future software costs will dominate over hardware costs.
Figure 9 gives information on the number of SERC staff used to provide support for the central and distributed systems provided by SERC. In nine years the support staff has reduced by 30% (from 233 to 166) while the number of systems supported has increased by a factor of 30 and their power by a factor of 28.
Figure 10 gives information on the number of users of systems centrally supported by SERC. A breakdown between Boards is given. The total number is now 5550 and has increased by a factor of 5 in 10 years.
| Equipment | Capital Cost £M | Date Installed | Funding Source | Power (MIPS) |
|---|---|---|---|---|
| NAS 7000 | * 1 | 1981 | CCC | 3 |
| IBM 3081 | ** 3 | 1982 | CCC | 10 |
| ATLAS 10 | 2 | 1983 | CCC | 15 |
| MINIS (32) | 4 | 1975-83 | ASRB | 15 |
| MINIS (135) | 6 | 1977-81 | EB | 23 |
| MINIS (45) | 4 | 1975-83 | NPB | 19 |
| MINIS (36) | 1 | 1976-83 | SB | 4 |
| PERQs (140) | 3 | 1982-83 | EB (SB,CCC) | 35 |
* includes estimate of £O.5M for existing peripherals
** includes estimate of £1M for existing peripherals
Summary of the SERC installed equipment (at Jan 1 1984) including both distributed and central systems. The costs are the original costs at the time of purchase.
| Year | Machine | Power (MIPS) | Cost at Installation (£M) | Period of Use | Inflation Corrected to 1983/84 prices Cost (£M) |
|
|---|---|---|---|---|---|---|
| RAL | DL | |||||
| 1964 | Atlas I | 0.25 | 2.5 | 1964-1973 | 15.0 | |
| 1967 | IBM 360/75 | 0.75 | * 2.5 | 1967-1972 | 17.1 | |
| 1971 | ICL 1906A | 0.50 | 2.0 | 1971-1978 | 8.4 | |
| 1971 | IBM 360/195 | 5.00 | 3.4 | 1971-1983 | 14.2 | |
| 1973 | IBM 360/165 | 2.00 | 1.5 | 1973-1981 | 5.4 | |
| 1976 | IBM 360/195 | 5.00 | 1.8 | 1976-1983 | 3.8 | |
| 1978 | IBM 3032 | 2.50 | 1.5 | 1978-1983 | 2.6 | |
| 1981 | NAS 7000 | 3.00 | 0.5 | 1981- | 0.6 | |
| 1982 | IBM 3081 | 10.00 | 2.0 | 1982- | 2.1 | |
| 1983 | Atlas 10 | 15.00 | 2.0 | 1983- | 2.0 |
* Rented at £0.5M p.a. over 5 years
Summary of the history of the Central systems hardware in terms of power and cost (both original and inflation corrected).
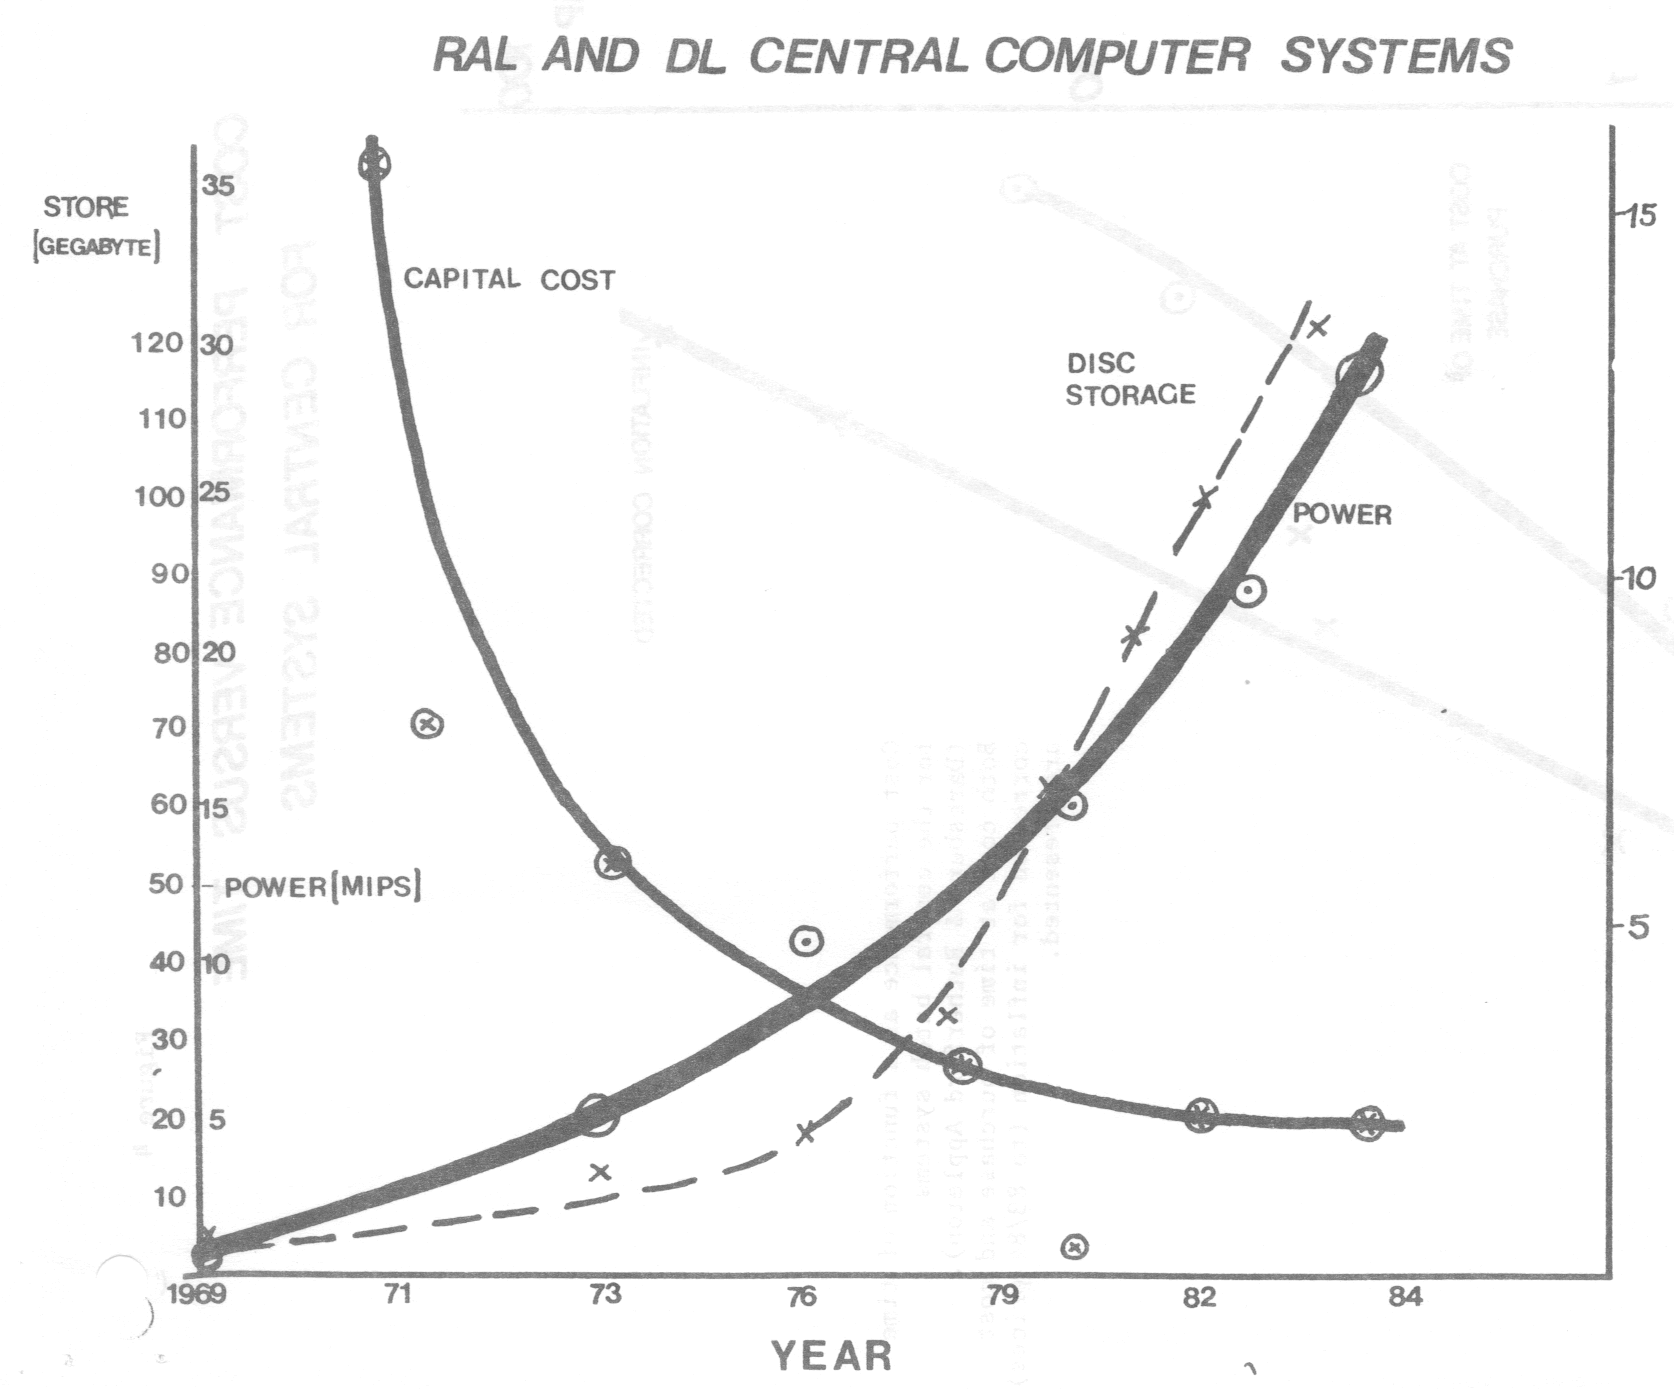
Historical summaries of central and distributed centrally supported computer systems (Daresbury and Rutherford Appleton) in terms of capital cost, power and disc storage. Capital cost is inflation correct to 1983/84 prices.
| Year | ASRB | EB | NPB | SB | Total | |||||
|---|---|---|---|---|---|---|---|---|---|---|
| No | Cost £K | No | Cost £K | No | Cost £K | No | Cost £K | No | Cost £K | |
| 1975 | 1 | 22 | 1 | 102 | 2 | 124 | ||||
| 1976 | 3 | 289 | 4 | 170 | 2 | 103 | 9 | 562 | ||
| 1977 | 1 | 79 | 2 | 170 | 6 | 584 | 9 | 833 | ||
| 1978 | 1 | 93 | 3 | 323 | 3 | 108 | 7 | 524 | ||
| 1979 | 7 | 784 | 11 | 1302 | 9 | 972 | 8 | 304 | 35 | 3362 |
| 1980 | 11 | 2035 | 16 | 2198 | 7 | 725 | 7 | 479 | 41 | 5437 |
| 1981 | 2 | 250 | 9 | 833 | 8 | 1157 | 1 | 42 | 20 | 2282 |
| 1982 | 6 | 560 | 12 | 1281 | 5 | 428 | 23 | 2269 | ||
| 1983 | 1 | 100 | 1 | 105 | 2 | 205 | ||||
| Total | 32 | 4112 | 54 | 6207 | 41 | 4243 | 21 | 1036 | 148 | 15598 |
| Year | ASRB | EB | NPB | SB | Total | |||||
|---|---|---|---|---|---|---|---|---|---|---|
| No | Cost £K | No | Cost £K | No | Cost £K | No | Cost £K | No | Cost £K | |
| 1981 | 0 | 0 | 30 | 600 | 0 | 0 | 1 | 20 | 31 | 620 |
| 1982 | 0 | 0 | 35 | 700 | 4 | 80 | 14 | 280 | 53 | 1060 |
| 1983 | 0 | 0 | 36 | 720 | 0 | 0 | 0 | 0 | 36 | 720 |
| Total | 0 | 0 | 101 | 2020 | 4 | 80 | 15 | 300 | 120 | 2400 |
A summary of Mini Computers and PERQs purchased and installed by Boards from the beginning of 1975 to the end of 1983.
| Year | Operations | User Support | Software | Admin | Total | No of Systems Supported |
Cost of Support (£M) |
Power of Systems Supported (MIPS) |
|---|---|---|---|---|---|---|---|---|
| 1975 | 96 | 32 | 55 | 30 | 233 | 5 | 2.3 | 12 |
| 1978 | 97 | 28 | 48 | 12 | 185 | 30 | 2.5 | 38 |
| 1981 | 84 | 35 | 55 | 11 | 185 | 130 | 3.1 | 221 |
| 1984 | 70 | 31 | 57 | 8 | 166 | 151 | 3.3 | 336 |
| ASRB | EB | NPB | SB | Total | |
|---|---|---|---|---|---|
| Total | |||||
| 1973 | 120 | 150 | 500 | 250 | 1150 |
| 1978 | 280 | 1450 | 720 | 600 | 3600 |
| 1983 | 350 | 2200 | 900 | 900 | 5550 |
| IBM Only | |||||
| 1973 | 120 | 150 | 500 | 250 | 1150 |
| 1978 | 180 | 160 | 720 | 500 | 2000 |
| 1983 | 240 | 240 | 900 | 750 | 2500 |
Historical summary of the users, in each Board area, of the centrally supported systems (Daresbury and Rutherford Appleton).
