
The Opscan document reader was installed in 1974 and this paper describes attempts at using the device for crystallographic diagram input and VLSI. It is included here although the report itself appeared much later.
Although diagrams of all kinds may be constructed within a computer system and output to some display device, it is becoming apparent that there is a need to generate diagrams external to the computer and then to read the diagrams into computer store ready for subsequent display. It is considered in some disciplines that the careful preparation of a diagram on a sheet of paper is to be preferred to a man machine interaction using some form of visual display and input equipment. For example an electronics engineer may wish to place components to close tolerances, and this is more easily done with a well defined measured grid on a sheet of paper. Further, the chemist wishes to input a rough diagram of a molecular structure to achieve a precise drawing suitable for output to books or to computer data bases. Other demands arise from the wish to input some special notation and entities used in a process, such as musical representation.
Readers are available which are capable of recognising single marks on sheets of paper in predetermined positions. The OPSCAN reader, the Longuines 7000 and the OBSTRAN are typical examples of such readers. Normally the devices are used for coded data input resulting from questionnaires and management control information, e.g time sheets. Marks are made in defined regions of the sheet to indicate information of a particular kind either numerical or text.
Simple forms of graphical input have been commonly used, since selected information from a prepared diagram on a sheet may be coded in the standard way (See Fig 5).
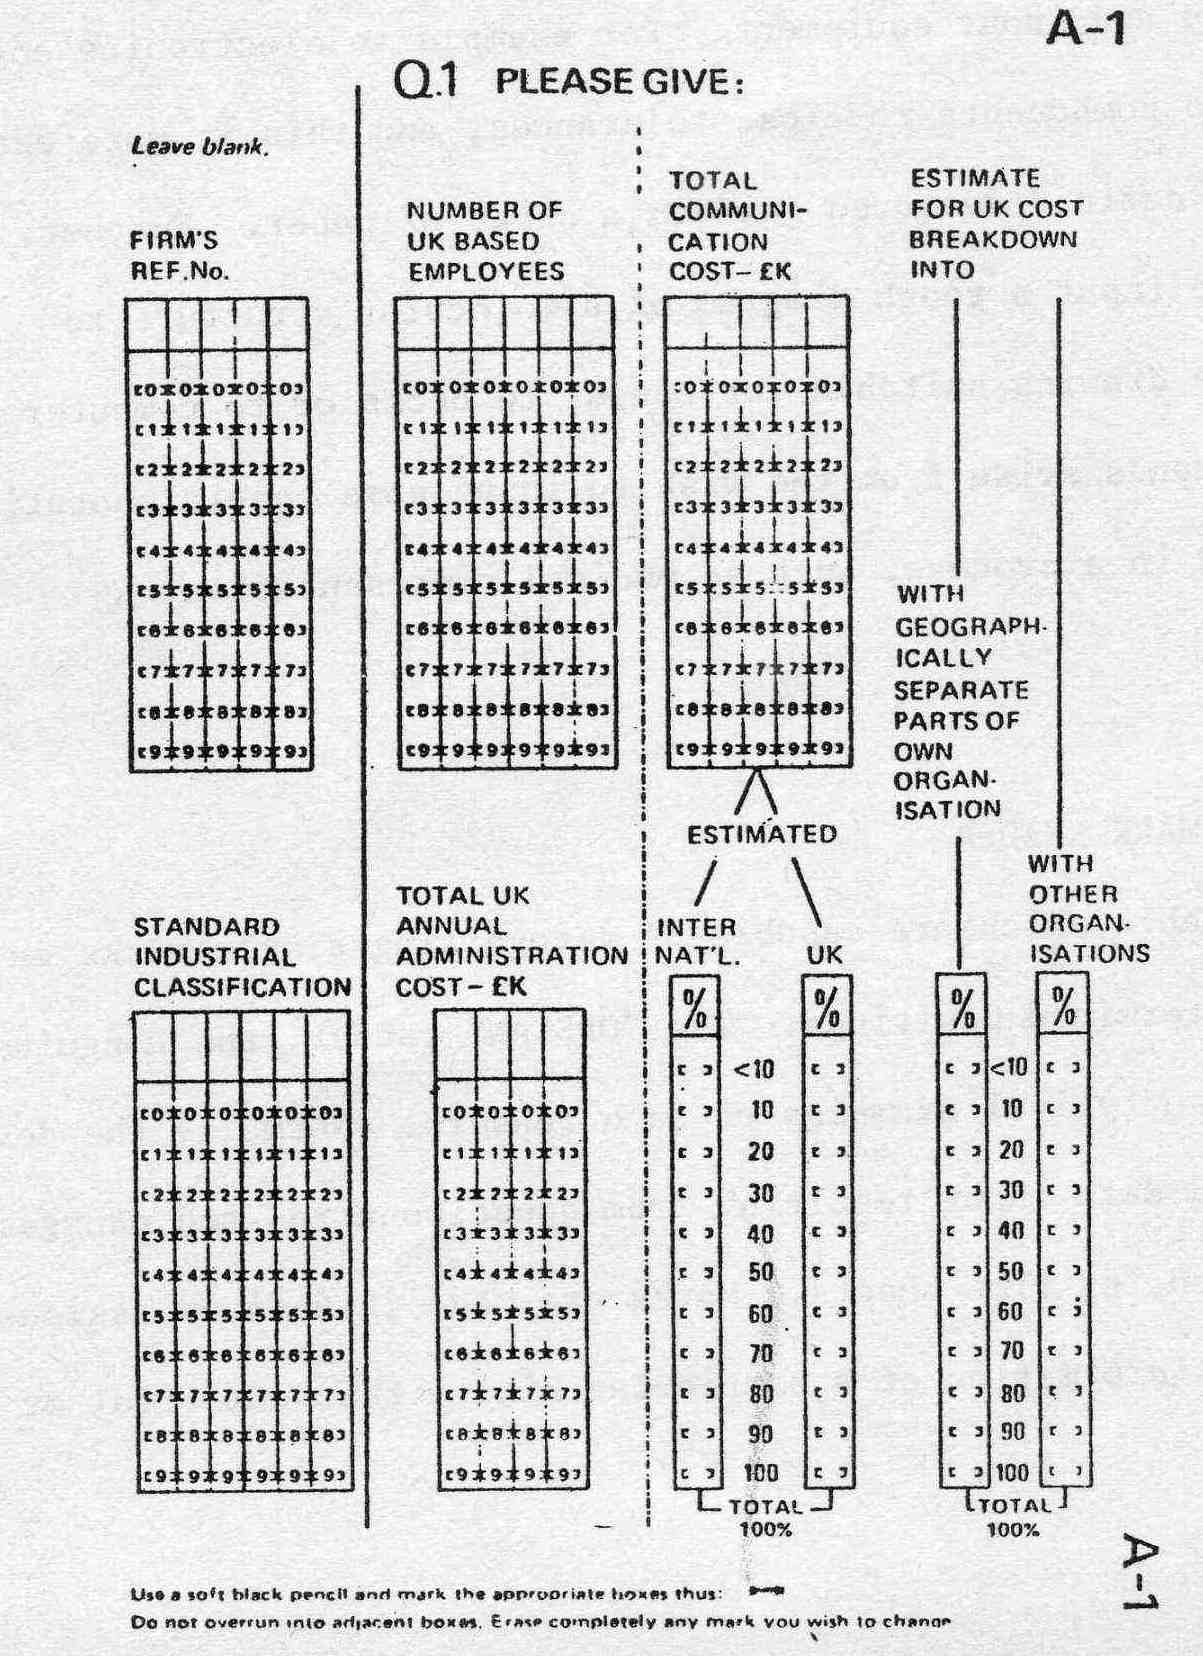
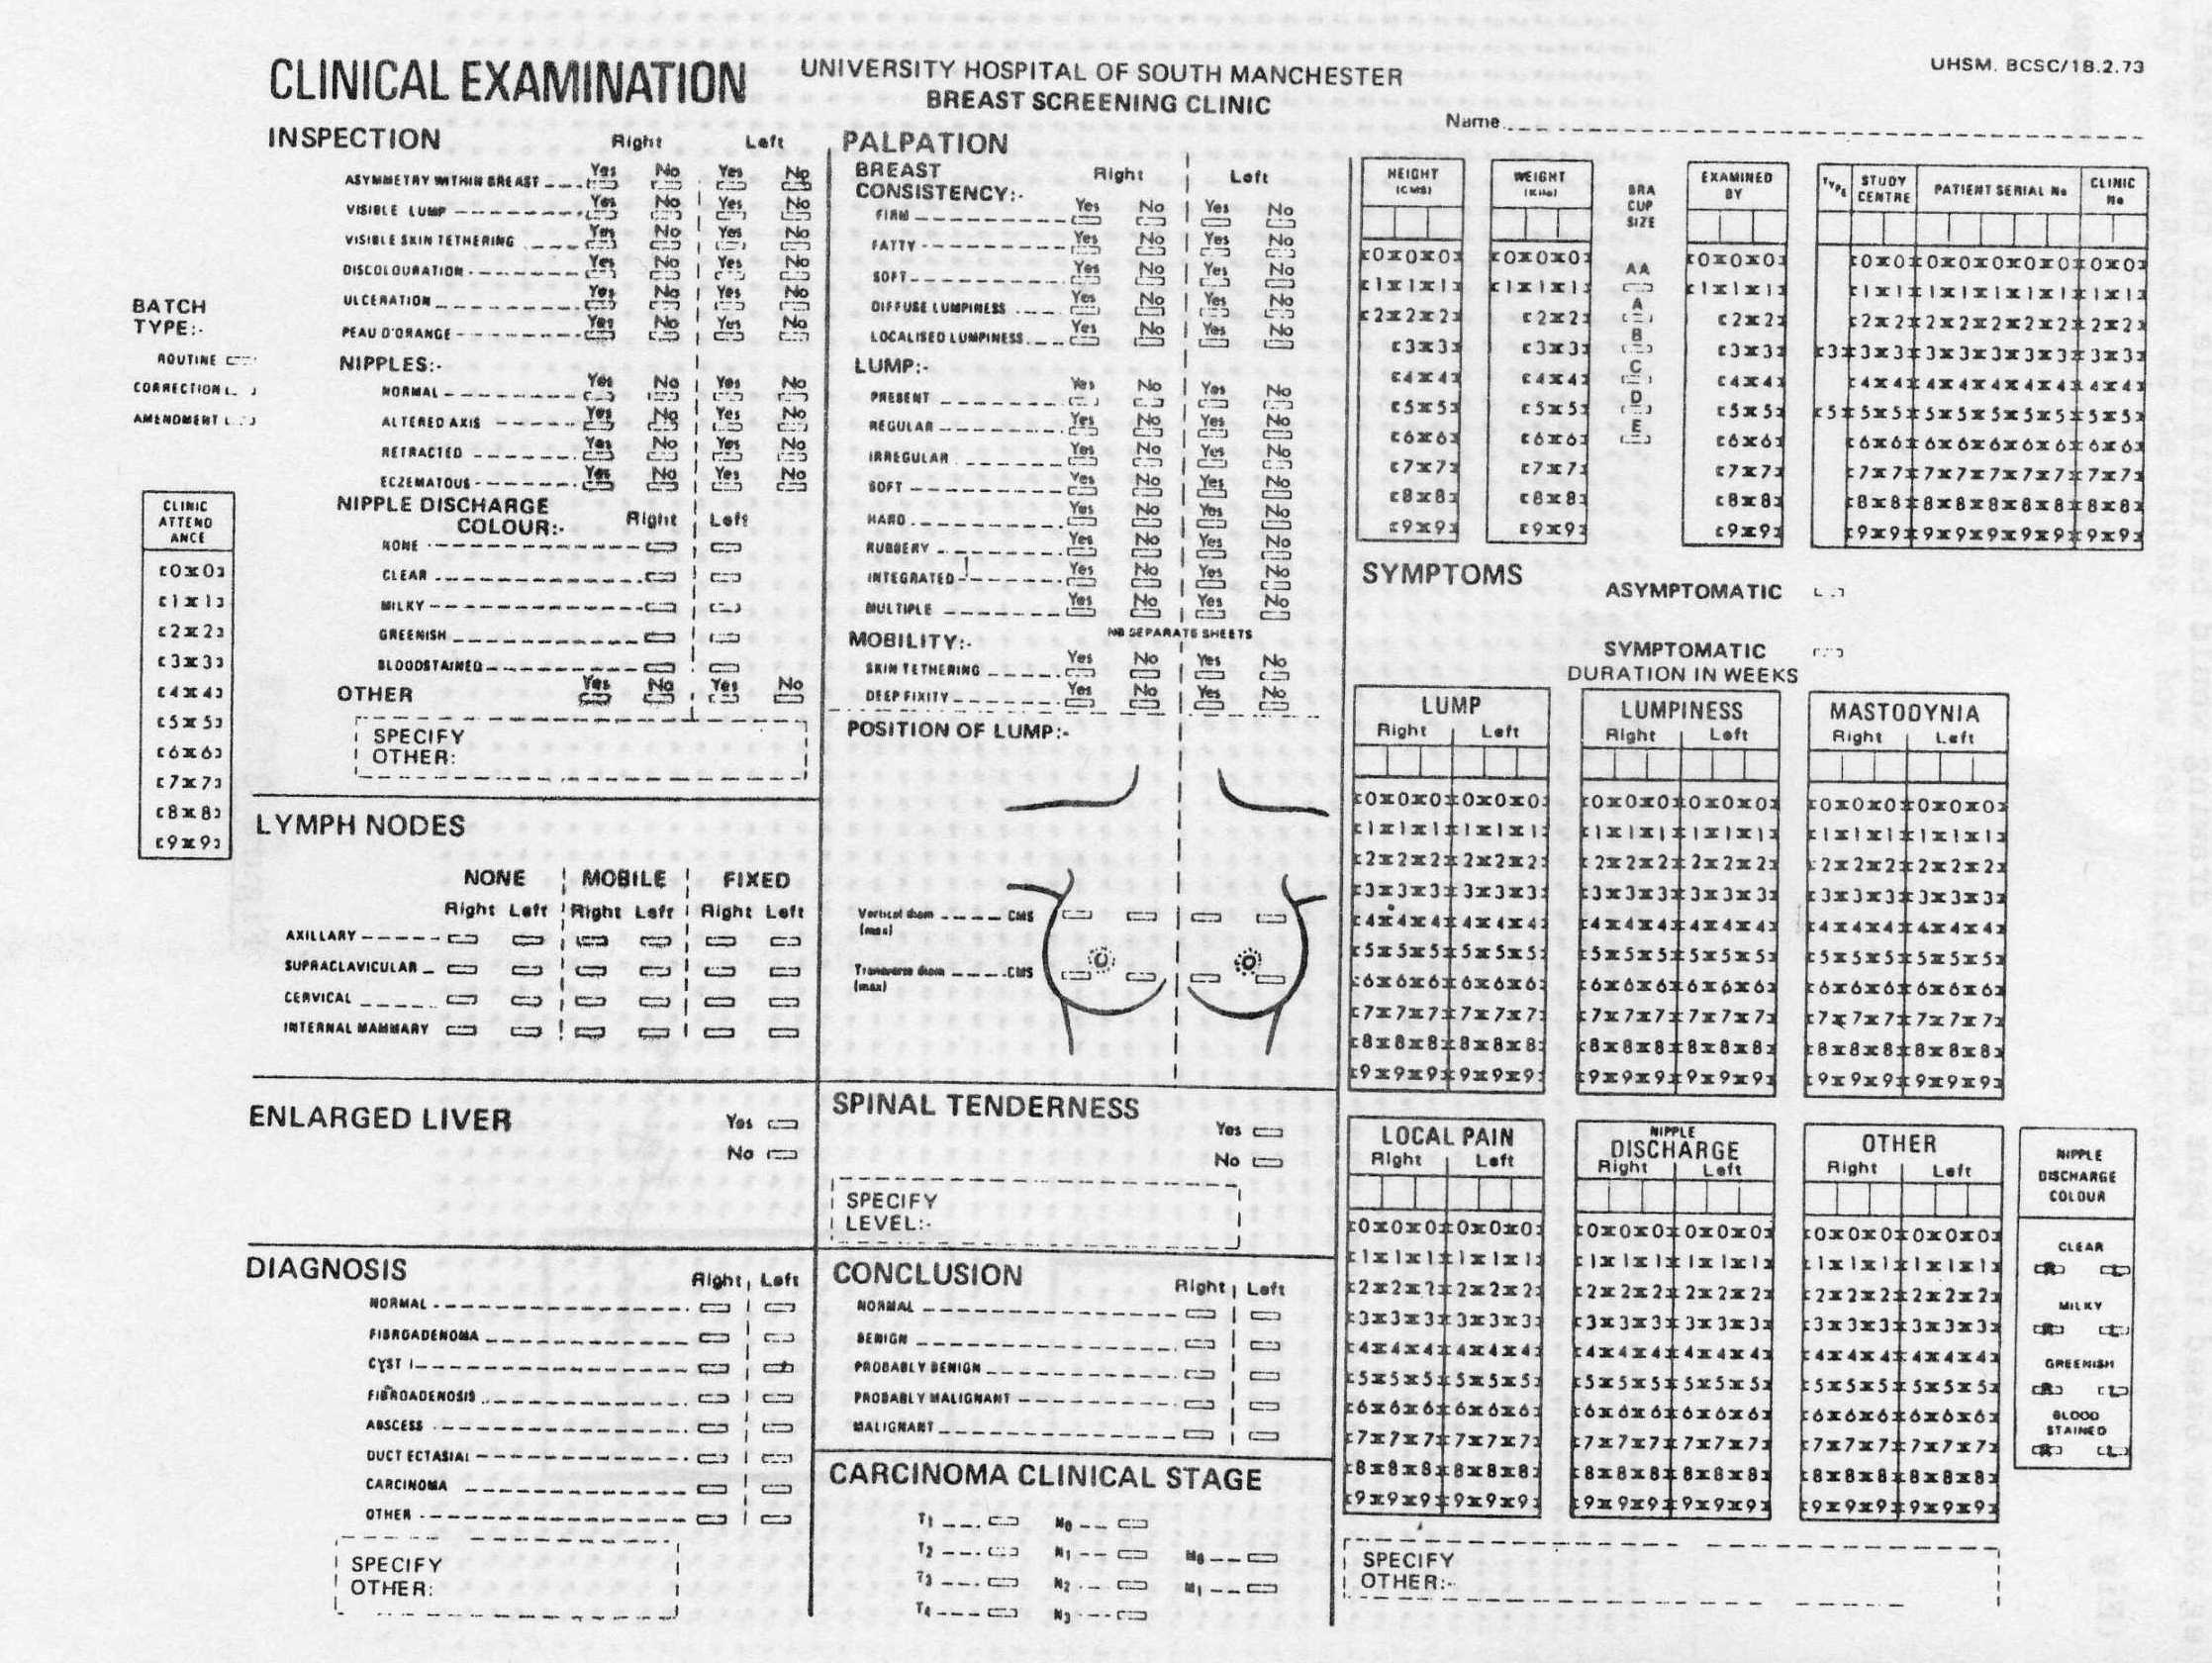
The principle used in recognising marks is that of differential light reflectance from a carbon based pencil. Pencil marks are recognised by a light beam against a background of non-reflective printing on the sheet. Thus prepared questionnaires may be printed with all options shown for each question to be answered. Given the standard spacing of the mesh of readable points a questionnaire suitable for any application may be prepared and printed (Fig 1).
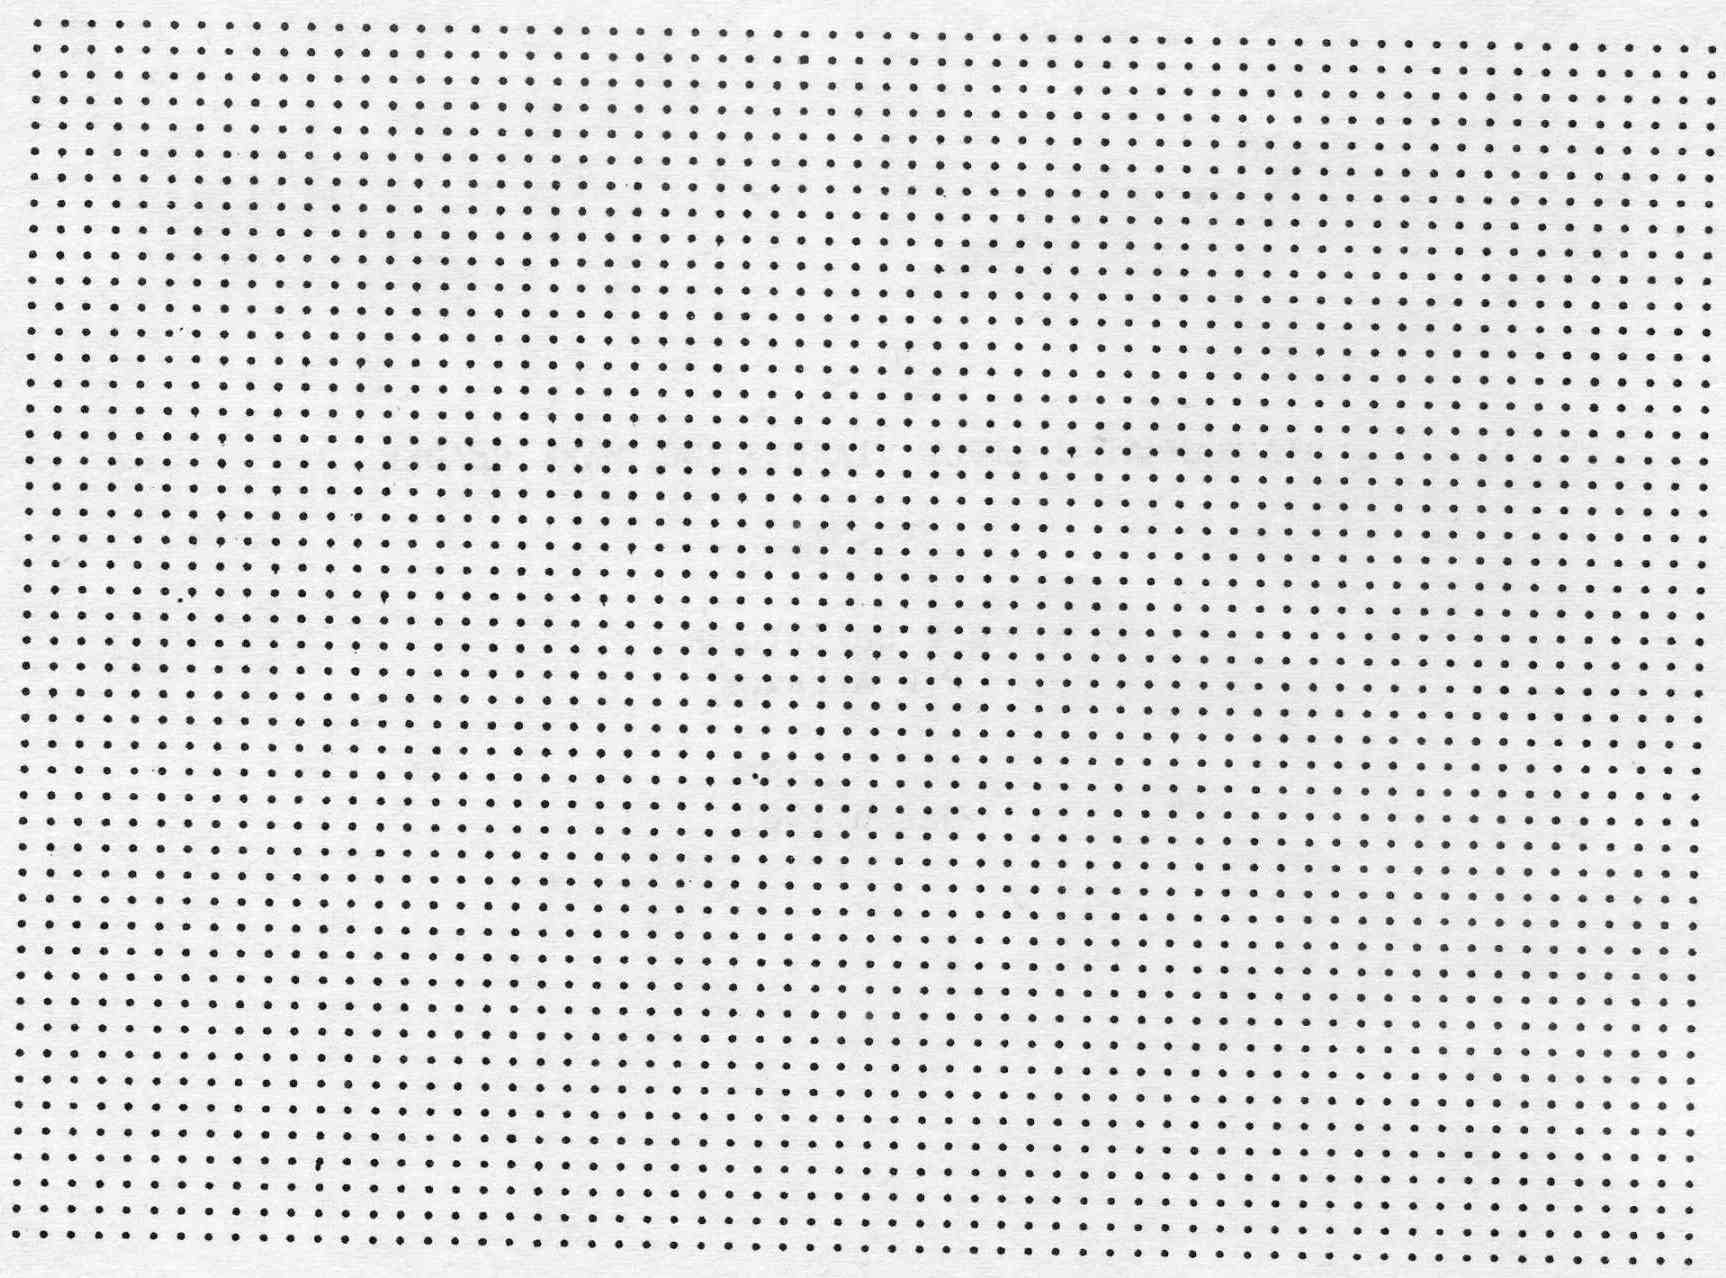
For the purpose of diagrammatic input the mesh (Fig 2) or available points may be regarded as defining a low resolution picture of the diagram (approx 30 points per sq in).
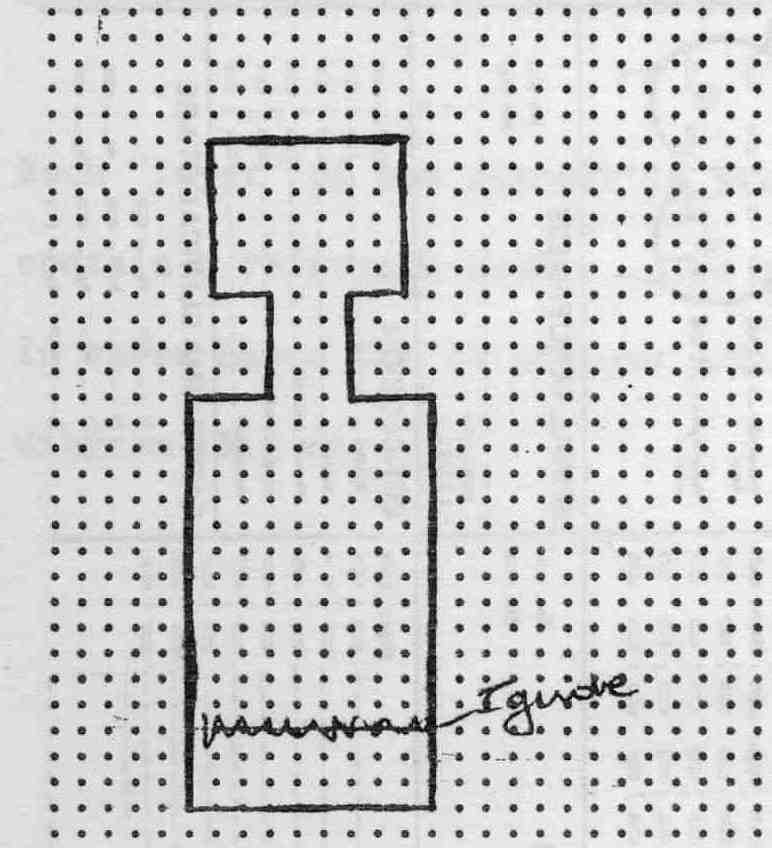
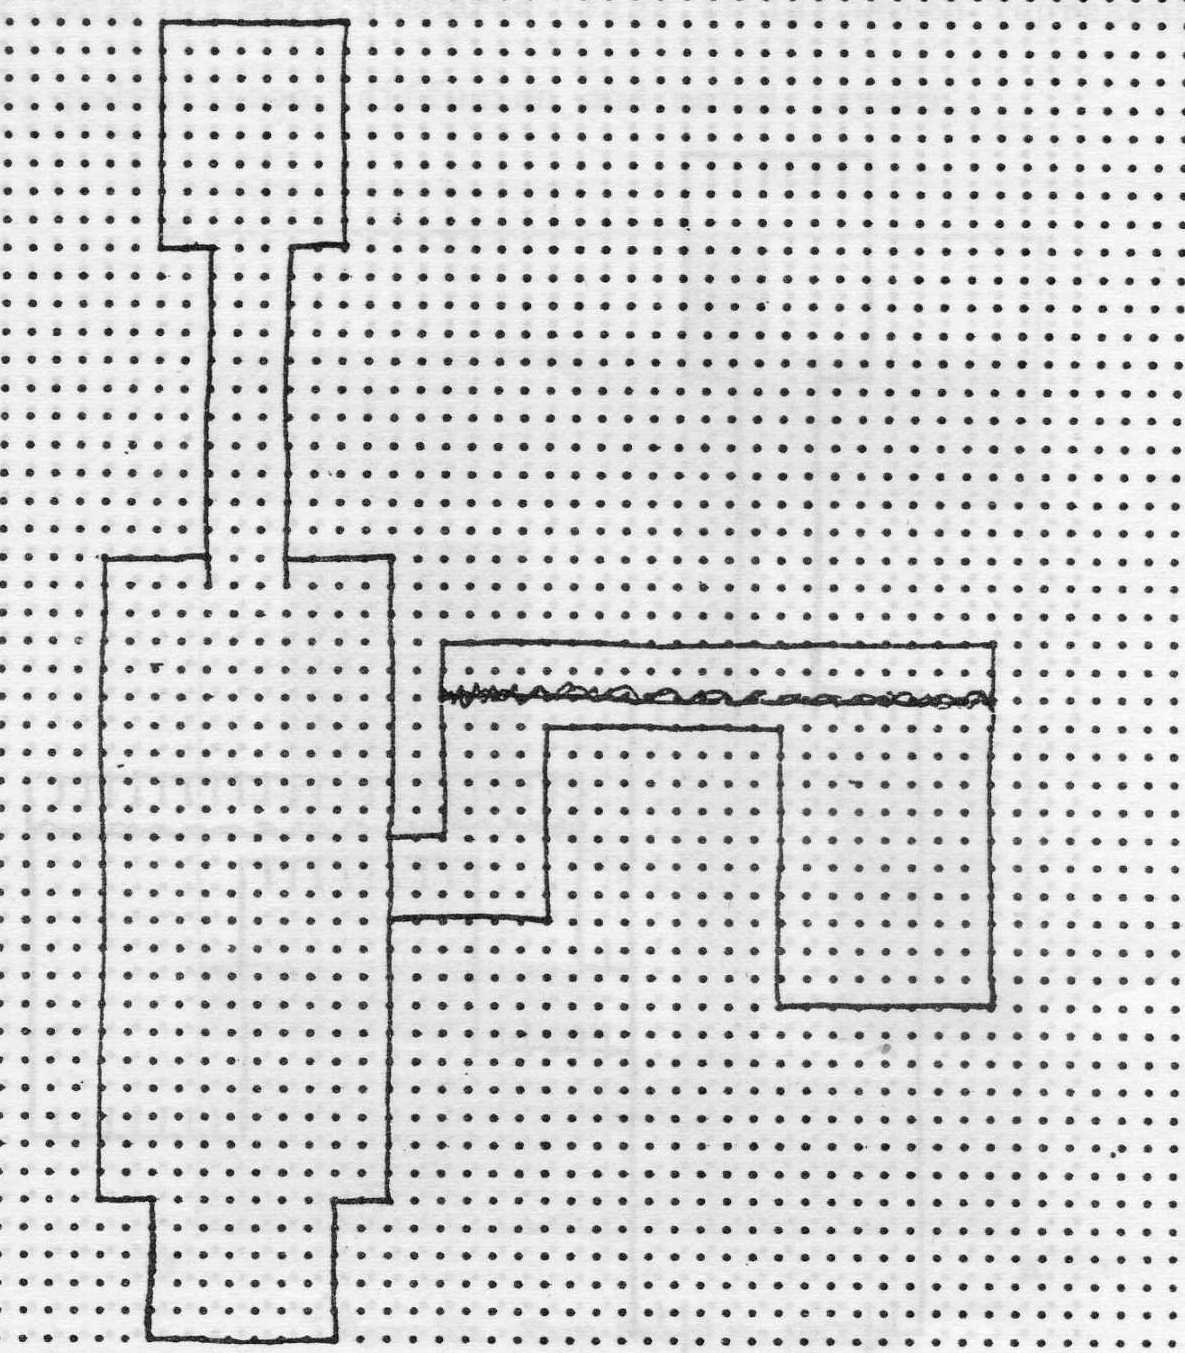
The drawing may however be prepared using other than carbon based pencils e.g water based ink pens and this drawing would be invisible to the reader (Fig 3).
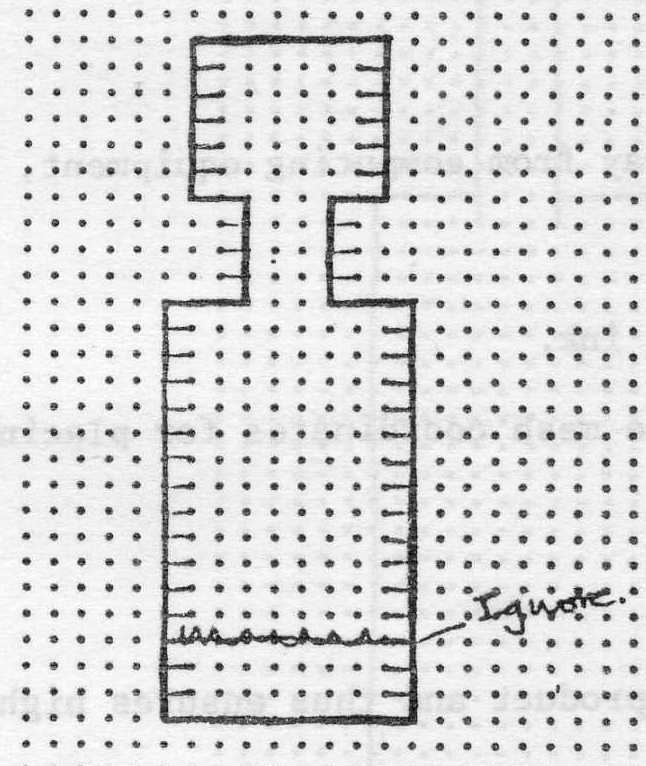
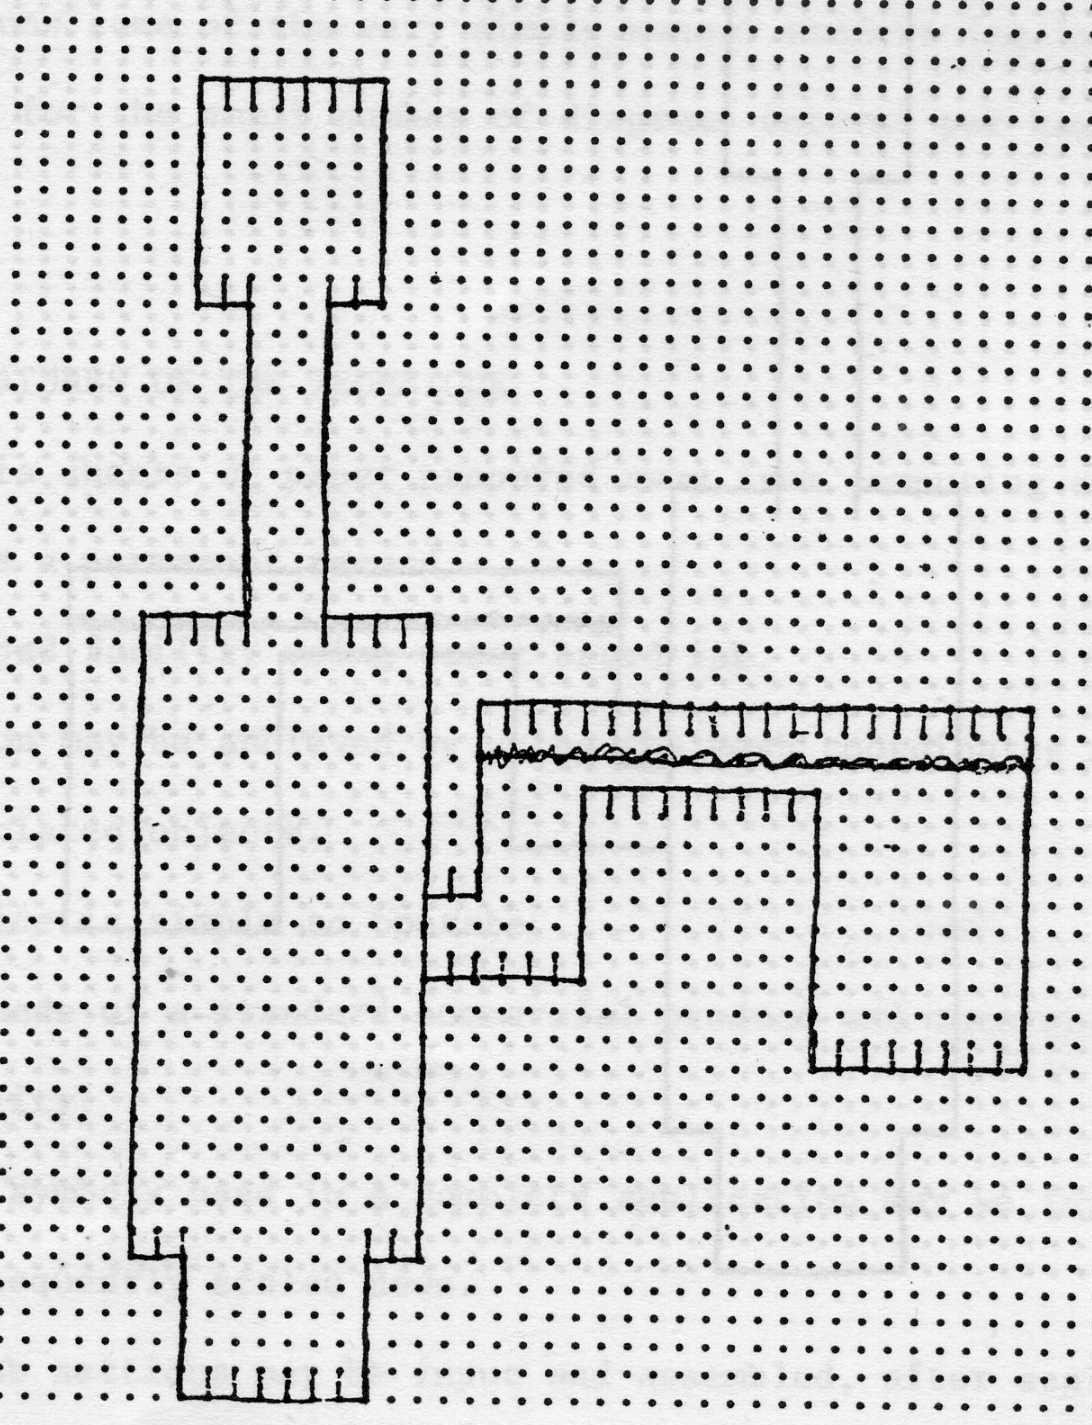
The user may sketch and overwrite with such pens, and only when he is satisfied, will the required points be marked with a carbon based pencil (Fig 4).
The information may therefore be considered at three levels:
The readers, which can be interfaced as standard terminals to host computer systems, are easily operated but in some cases are relatively slow. For diagrammatic input this latter feature is of no importance, and in a number of applications some of the very simple manual readers (e.g Longuines) will suffice for the small number of diagrams entered per hour.
Carver Mead & Lynn Conway, Introduction to VLSI Systems. Addison-Wesley (1980).
In the production of very large integrated systems (VLSI) there is a need to prepare accurate layout diagrams of parts of the system, showing the different layers of the circuit in contrasting shades or colours. If these layouts are prepared for input on marked sheets to the computer they may be re-assembled for subsequent display and collation in a larger overall system.
The OPSCAN reader has been used in preparing such layouts and the results of some early experiments are to be discussed.
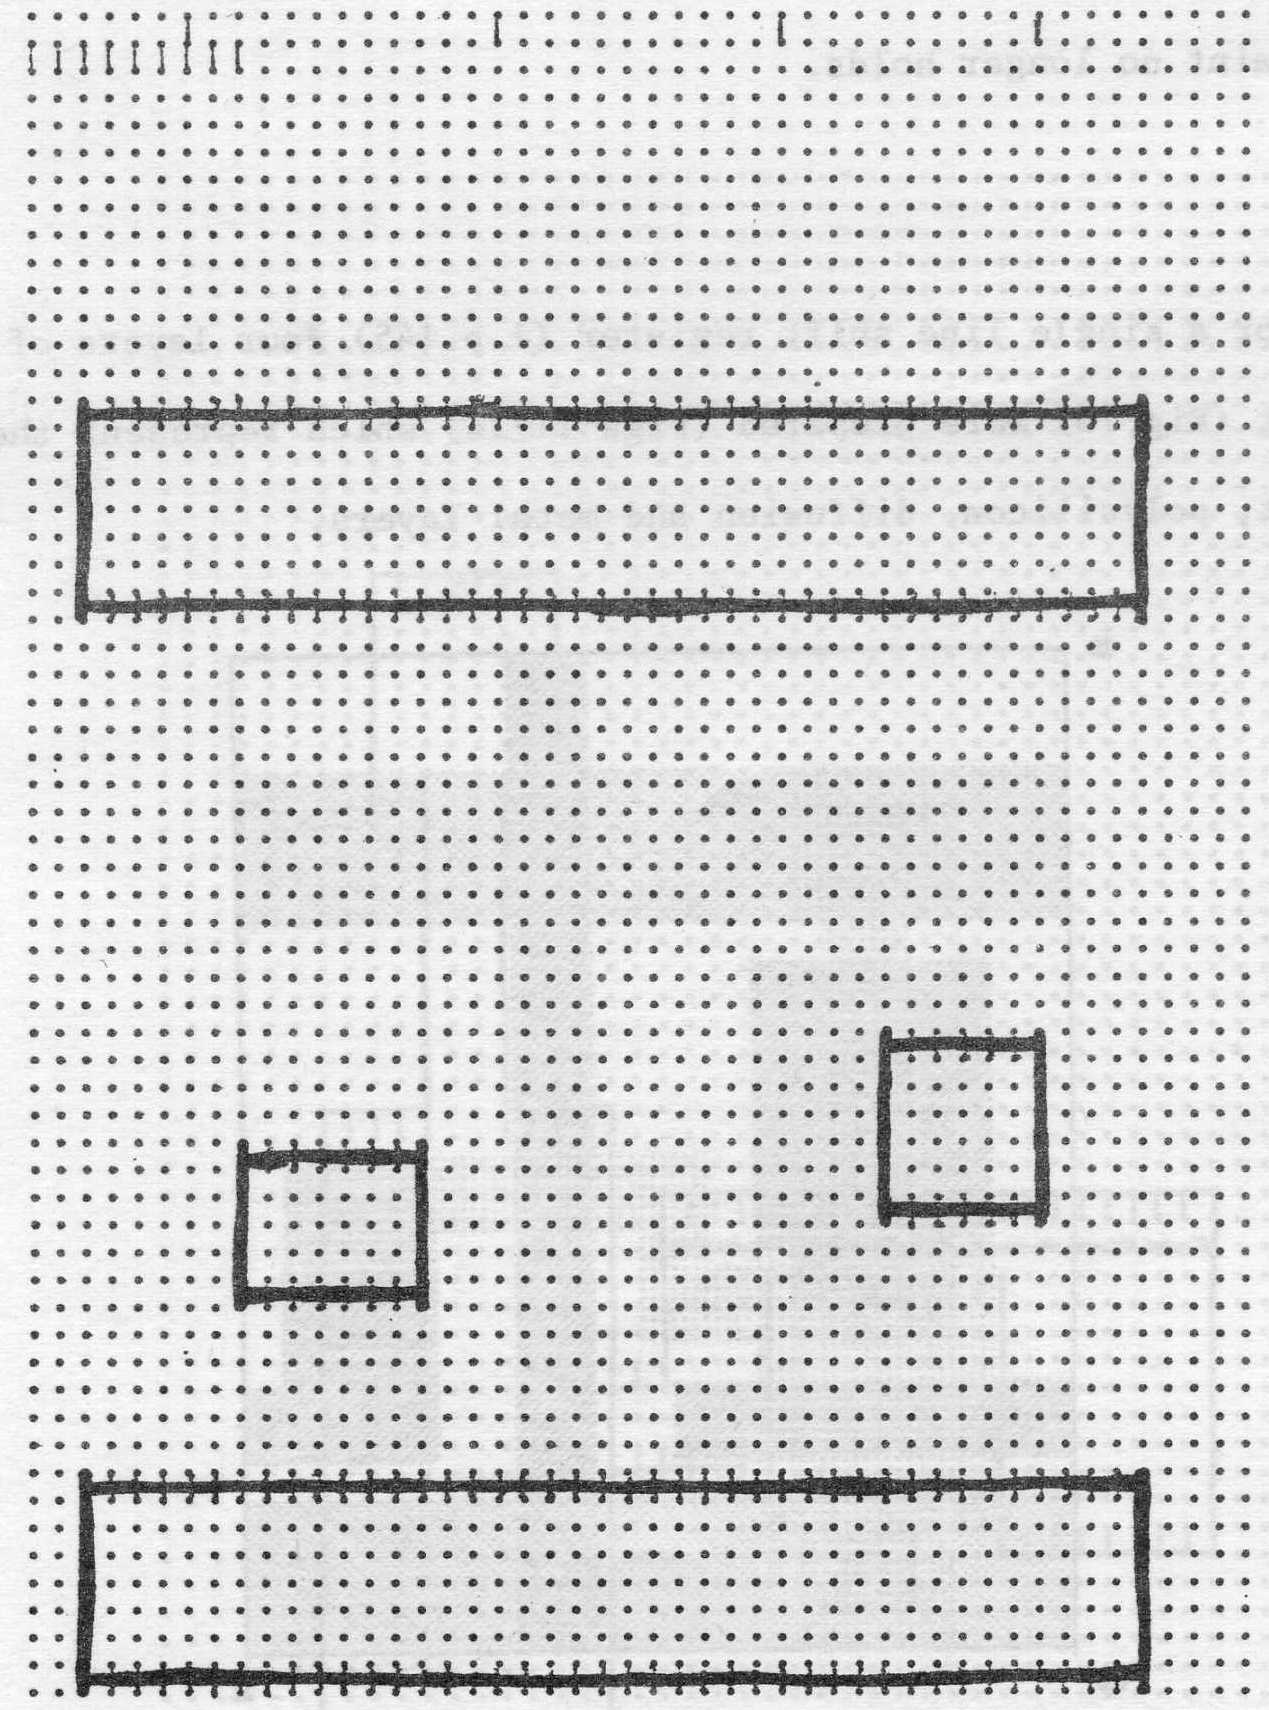
Each layer of the circuit is prepared on a separate sheet which may contain a reference number. The required diagram may be drawn first in water based ink to achieve accurate placing of the elements of the diagram (Fig 6).
Any mistakes made may be merely crossed through and the correct lines inserted. Finally the correct version is outlined in carbon pencil which itself can be erased if it proves necessary (Fig 7).
Any mistakes may be merely crossed through and the correct lines inserted. Finally the correct version is outlined in carbon pencil which itself may be erased if it proves necessary (Fig 7).
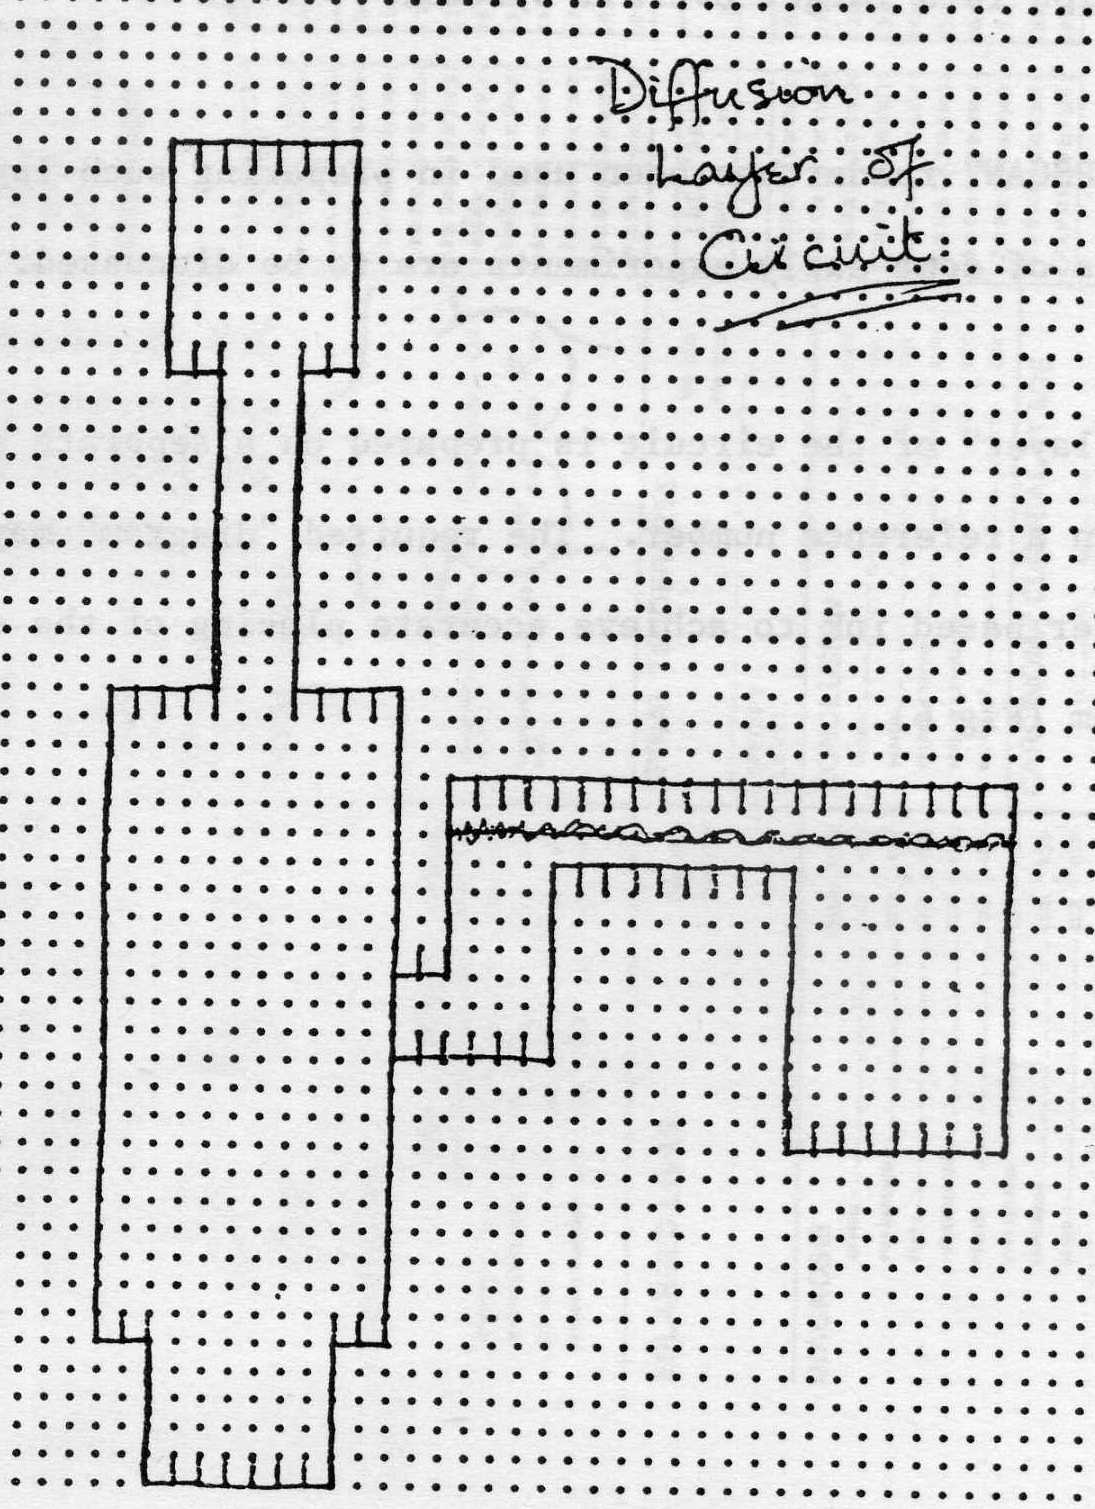
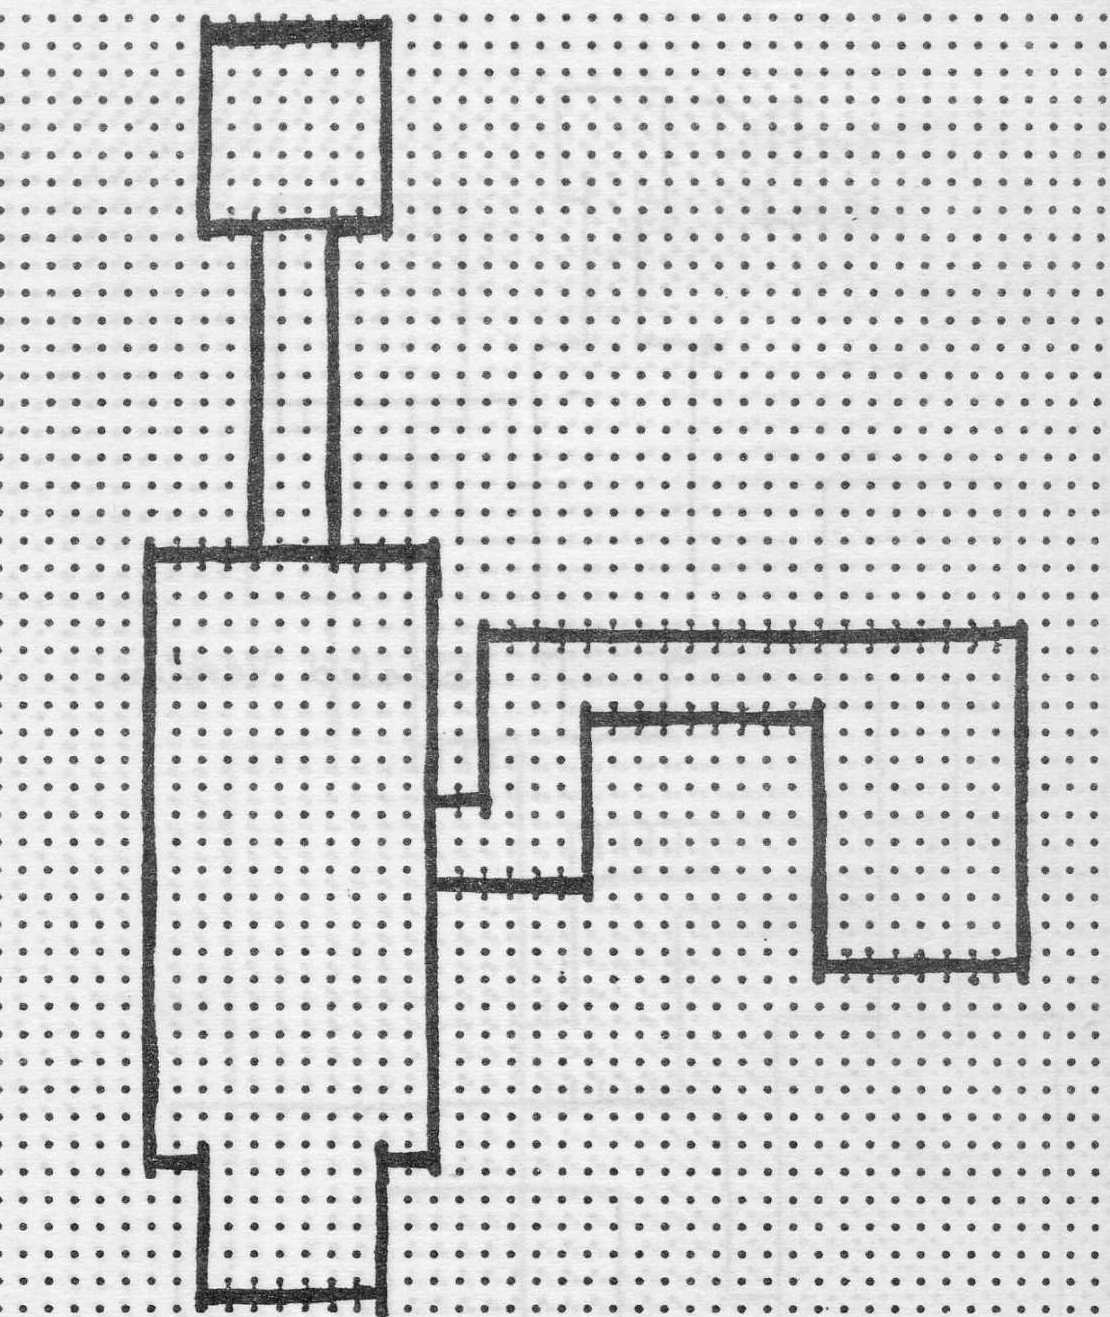
The sheet may contain annotated text in water based ink which are not regarded as part of the computer input (Fig 8).
Each layer can therefore be prepared independently of any computer system and, possibly by different people.
The scale of the drawing may be chosen will such that each mesh interval in the x and y directions may be given some nominal values. Large systems may thus be drawn on a large scale and subsequently scaled for display and final use (Fig 9).
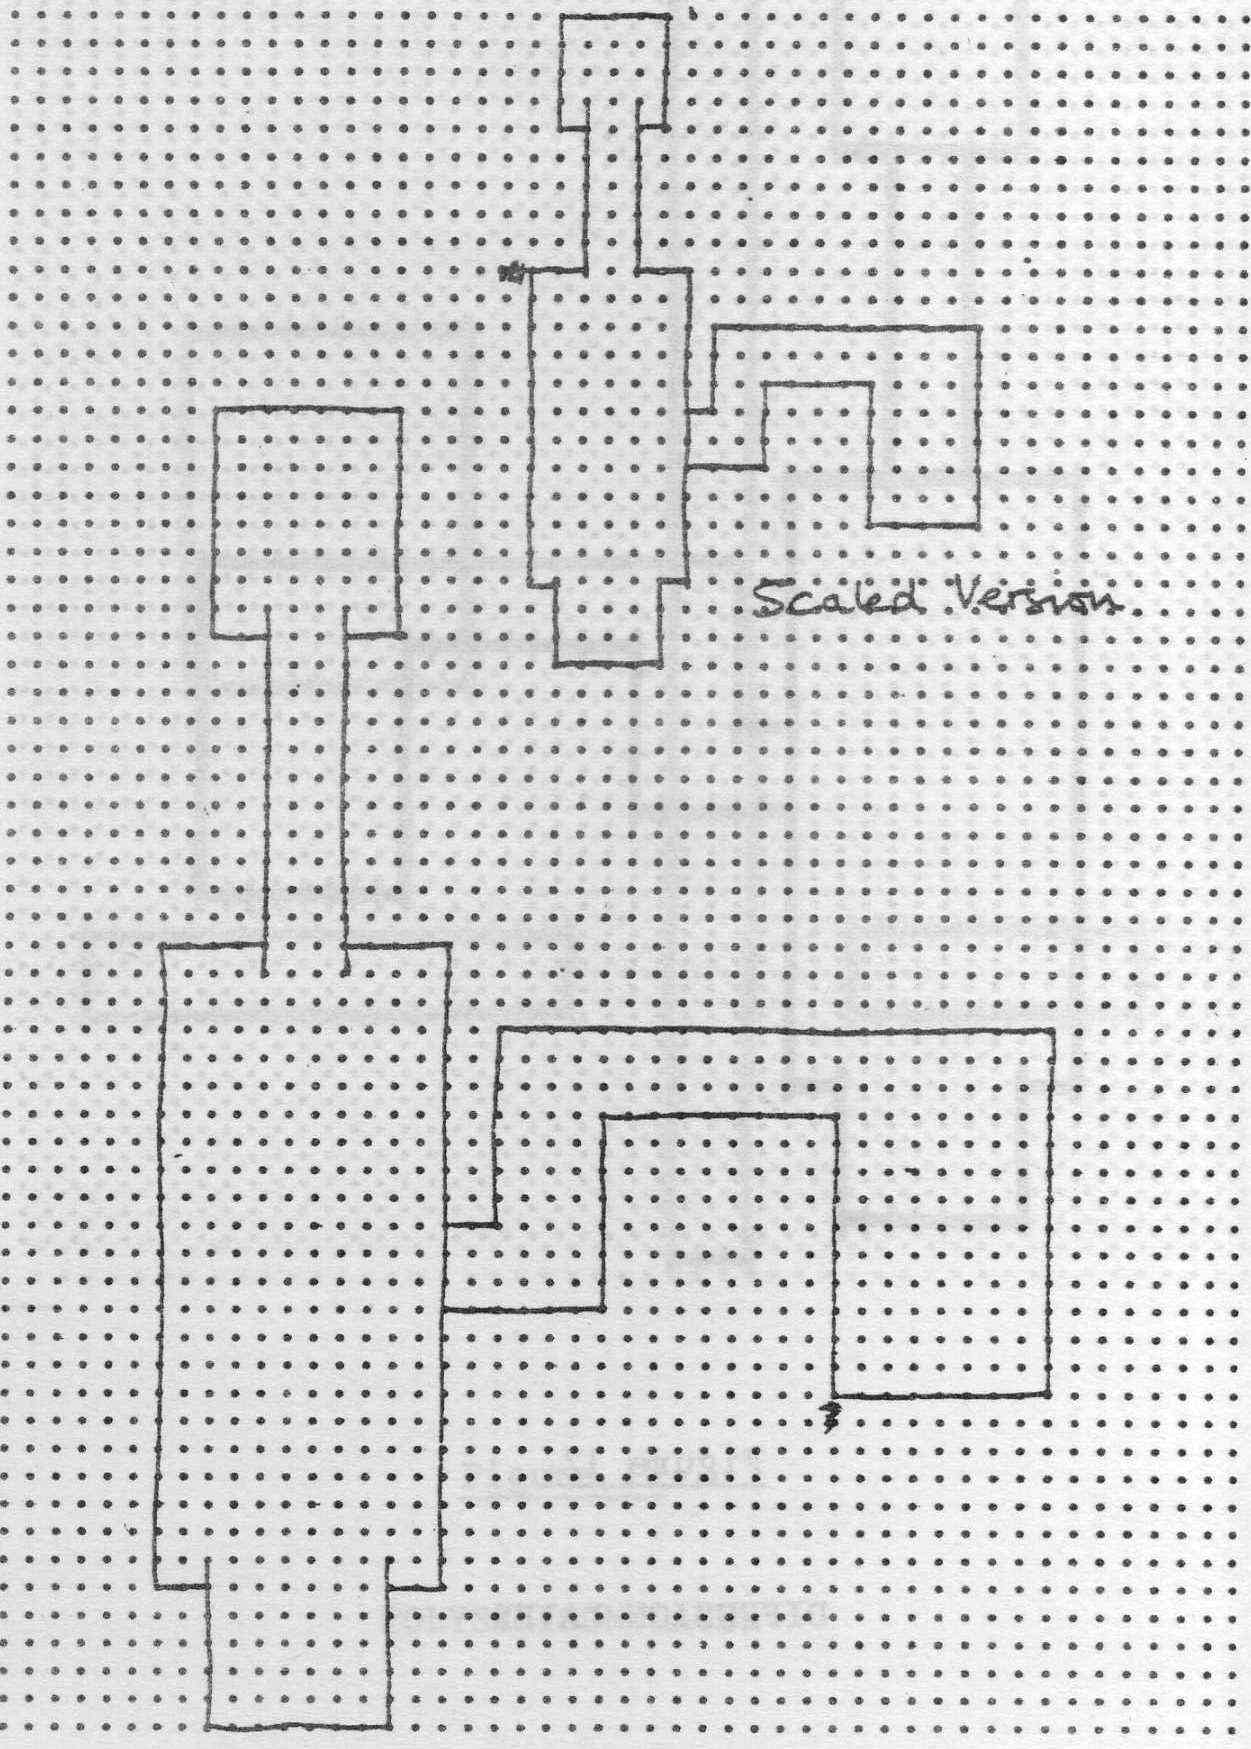
It should be noted that in the experiment individual mesh positions have to be marked separately in the y direction but continuous lines may be drawn by carbon pencil in the x direction; for more recent readers this constraint no longer holds.
4.1.2 For a single line shift register (Carver Mead & Lynn Conway, p.145) four layers of the circuit (Fig 10) were prepared (Figs 11-14) which represent the implant, polysilicon, diffusion and metal layers.
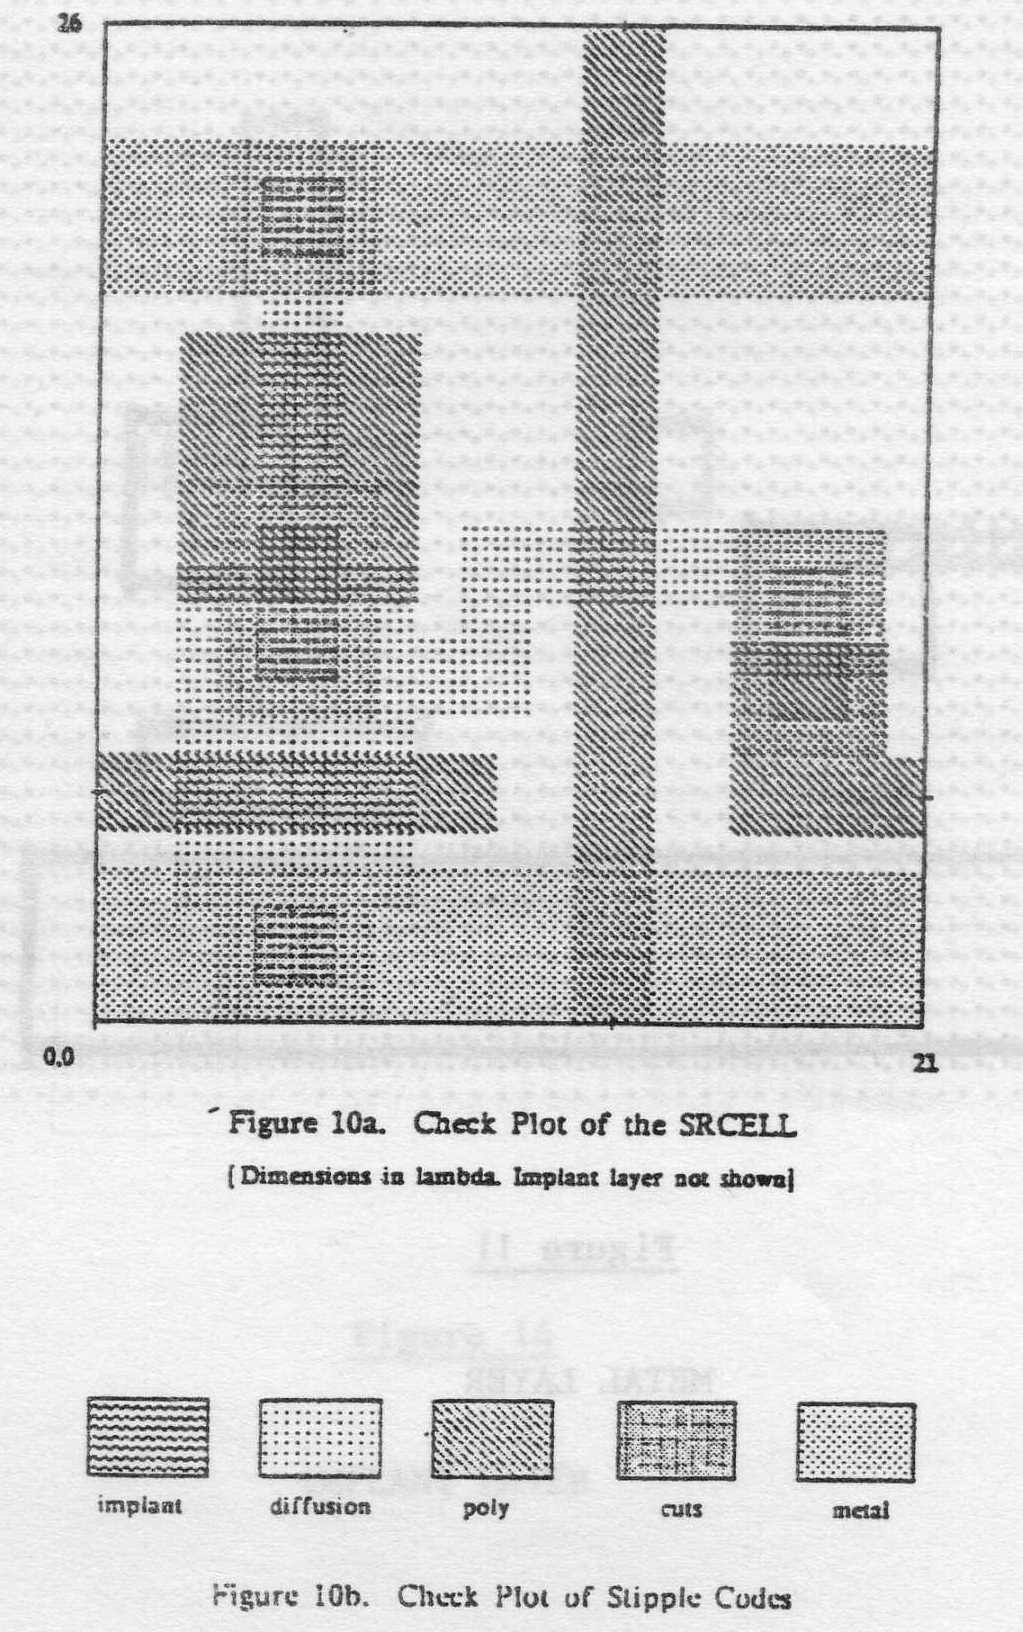
When aligned one behind the other, the relative matching of the layers may be observed by viewing against a strong light source, thus providing an additional check for positional accuracy.
With the aid of a simple interactive program the files of data for each layer may be made available for display. Each layer may be displayed on a colour monitor in a selected colour and, regions of intersection with other layers, shaded. Common cells which are to be repeated in a large scale system may be reduced and copied into their required positions.
Finally a 35 mm frame can be made of the final picture and this may possibly be used for further processes.
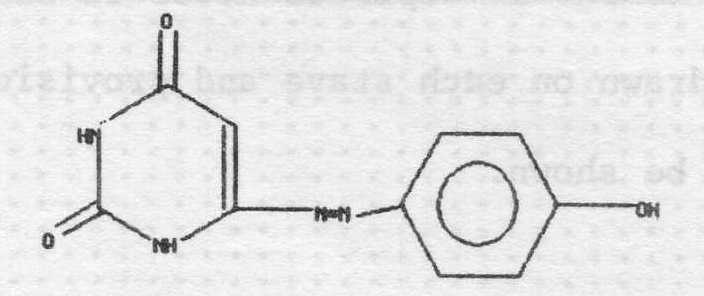
In this example use is made of a code to describe the position and type of standard chemical symbols or figures. The figures may be prepared in rough using water based pens and subsequently standard position marks and type marks made with carbon based pencil. Part of the sheet is reserved for type coding and the remainder may be used freely for drawing. Standard figures such as 6-membered rings, double bonds etc, may be shown which after input can be subsequently displayed in very precise forms ready for output to high quality plotters or readers. Figure 15 shows a selection of figures and the coded marks for type and standard position for each figure.
The figures may be combined in any order provided that there is no ambiguity due to different figures having the same standard position column i.e the same value of x.
It should be noted that all the text in the example is in water based ink and is therefore invisible to the reader. One further refinement is possible since the coded figures in the type section could be repeatedly printed in each row to guide the eye when the form is completed.
4.2.2 An example using these figures is given in Figure 16. The basic figures are shown together with text characters for the molecules. Only the figures coded are drawn subsequently by the system; the text characters, and inscribed circle etc, are added by an editing program. (Fig 17).
It is only necessary to check that the relative positions of each figure are correct, e.g that the 6 membered ring occupies 5 mesh intervals in the x direction.
A differently printed graphic sheet now available assists in the placing of figures by having coordinates printed on both the x and the y axes.
A fairly comprehensive scheme for inputting musical information via the Standard stave notation has been developed. This again uses the idea of a drawing area supported by a code or type area on the marked sheet.
The sheet can accommodate both treble and bass staves, and sufficient room for between 40 and 50 separate notes in single values or in chords. 12 notes can be drawn on each stave and provision is made for upper and lower octaves to be shown.
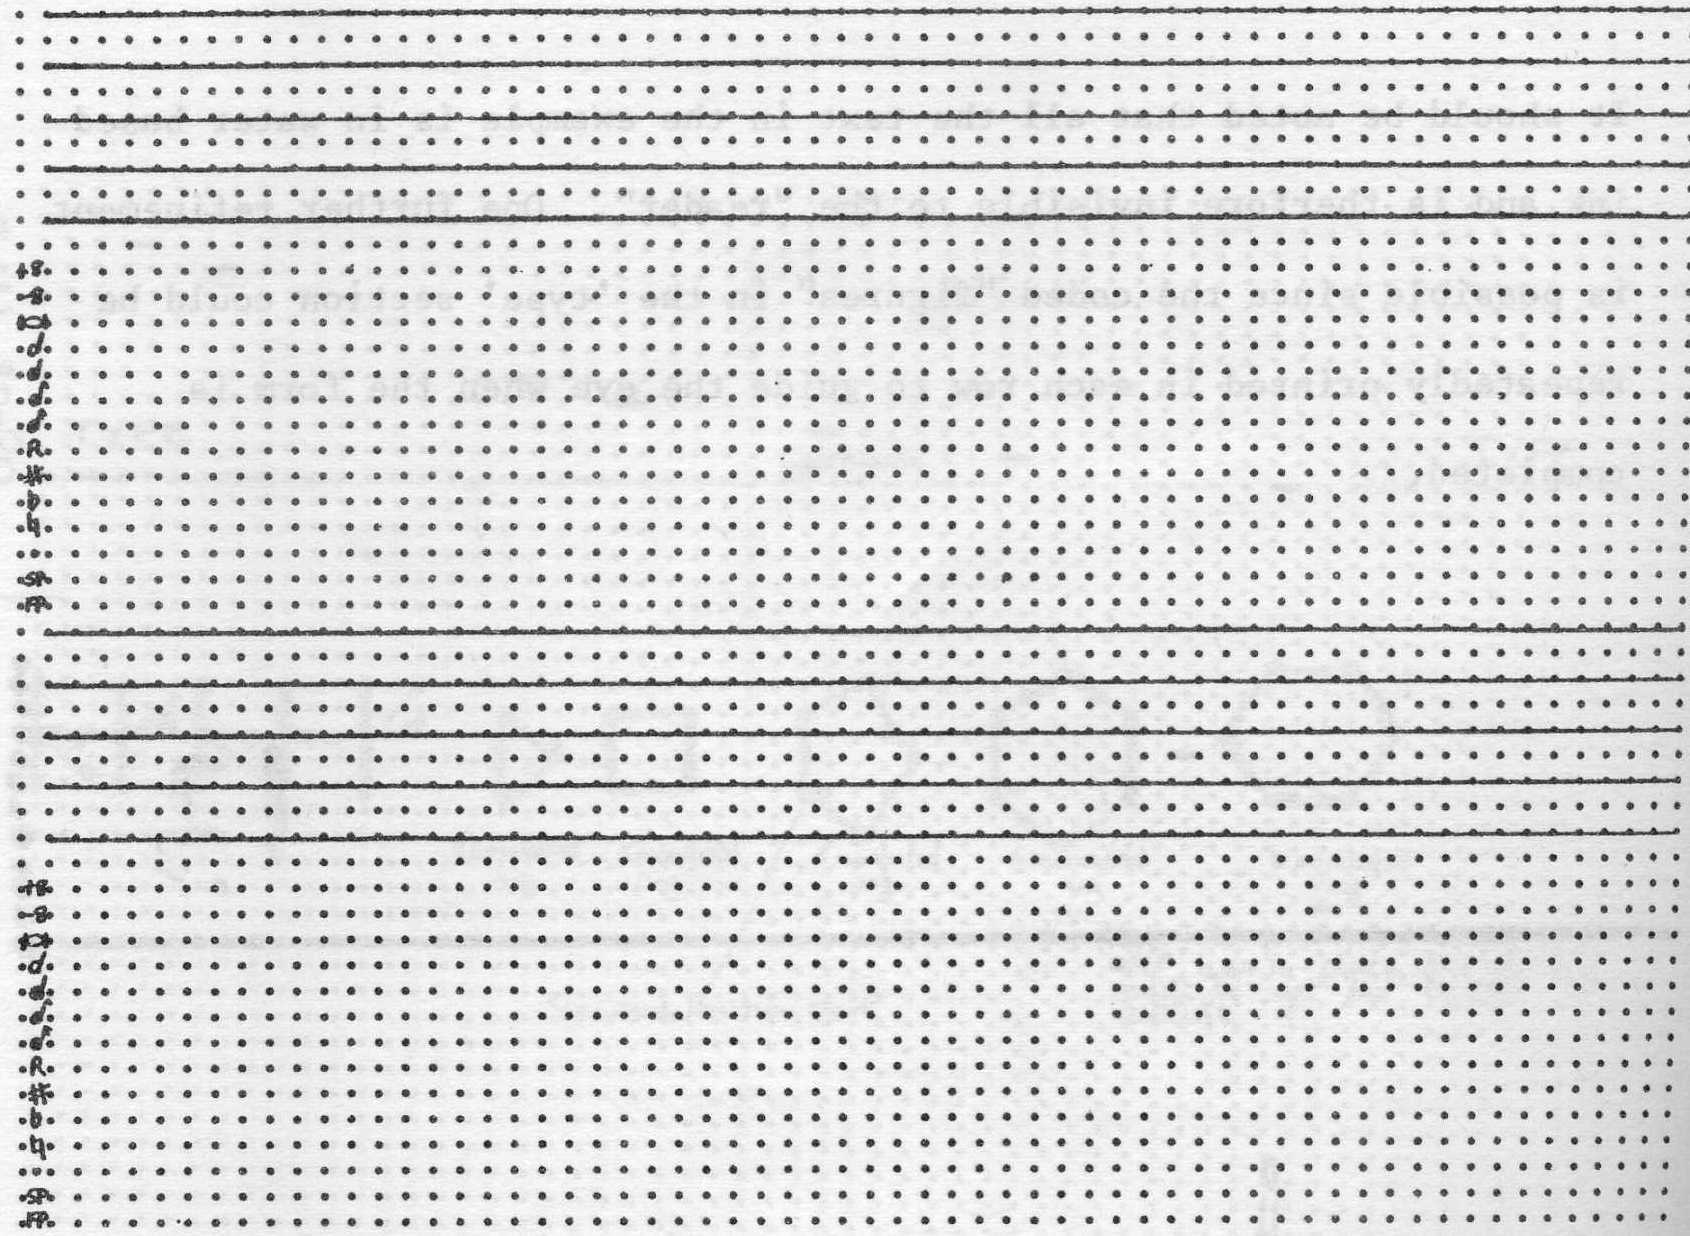
Figure 18 shows the two staves together with coded information about each note on the stave. Values are given for semi breves to semi quavers and decorations such as accidentals, dotted notes, pauses, and phrases are also included.
4-3.2 The upper stave is treated as the treble stave and the lower as the bass stave in the conventional manner.
The required Clef is indicated by showing the position on the appropriate line, e.g the g line for treble clef, and no other marks in the coded area.
The Key signature is coded by placing the sharp ♯, or flat ♭ on the appropriate line or space in sequence to indicate different keys.
The Time signature is shown by a repeated sequence of marks in the value row e.g ¾ is shown as three (3) consecutive marks in the row corresponding to crotchets ♩. No marks are necessary on the stave.
Bar lines are indicated by marking all positions in the stave with no other coded marks.
Rests equivalent to the sub set of notes may be shown as coded R with the appropriate value, e.g a quaver rest is marked R and in the same column the value quaver 𝅘𝅥𝅮 is also marked.
Phrases - Provision has been made for the starting points and finishing points of the phrase by marking in the appropriate row, SP or FP, in additon to any other marks in the same column.
Repeat marks are shown by marking both SP and FP in the same column.
Chords are shown by using adjacent columns of the coded area for values and decorations of notes of a chord ordered from the first leger line upwards, ie from c in treble clef through d to the upper g.
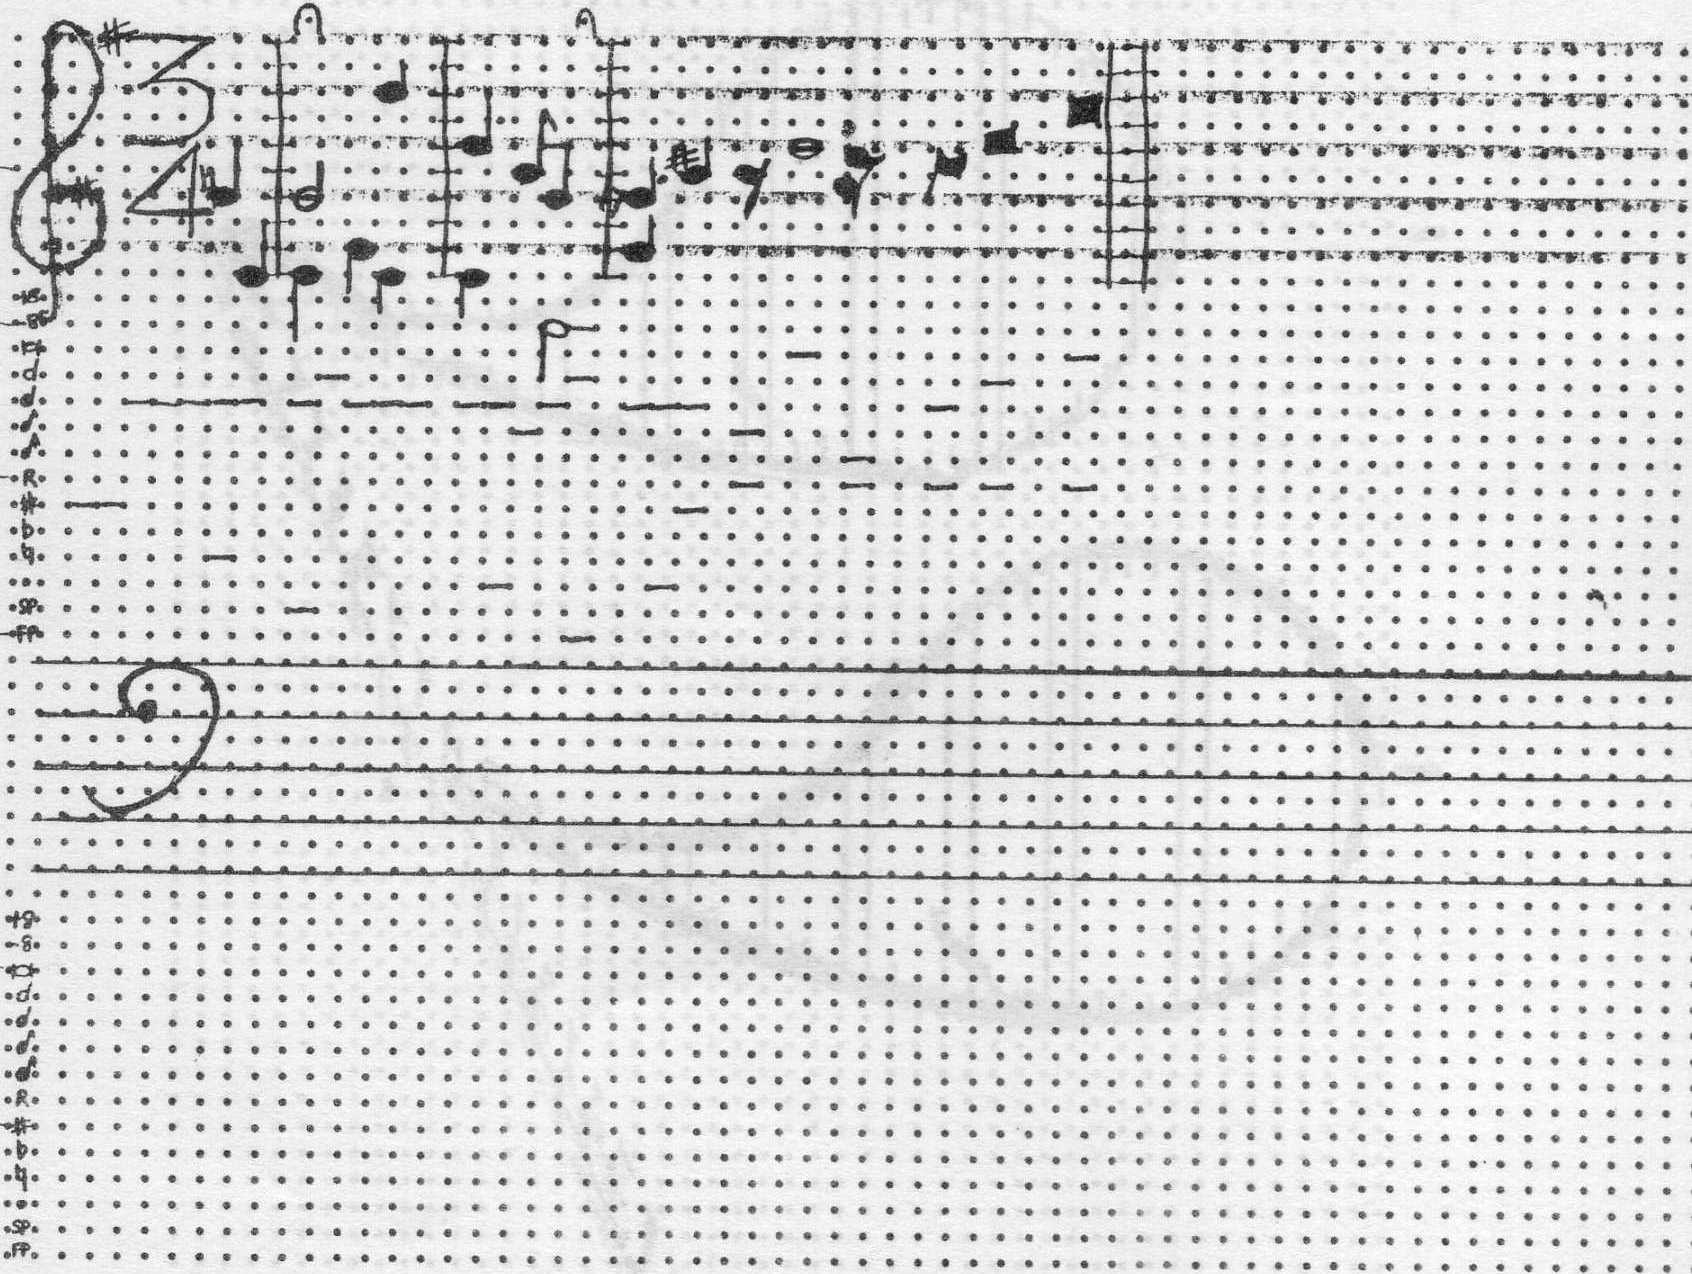
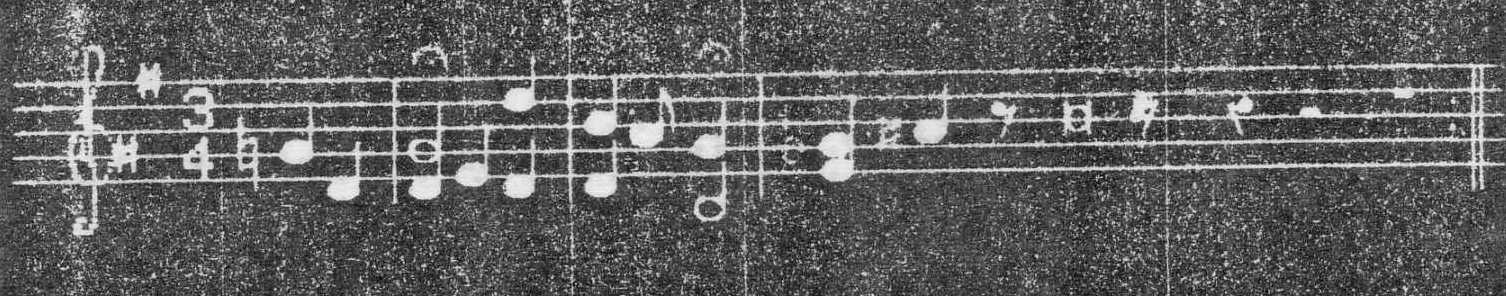
Figure 19 gives an example of a complete input showing the preparation of the proper musical notation in water based ink and the over marking in carbon based pencil together with the marking of the coded area.
The notes may be placed freely on the stave and it is only required to ensure that values and decorations are coded correctly for the given note.
4.3.3 The special symbols for clef, notes, rests, pauses, sharps, flat, natural can also be input via the optical mark reader. Each symbol may be drawn oversize on the mark sheet and then reduced for subsequent display within the computer system.
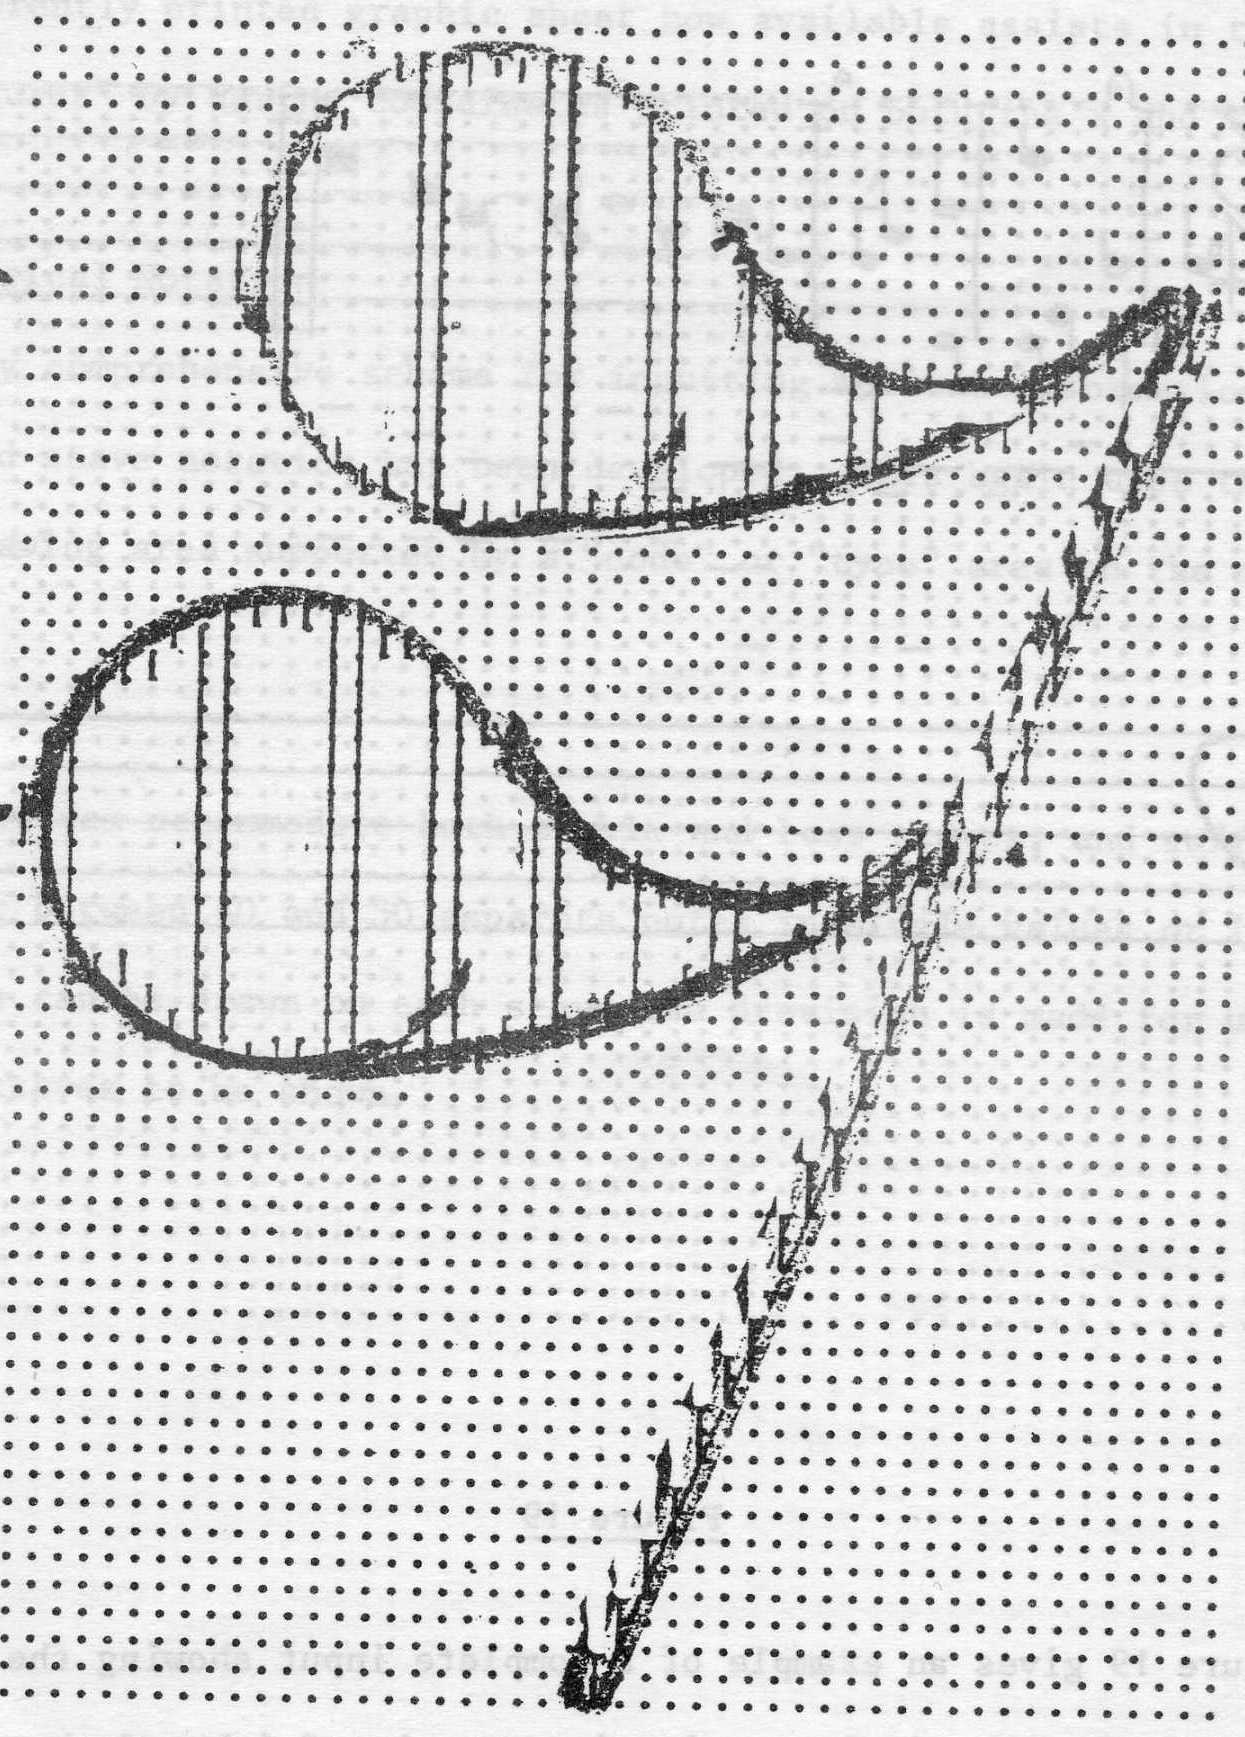
Figure 20 shows an example in which the semi quaver rest is drawn to occupy the full sheet and a minimum number of marks included so that a good definition can be obtained without redundant drawing being incurred on the display equipment.
4.3.4 The information from Figure 19 has been reproduced on a graphics display and the hardcopy is shown in Figure 21.
In producing the graphical output it is clear that this is only one form of output and we could have as easily produced sound; the coded file of information resulting from the optical mark input is available for treating in a number of different ways. For example it would be possible to examine different versions of the same exercise by students by scanning and comparing the different files.
The first two examples which gave impetus to this work are the result of the Division's interest in two topics; one in the development of software for microelectronics supported by the Engineer Board, and the other, the work being done for the Science Board's support for crystallographic data bases. The third example shows one of the many possible extensions to fields outside SRC's immediate interest. The technique has the merit that it uses standard commercial equipment which is already interfaced to computer systems. The binary input can be easily manipulated and there is economy of effort in some examples, eg chemical structures, where simple marks are sufficient to denote complex symbols. The drawings may be prepared away from the computing equipment required for display and a permanent record of input is held.
