
For readers who are interested in Visualisation. this issue should be particularly interesting. For all of you. whatever your interest, but especially new readers. please note the order form for EASE Technical Reports and the new index of past technical articles. I bid you Farewell as I move to pastures new and wish the new Editor best wishes to take the newsletter forward for you all. Happy Reading and a Happy New Year too!
The first Visualisation Community Club (VCC) meeting was held at Rutherford Appleton Laboratory (RAL) on 11 October 1991. Around 50 people, about half total membership, attended. The meeting started with welcome and introduction given by Dr David Boyd, Head of RAL's Computational Modelling Division, who chaired the meeting. Dr Boyd gave the background of the VCC and explained its role and organisation within the context of other community clubs. He also listed sources of funding, as well as EASE activities and projects in visualisation.
Rajka Popovic (RAL) presented statistics from the club members survey. If a profile of a typical VCC member were sought, the results from the survey would show that approximately a third of the membership were involved in Computational Fluid Dynamics (CFD), a third used in-house software and a half were using SUNs as visualisation hardware. Stardent's Application Visualisation System (AVS), UNIRAS and apE were the most frequently mentioned software, while VAX, Silicon Graphics, Stardent and various PC systems were the most frequently mentioned hardware.
Dynamic Molecular Dynamics, a talk by Dr Keith Refson (Oxford University) discussed advantages of using visualisation in molecular dynamics. Some of those include:
Furthermore, visualisation helped Dr Refson gain an insight into his simulation results: numerical results of simulation can not alone show how molecules move - and this was a vital point in understanding the behaviour of magnesia molecules in the hydrated clay, which had so far been theoretically simulated and experimentally measured but not understood.
Dr P Milne (Strathclyde University) talked about how they use visualisation for Digital Terrain Modelling and Flooding. Work on terrain flooding is especially important because Glasgow Airport was built in a flooding area (the runway goes almost to the verge of the river bank!). Here, visualisation is applied to flood risk assessment, flood warning and evaluation of a proposed flood control scheme. The package runs on PC systems and is sufficiently robust to be of general purpose. Indeed, it has been successfully used by an archaeological expedition to discover a pharaoh's tomb!
The Visualisation of Blood Flow Using Magnetic Resonance Imaging (MRI) was a talk given by Martin J Graves (Guy's Hospital). He presented the state of the art in this area and listed some applications of the method. All are of major importance in saving a patient's life: angiographic screening, stereotactic radio-surgery and multimodal surgical planning. Even the fact that MRI (as far as it is known, an inherently safe, non-invasive technique) can substitute the state-of-the-art angiography (an invasive and not 100% safe X-ray method) shows the importance visualisation can have.
Professor I M Smith (Manchester University) gave a talk, Animation in Solid Mechanics, which led to a conclusion that only animation can give a true impression of evolutionary processes in solid objects undergoing strain. To this end a special purpose PC package was written. Through a clever use of colours in an animated sequence of a deformation, the researcher is enabled to monitor several aspects of the process. An effective demonstration of the software was presented at the end of the talk.
series of awareness events. Norman Wiseman (NERC) discussed visualisation in general in a talk entitled, Visualisation - State of the Art. Having discussed the promises of visualisation, Mr Wiseman turned to tools currently at hand and set them against the requirements of his users. The gap between those two is striking. To illustrate the point, Mr Wiseman described the minimum features NERC scientist expect to find in a visualisation system. They are:
Naturally, these minimum requirements are far above anything currently on offer. Therefore, a gradual evolution is needed, with VCC club playing an important role in bringing about the nirvana state, where users have what users require and, presumably, a head of a computing service has nothing to worry about!
J R Gallop (RAL) outlined visualisation activities of the Advisory Group in Computer Graphics (AGOCG). After explaining role and activities of AGOCG in general, he concentrated on visualisation. In February 1991, AGOCG organized a workshop which brought together a number of visualisation experts, users and researchers with the aim of assessing the state of the art in visualisation and making recommendations to the community. The workshop produced two publications (Scientific Visualisation: Techniques and Applications and Introduction to Visualisation, both to be published by Springer-Verlag) and some recommendations.
Two of the most important recommendations of the workshop are:
To implement these recommendations AGOCG decided to evaluate existing visualisation application builders; carry out an investigation into distributed visualisation and visualisation data formats and organize a Some of these activities are already under way - the results of the evaluation of visualisation application builders, for instance, should be available early in 1992.
The meeting was concluded with a discussion of the future programme of VCC. Dr K W Brodlie, Chairman of the VCC Steering Group, opened the discussion by highlighting the role of the club and listing some of the existing plans (eg assessment of visualisation software, one-day introductory and five-day AGOCG post-graduate courses, etc) and possible activities. A lot of useful comments and suggestions were offered from the participants. Many of them were suggestions on topics for future courses, seminars and workshops. For instance:
A need for support and research in effective use of colour was identified alongside with the need for support for standardisation and integration of standard subsystems in visualisation.
All the ideas and suggestions put forward had been noted and were subsequently submitted to the VCC Steering Group at their November meeting. There they were used to produce the future programme for the Club, which, judging by the discussion, will keep us all quite busy!
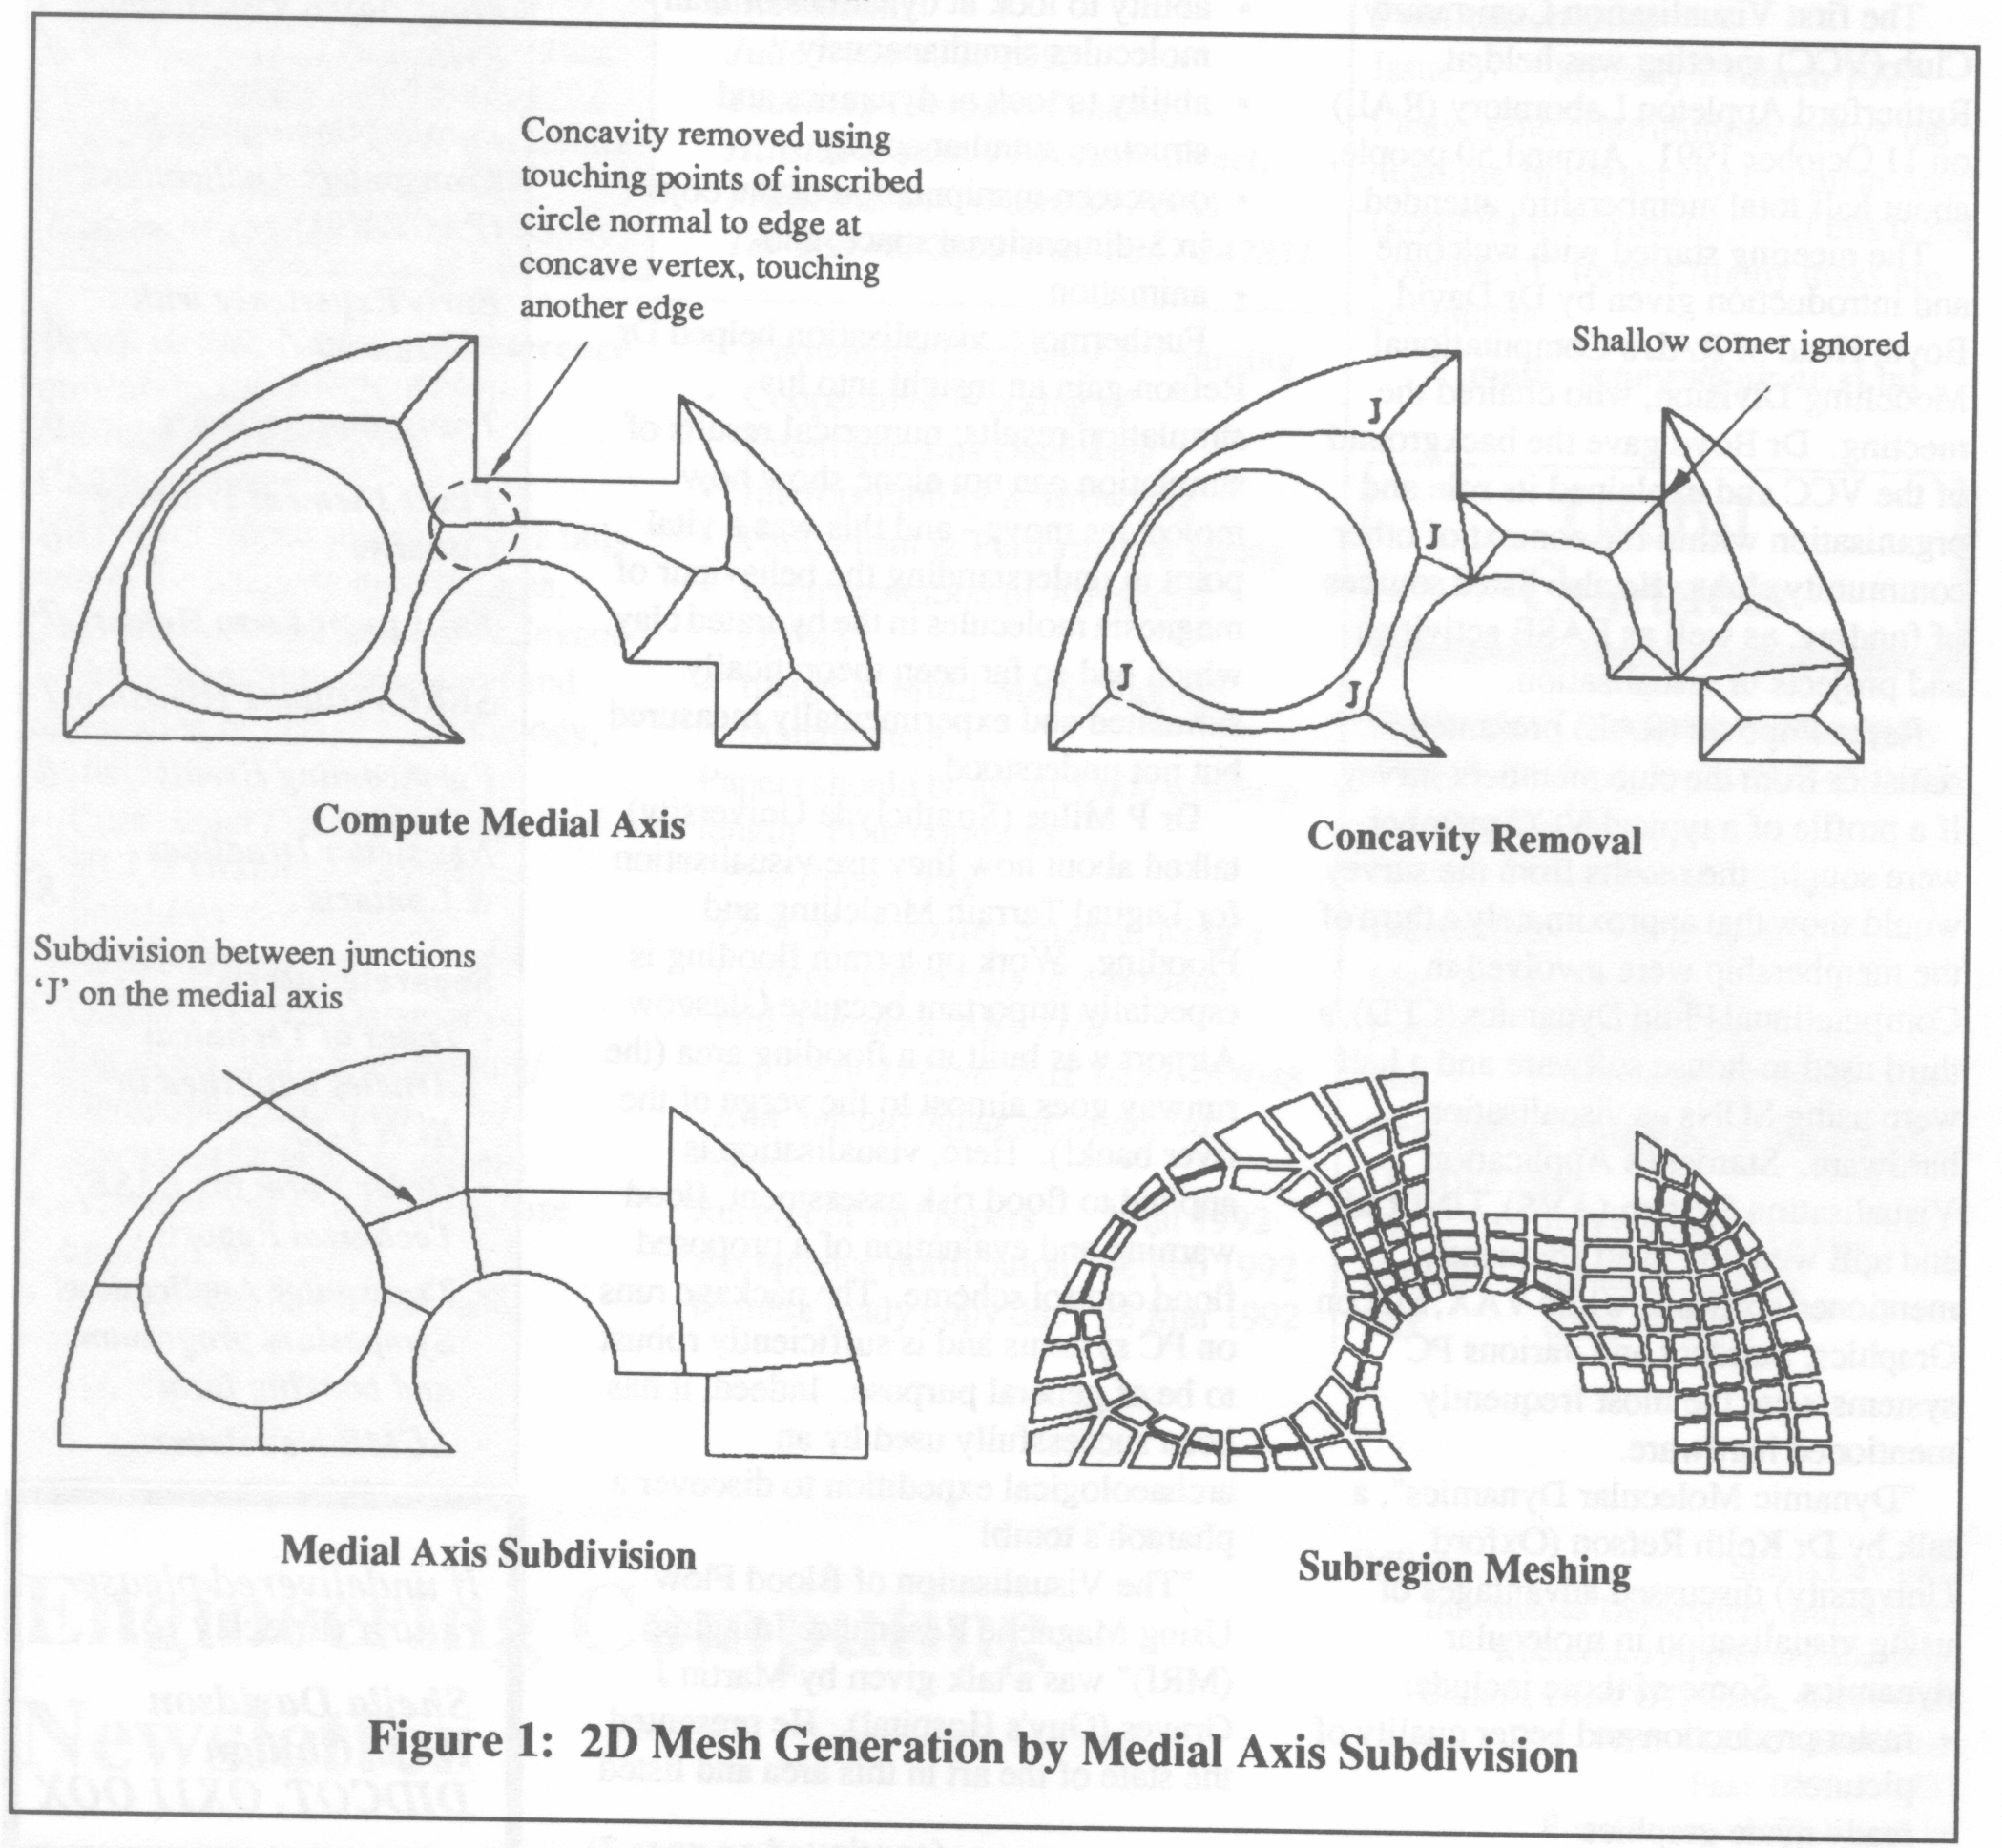
A multi-disciplinary research group at Queen's Belfast has been investigating methods for the automatic generation of finite element and boundary element meshes in two and three dimensions. The 2D procedure is now fully automatic and substantial progress has been achieved in 3D.
The approach employed is to separate mesh generation into two steps - the subdivision of complex objects into simple convex subregions, followed by meshing the subregions with relatively conventional techniques. Automatic subdivision is based on using information contained in the Medial Axis of a 2D object or the Medial Surface of a 3D solid.
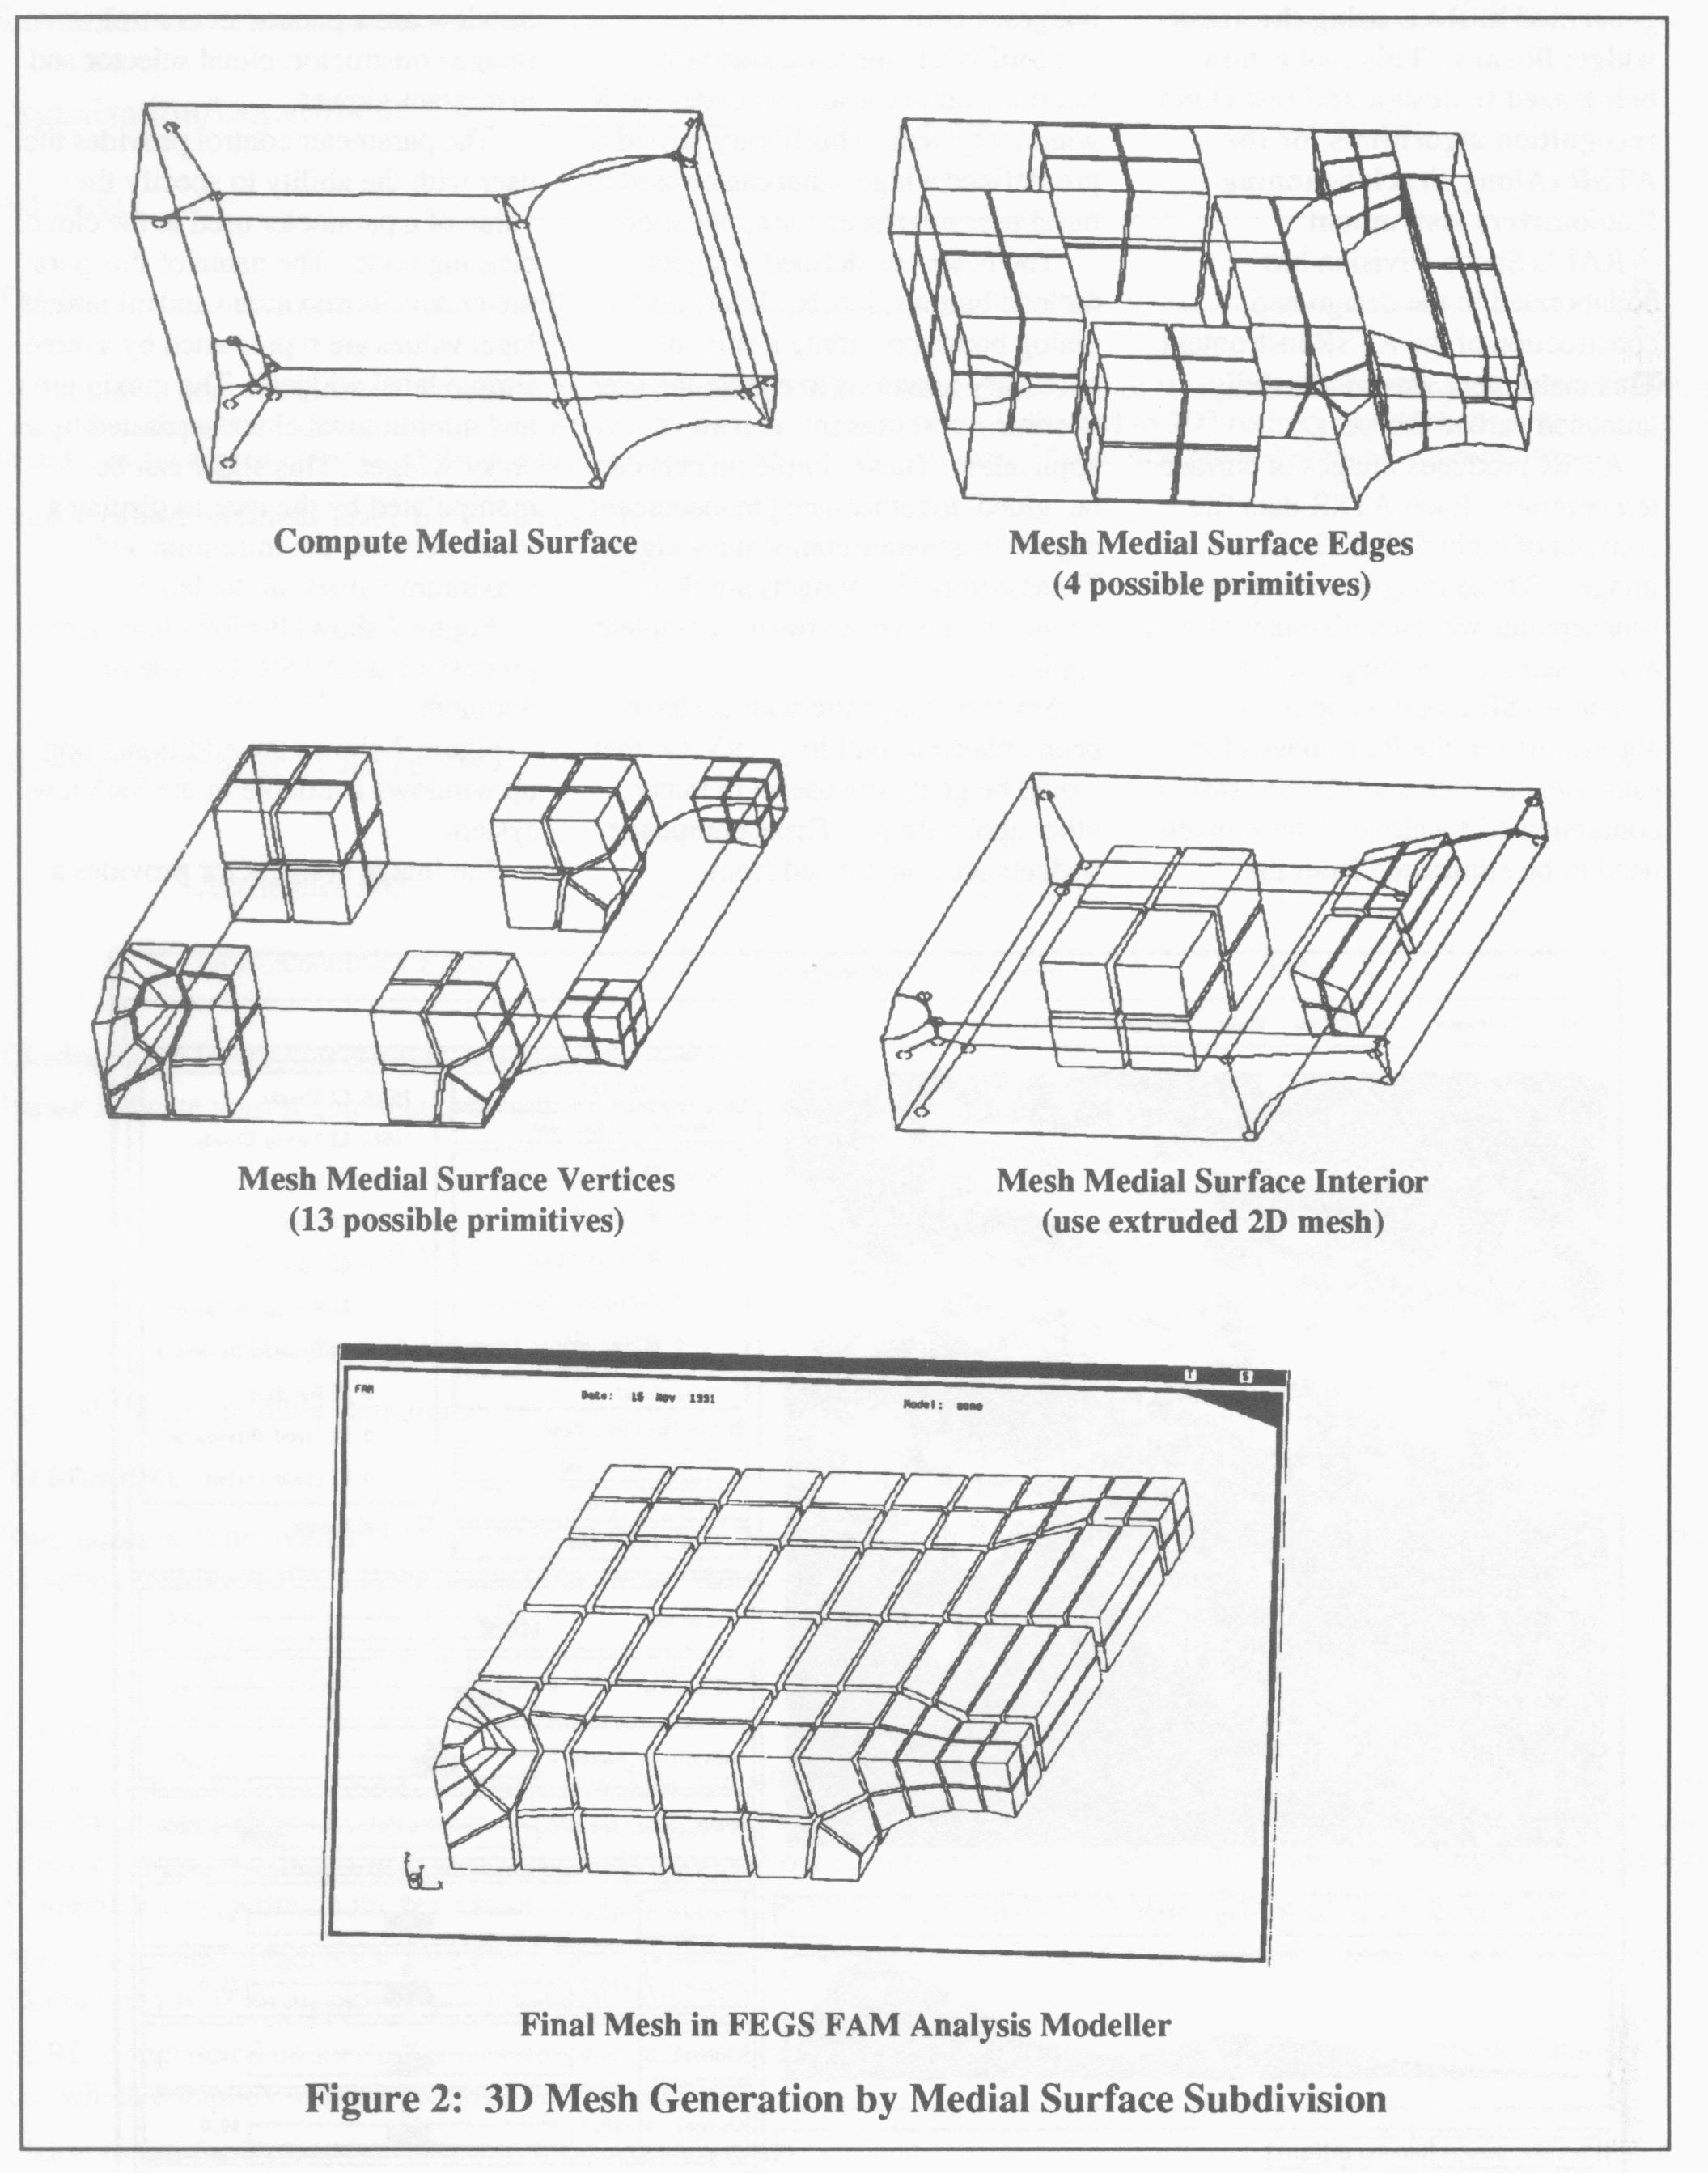
The Medial Axis of a 2D object is the locus of the centre of an inscribed disk of maximal diameter as it rolls along the object interior. The Medial Surface of a 3D solid is the locus of the centre of an inscribed sphere of maximal diameter as it rolls around the solid interior.
Figure 1, below, illustrates the procedure in the 2D process, which has been fully automated.
Using shape information derived from the Medial Axis of the object, only simple rules are required to define the subdivision boundaries and to recognise the mesh pattern required within the subregions. The resulting mesh of quadrilateral elements contains minimal distortion and is well structured.
The 3D approach is summarised in Figure 2. The current state of progress in 3D is that tools have been developed to:
For a large class of objects, a procedure for meshing the medial surface interior, edges and vertices with hexahedral brick elements has been identified. This procedure is now sufficiently well understood to guide manual and semi-automatic mesh design in commercial FE preprocessors.
SatView is an interactive tool for Climatologists which has been generated at RAL using the Motif widget library. This tool is now being used to design and test cloud recognition algorithms for the ATSR (Along Track Scanning Radiometer) instrument.
RAL's Space Division has collaborated in the design and construction of the ATSR instrument. This instrument was successfully launched earlier this year.
ATSR produces images of surface temperature. Each ATSR data file consists of eight 512×512 pixel images. These images correspond to four separate wavelength images taken at two separate viewing angles.
The ATSR cloud recognition algorithms use the four images for each view to seek and identify pixels contaminated by cloud. These pixels need to be eliminated from the processing required to produce high quality Sea Surface Temperature images.
Motif is an emerging standard interface library available under the X window system. This library provides predefined widgets that can be used to build user interfaces for applications.
The basic predefined widgets include buttons, labels, sliders and dialog boxes providing a suite of necessary functions to enable the user to control and interact with an application. These simple objects can be glued together using management objects to generate composite widgets. These composite widgets are then collected together to form a complete application.
Several composite widgets have been created in building SatView that would be generally useful in many other applications. These composite widgets are constructed from groupings of the basic widgets. The major composite widgets built for SatView are a parameter control, image constructor, cloud selector and histogram viewer.
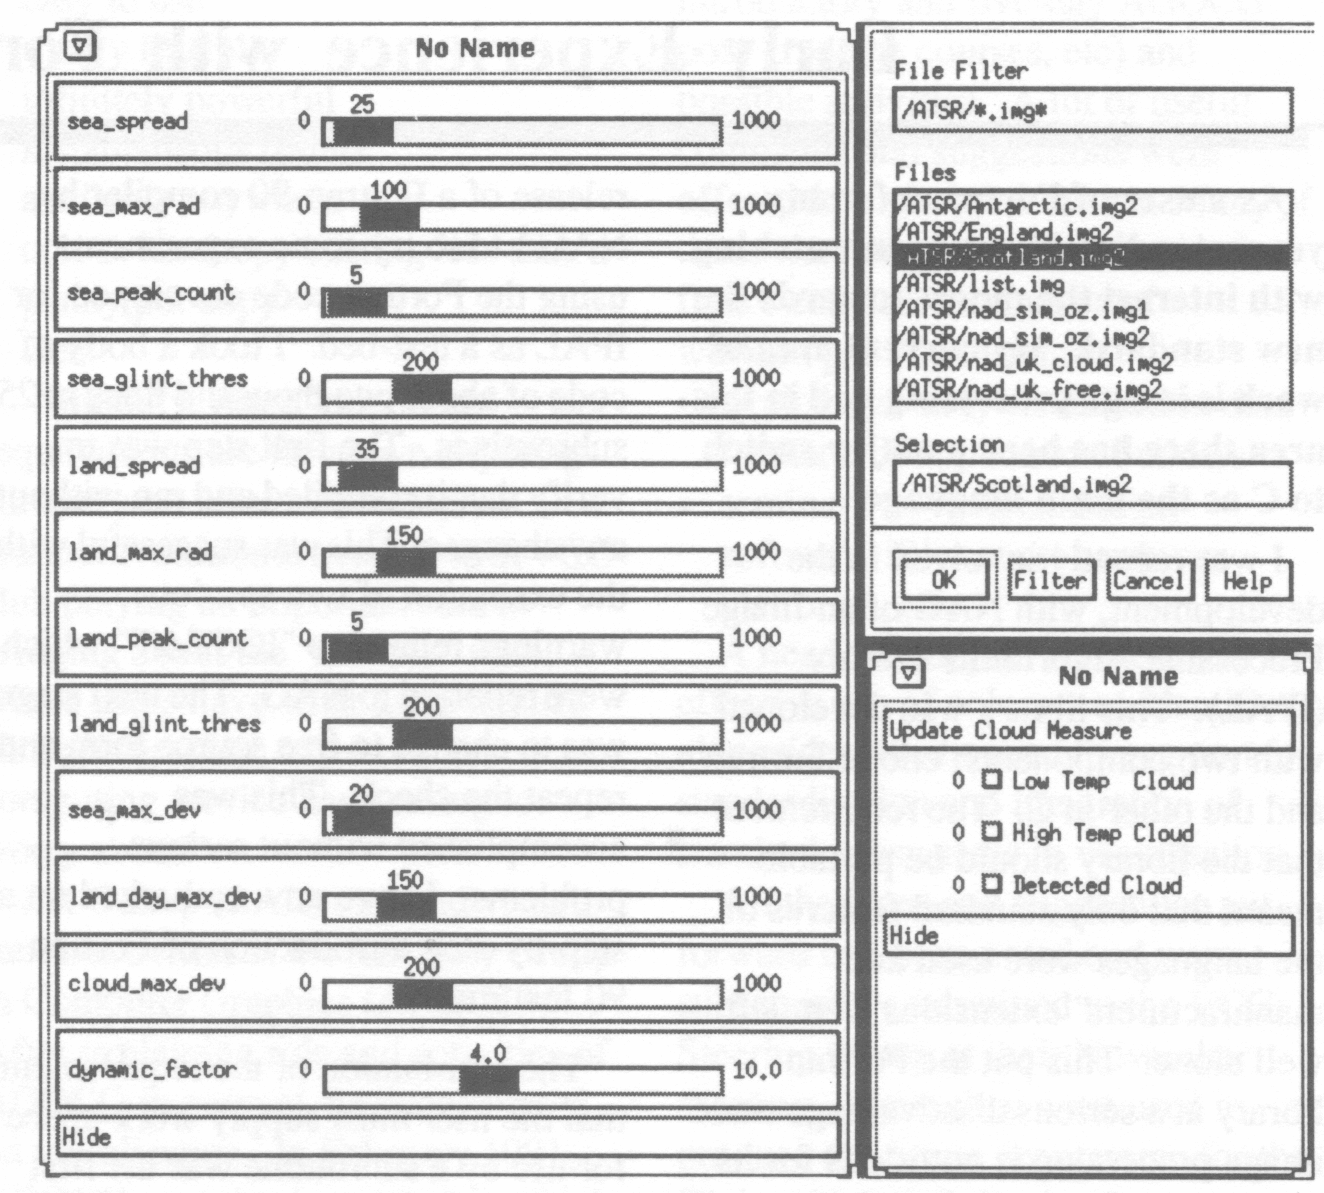
The parameter control provides the user with the ability to specify the value of a parameter used in the cloud clearing code. The name of this parameter, and its maximum and minimum legal values are represented by a three simple label widgets. The maximum and minimum label are separated by a slider widget. This slider can be manipulated by the user to display a value between the minimum and maximum values on the labels.
Figure 1 shows the SatView system processing an ATSR data file of Scotland.
Figure 2 shows the additional pop-up windows available in the SatView system.
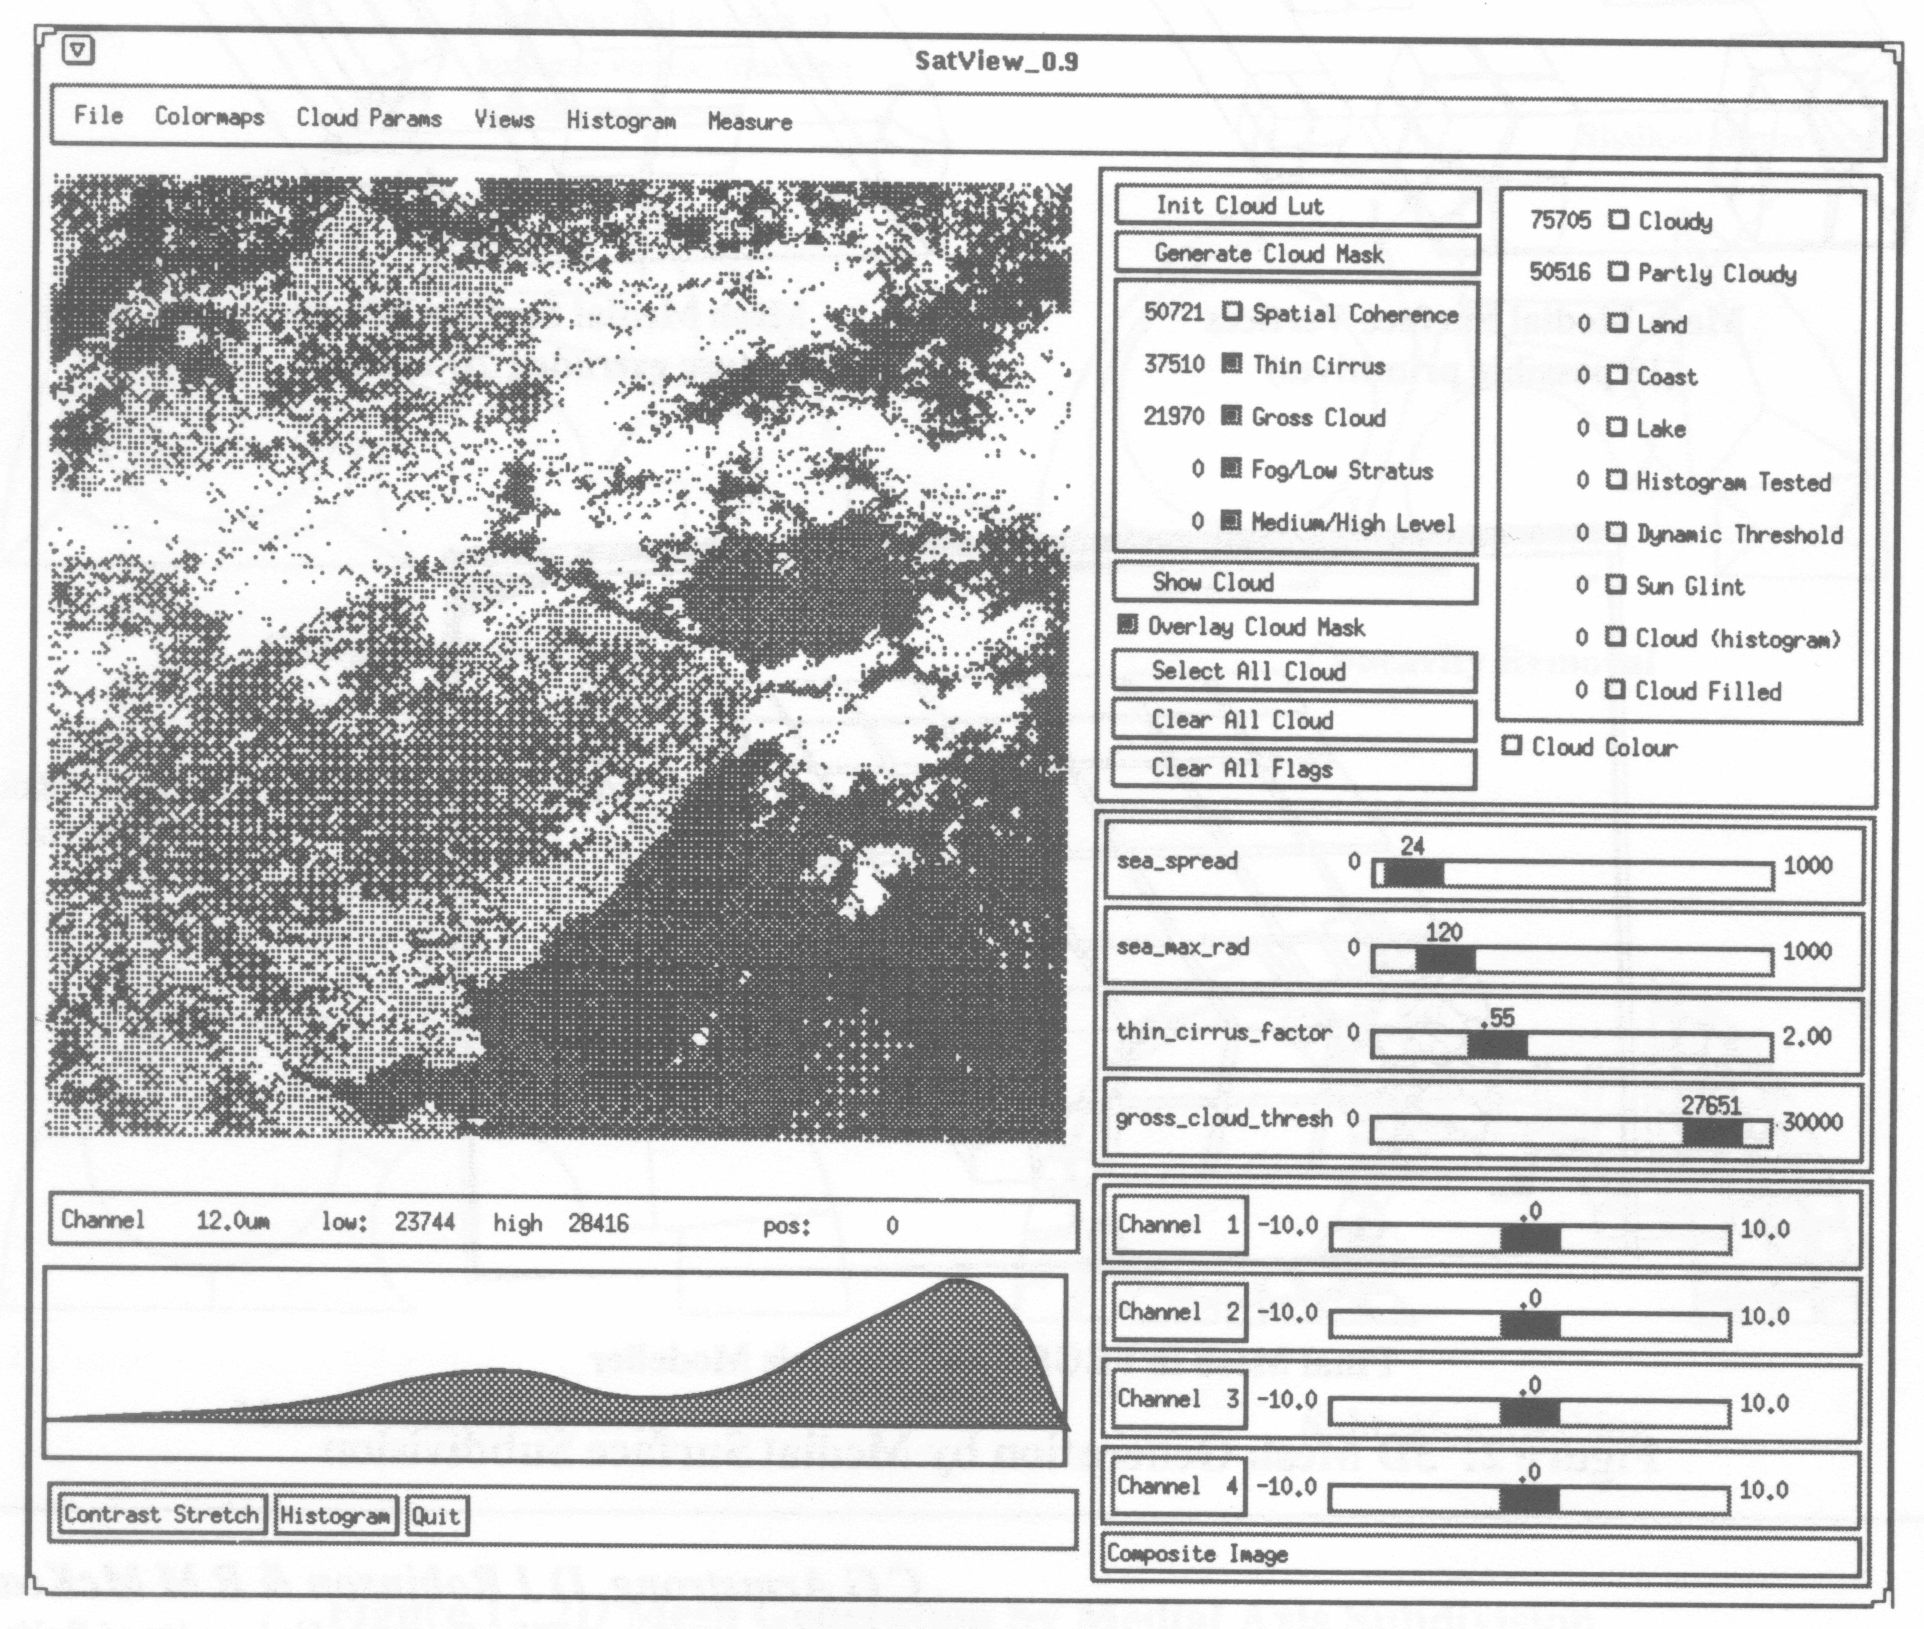
The image constructor provides a method by which each of the four 512×512 data images, known as channels, in the nadir views can be viewed individually or combined to form a composite image. Each of the four images has a button to enable its selection for viewing and a slider control. The slider control, as in the parameter control, provides a minimum and maximum label with a slider widget in between. Finally a button, Composite Image, is provided that generates a combined image using the slider values for each of the four images to combine contributions from each image into the composite image.
The cloud selector displays the 15 types of cloud information generated by the ATSR cloud code. This information is displayed as a label, toggle, label group of widgets. The first label contains the number of data points available for display, the toggle is a mechanism to switch on/off the display of these data points and the second label contains the name of the data point (eg Cloudy, Partly Cloudy, Thin Cirrus...). Any of the cloud data points can be individually selected and viewed as a 512×512 image, or data points can be combined together.
The histogram viewer provides a display of the distribution of data points being displayed in the 512×512 viewing window. Initially the histogram is generated using the minimum and maximum vale of the data being displayed. The user can interact with the histogram to place new minimum and maximum values. This enables the user to stretch the histogram to enhance the image, or to apply thresholds within which the image is displayed.
In operation SatView reads in ATSR data files and enables any of the four nadir images to be viewed. Image processing operations can be carried out on these images to enhance features such as cloud, land or sea temperatures.
The ATSR cloud recognition code has been incorporated into SatView to enable the algorithms to be applied and their results viewed. Cloud types can be viewed separately, overlaid onto any other image available in SatView.
Sliders are provided to enable parameters used within the cloud code to be freely altered. This enables the user to alter the actions of the cloud code and view its effects. This can be used to tune the cloud algorithms and then assess their quality. Calibration parameters are used within the cloud code to handle different latitudes/longitudes and seasonal changes. Satview enables these parameters to be generated and their quality assessed.
The User can supply thresholds to the histogram to identify cloud within images. This level of cloud can then be automatically measured against any of the cloud type data generated by the cloud code.
The current version of SatView runs on an IBM RS/6000 Model 520 (30 MIPS) workstation and can calculate the cloud in just under 20 seconds. This is significantly better than the Micro VAX 3100 Model used for the complete ATSR data processing System which takes 120 seconds to calculate the cloud. Research is currently investigating the possibility of adding a parallel processing capability to the RS/6000 workstation. This can exploit the parallelism within the cloud algorithms to reduce the current calculation time. Initial work on this part of the project has been able to reduce the processing time to calculate the clouds to five seconds using 32 Transputers. This time should reduce further with the application of more Transputers or faster parallel processors. With this additional parallel capability a full real-time interactive tool could be envisaged.
SatView provides a high level of interactivity allowing the user to investigate the effects of each of the cloud parameters on the cloud generated by the cloud clearing algorithms. Individual cloud tests can be monitored and new tests can be investigated using the available User can apply thresholds to the histogram to identify cloud within capabilities.
Source code for the Motif based user interface used to build SatView is available from RAL on request. This source code contains the complete user interface system without the ATSR specific input and cloud clearing routines. This source code will provide a useful insight into using Motif for building application user interfaces.
As a user of Fortran of many years standing I have been watching with interest the moves towards the new standard. My current area of work is image processing and in this area there has been a major switch to C as the main language.
I was recently involved in the development, with NAG of an Image Processing Algorithms Library (IPAL). This library was developed with two components; one in Fortran and the other in C. The requirement that the library should be portable meant that only standard features of the languages were used and manufacturers' extensions were left well alone. This put the Fortran library at a serious disadvantage since image processing is notorious for its greed for memory. In addition the use of structures in the C library simplified the passing of complex images where the pixels were not represented by simple data types and the image is not a simple rectangular array of data.
Fortran-90 promises to remove these disadvantages, so I have taken the opportunity presented by the release of a Fortran-90 compiler by NAG Ltd to try some experiments using the Fortran code developed for IPAL as a test-bed. I took a body of code of about two thousand lines in 25 subroutines. The first step was to verify that it compiled and ran without any changes. This was successful with the exception of two spurious warnings related to IOSTAT which were reported to NAG. The next stage was to change to free source form and repeat the check. This was accomplished without serious problems. I have now embarked on a step-by-step introduction of Fortran-90 features.
The elimination of the requirement that the user must supply work-space for use by a subroutine was the first step. This is prone to errors and forces users to reserve space which may not be needed in anyone run. The use of ALLOCATABLE arrays for workspace is the solution under Fortran-90 and I have verified that this is an effective solution. The main impact on the user is the elimination of two arguments from the subroutine call and the ending of the need to reserve space which mayor may not be needed depending on the size of the images.
The question that might reasonably be asked is what is the penalty to be paid in execution time for using a compiler which is both new and designed with portability as a key priority. So far running on a SUN 3/60 and using the -0 option this appears to be about three percent compared to the optimal performance with the F77 compiler. This is a penalty which I am happy to live with!
Although my tests are at a very early stage I am reporting now in case others are embarking on their own experiments. I would like to encourage such people to report on their experiences. I should finally add that I am not interested in ideological wars about the respective merits of Fortran and C but simply in trying to achieve convergence in functionality between two libraries which are currently very different.
There was a substantial and rapid response to the flyer in the last newsletter offering free Transputer software to academics.
The requests have been processed, as indicated in the advertisement, on a first come - first served basis. All the software items which were left in the Transputer Initiative loan pool have now been distributed and a total of 42 individuals and their departments have benefited from this final offer. Few requests were satisfied in full and to date (25 November 1991) I have received a further 16 requests which cannot be fulfilled even in part.
I am sorry that those of you falling into this latter category will be particularly disappointed. It does not make sense for me to write individual letters to those of you who responded to the software offer: please accept this statement as a general reply.
Manchester Computer Centre's UMIST Support Unit has been awarded a grant under the Computer Board Information Technology Training Initiative to produce training and support material for finite element software.
The three year project intends to evaluate existing training material, especially in higher education establishments, to determine the requirements of the people who teach or support finite element packages. A set of modules is to be produced which can be used as a basis of a finite element course. The modules will consist of teachers notes, and aids and student work books. These will cover basis concepts, background theory, assumptions and limitations of the models, data preparation good modelling practices, result interpretation and error estimation. It is intended that these modules will cover a broad an area as possible from solid mechanics to dynamics, heat flow, electrical analysis, fluid flow, etc. These modules will be aimed at undergraduates as an introduction to the finite element method.
A further series of modules are envisaged aimed at students carrying out projects, post-graduates and researchers. These modules will cover more specific areas of the finite element method such as non-linear analysis, transient analysis, contact problems, etc. These will be self-teach modules.
As the first stage of the project is to review existing training material, we would be interested to hear from any one who teaches or supports the finite element method. If anyone requires further information please contact me.
