
Node-and-link diagrams are natural visual representations for a wide range of systematic information structures. Generally, people use them in order to understand how a set of components, ideas or propositions are related to each other, usually to help in analysis or problem solving. Across a wide spectrum of fields of knowledge, their value is reflected not only in the extent and variety of their uses but also in the very state of knowledge or art that they have enabled. Mechanics, electronics, informatics, education and systems generally are leading examples of fields of knowledge in which diagram notations have proliferated and have accelerated technological and economic progress.
In the modelling or synthesis of complex systems it is rarely practical to predict the different combinations of details users will want to see juxtaposed at different stages of their work. Correspondingly, a major limitation on the effectiveness of diagrammatic user interfaces (DUIs) has been lack of flexibility for selectively detailing what is currently pertinent. This has stimulated research into self-organising DUIs in which diagram layout adjusts automatically to accommodate variable multi-focal selective viewing of large network-structures of information.
Research led by David Dodson in City University's Diagrammatic Interaction Group (DIG) is yielding working concept-demonstrations of 3D mechanically co-operative diagrams. These are simple artificial worlds of connected diagram elements which obey an intuitive physics of self-organisation. Repulsion between diagram elements keeps them spread well apart; springiness within them promotes appropriate proximities and alignments. In their normal, co-operative mode of use, these diagrams change shape gracefully and the repulsion forces prevent diagram elements from colliding and possibly passing through one another. This preserves the 3D topology of the diagram in a solid but flexible state.
To obtain an initial layout the ingredients can be crushed together, heating them to a chaotic fluid state, and then gradually cooled to a low-energy ductile solid state. This annealing process achieves low potential energy in the force-interactions in a diagram corresponding to a high degree of satisfaction of the layout preferences that they represent. The resulting 3D layout can be improved to suit a user's direction of view by a touch of magic in the form of weak 2D repulsions in the display plane. This yields a lucid state a new kind of solid state - in which the separation of diagram elements seen in a 2D display is enhanced without noticeably impairing the primary 3D physics of self-organisation.
The simple mechanical behaviour of such DUIs helps users quickly develop an intuitive grasp of their dynamics, making it easy to learn how to control them. Being 3-dimensional, they can also be more immediately expressive than 2D diagrams and they can help users better comprehend complex patterns of interconnectedness.
The accompanying 3D diagrams are from VIM, a concept demonstration of a co-operative knowledge system comprising an existing Expert System prototype linked into COMAIDE. The first (Fig 1) shows VIM with all of its nodes in view; the second (Fig 2) is a slightly more selective view, in which several link stubs can be clicked-on to reveal hidden detail.
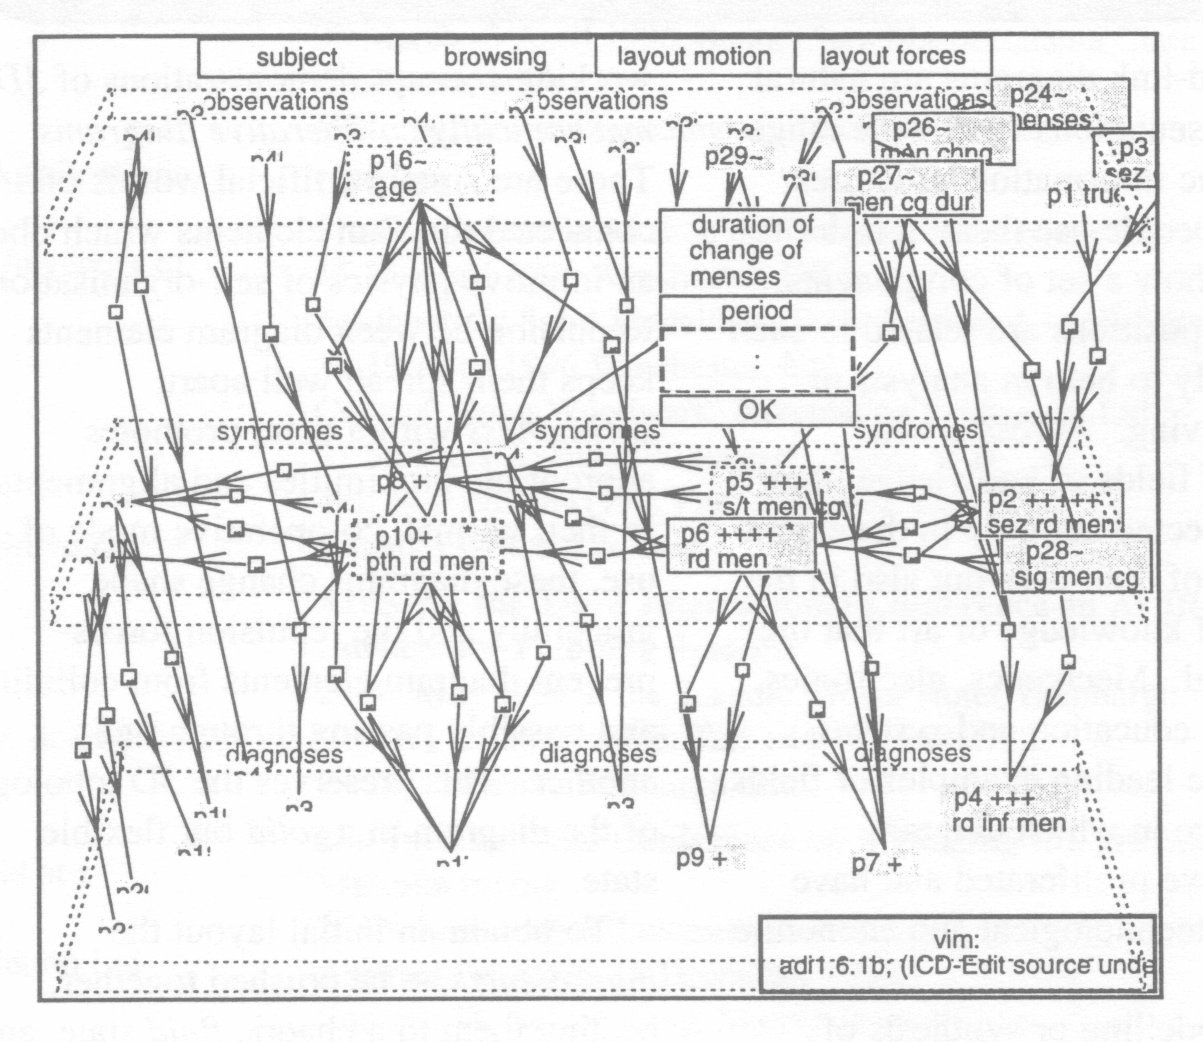
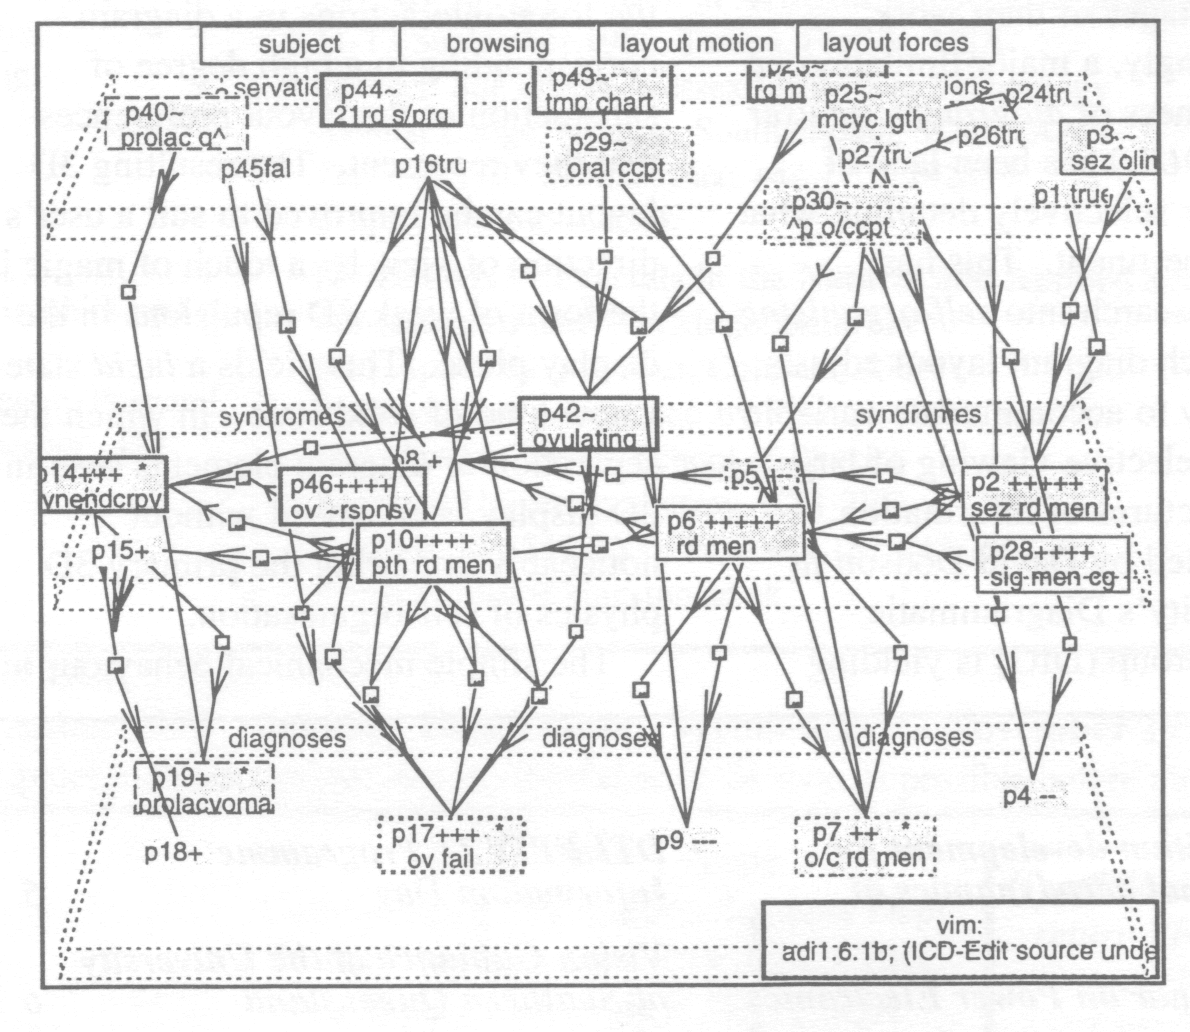
COMAIDE is a tool, being evolved by DIG, for DUIs based on mechanically co-operative diagrams. It comprises a Prolog environment providing high-level 3D diagram browsing and layout management facilities, linked via the Internet to ICD-Edit, DIG's graphics front-end. ICD-Edit is in turn a server/editor for a limited class of 3D interactive diagram graphics, implemented for UNIX workstations without 3D hardware, using X/Motif. It should be emphasised that ICD-Edit provides motion depth cueing, giving a much better 3D impression than the printed page, making diagrams look less tangled and resolving apparent ambiguities in their linkage structure.
VIM unifies consultation and explanation in a direct-manipulation diagram and exhibits co-operation on two levels. First, co-operative browsing lets the system present what it rates as worthy of user attention as well as letting the user browse freely; Second, co-operative layout management gently tidies the diagram, concurrently letting the user rearrange the diagram to vary its topology. This latter co-operation is important because purely automatic layout cannot cater for the unpredictability and complexity of the user's layout preferences.
DIG's research has been funded by City University, Engineering and Physical Science Research Council (EPSRC) (Cooperative KBS Browsing) and EU COPERNICUS (CUBIQ). The development of tools for co-operative diagrammatic interaction is expected to have applications in system visualisation in a wide range of domains, including knowledge engineering and knowledge system end use.
Further details of DIG's work are available on the World-Wide Web under the URL http://web.cs.city.ac.uk/informatics/cs/research/dig/dig.html.
DIG plans to give an extended demonstration at City in November.
477 completed questionnaires were received by EPSRC. I have been promised an article for the next issue on the results plus the decision, if it has been made, on whether or not some EASE-like programme will continue after 31 March 1996.
Last issue I reported that we were planning to run 3 Seminars as requested by EPSRC Programme Managers. See below for some details on the Power Electronics Simulation Seminar. With Professor Phil Hutchinson's considerable help we have a suggested programme for the Computational Modelling of Multi-phase Flow Seminar. Both these will now be run in mid-January to mid-February. Full details of these and the IT Techniques for Signal Processing Applications Seminar (still planned to run in mid-December) will be in the next issue. I would like to thank the two readers who contacted me about the Multiphase Flow Seminar with offers of involvement. I will be trying to accommodate them in the programme.
There will be just two more issues of ECN after this one. In fact ECN will be retiring at 60, since the final issue will be number 60!!
The project entitled Domain decomposition and coupling techniques for external aerodynamics began in October 1993. A University Bursary was awarded to A Cuffe who finished her undergraduate studies at the University of Greenwich in June 1993. The project is jointly supervised by C-H Lai and K A Pericleous and is being carried out at the Centre for Numerical Modelling and Process Analysis. The Centre, being an integral part of the School of Computing and Mathematical Sciences, conducts other research activities as well. Full details of these research activities can be obtained by e-mail to f.barkshire@greenwich.ac.uk.
The present project concerns the development of an optimal algorithm for the solution of boundary layers in high speed external aerodynamics. The meaning of optimal may be interpreted as using minimal computational work to achieve a target accuracy. The approach that we have adopted is to use domain decomposition methods based on a problem partitioning concept. Prandt [1] was probably the first person to use problem partitioning concepts for boundary layer theory, in which the following two observation were made. First, when a viscous fluid flows past a solid boundary, tangential and normal components of the velocity must both be equal to the components of the velocity of the surface, and fluid sticks to the surface. Second, for an ideal inviscid fluid, only the normal components are equal and there is no restriction on tangential slip of fluid relative to the boundary. The fundamental differences lead to the idea of a boundary layer, which is a thin layer of fluid adjacent to the solid surface, within which viscous effects are dominant and that such effects become negligible outside of the thin layer. Hence it is valid to divide the flow region into two parts, ie the boundary layer and the inviscid flow outside the layer. The aim of the project is to build in an artificial problem partitioning strategy [2] into the in-house cell-centred finite volume computational fluid dynamics code namely, UIFS. Such artificial problem partitioning strategy allows one to define a minimal computational region which consists of entirely viscous flows described by the Navier-Stokes equation and can be used to provide grid adaptation information. Such information can be used to confine intensive computational work in the minimised Navier-Stokes region, which an optimal boundary layer flow algorithm relies upon.
An extension of the above work to turbulent boundary layers, and noise generation and control will be carried out by another University Bursary student who is expected to start in October 1995.
The project described here is part of the development of parallel numerical algorithms in particular for distributed memory machines and for loosely coupled workstations. There are two MSc projects on related parallel algorithms. First, parallelisation of a lag-entrainment model on massively parallel computers. Second, implementation of a domain decomposition method for inverse heat conduction problems on a network of workstations using PVM. Other related research work includes quasi-Newton methods for nonlinear Poisson problems and acceleration methods for domain decomposition methods. More details concerning the above work is available from a.m.cuffe@greenwich.ac.uk, c.h.lai@greenwich.ac.uk or k.a.pericleous@greenwich.ac.uk.
(1) Prandtl, L. Uberussigkeitsbewegung bei sehr kleiner Reibung, Proceedings of the 3rd International Mathematics Congress, Heidelberg, 1904.
(2) Lai, C-H, Cuffe, A. M. A domain decomposition algorithm for viscous/inviscid coupling, Applications of High-Performance Computing in Engineering IV, ed H Power, Computational Mechanics Publications, Southampton, 17 J - J 78, 1995.
The potential world market for all products that utilise Power Electronic subsystems is in the region of £100Bn.
The direct market for the subsystems themselves is around £14Bn, of which Western Europe represents about £5Bn. In contrast to the microelectronics sector, Europe holds its own with the USA and Japan and is particularly strong in the fields of lighting products, automation and transportation.
However the use of simulation tools for the design of such sub-systems is at a very low level, particularly in the UK. Part of the reason for this is the need to fully account for electro-thermal interaction and charge storage effects within the power devices.
Presentations in this seminar will focus on:
The seminar will take place in mid January 1996. For further information please contact Mike Jane.
Computational Fluid Dynamics (CFD) is now a well established and well developed field finding application in many different areas of science and engineering. Much of the emphasis in CFD has been to high Reynolds number flows in aerodynamical, industrial and environmental modelling applications, where topics such as turbulence modelling are of major importance. One might think that the study of very low inertia, incompressible flows would be computationally straightforward and apparently of little industrial interest. Such an opinion would be misguided, however, if one is concerned with non-Newtonian materials, and particularly visco-elastic fluids. A comparatively small community world-wide is engaged in research in this field, and the relatively low emphasis on non-Newtonian CFD is surprising in view of the extremely wide application to industry.
Materials are called non-Newtonian if they exhibit a viscosity which varies under shear or extension. A wide range of materials are shear thinning. Examples include polymer melts and solutions, foodstuffs, cleaning materials, printing inks, paints, pharmaceutical materials, and many others. Very few materials exhibit shear thickening. A clay slurry would be one example. In typical industrial processes such fluids would be pumped through conduits, extruded or injected into moulds, or perhaps just mixed in a batch or continuous mixer. To use a Navier-Stokes based code to attempt to predict properties of such processes would lead to very significant errors. The non-linearity in the viscosity must be addressed, and the position is made more complex if, as is often the case, the flow under consideration is non-isothermal. One must then accommodate a viscosity which is a function of temperature, as well as the generation of heat within the fluid through viscous heating. In a process such as injection moulding of polymers, for example, the prediction of the temperature of the fluid is vital in determining solidification layers and the final distribution of polymer in the mould. From a numerical point of view, the main problem in an isothermal analysis is the capture of the very sharp temperature boundary layers which occur in these flows. The viscosity of a material will also depend on the pressure, but such variation is only significant at very high pressures. One important example would be the lubrication of bearings in engines.
Another very important property of some materials is elasticity. This manifests itself in terms of so-called normal stress differences under shearing motion, and in an apparent variation of the viscosity when the fluid is stretched. Examples of such materials are polymers such as polystyrene or polyethylene. Such elastic properties can be attributed to the configuration of the very long chain molecules which one finds in such polymer melts or solutions. The behaviour of such visco-elastic fluids can be totally different from that you would expect from a comparable Newtonian material of roughly the same viscosity. In many cases, the elastic properties can give rise to problems with industrial processes. For example, in the manufacture of man-made fibres a polymer solution is forced through a nozzle, resulting in a jet of fluid. Solvent is removed from the jet and the then solid polymer thread is collected. The speed of this process is limited. Attempts to exceed a critical speed result in an unacceptable instability in which the diameter of the emerging fibre varies. From a CFD point of view the complexity of modelling the flow of visco-elastic materials is an order of magnitude more difficult than where elasticity is not present. As well as obtaining the fluid velocity components, the pressure, and possibly the temperature, additionally one must solve a coupled highly non-linear set of differential equations for the stress distribution. Development of robust numerical techniques to solve such systems has been slow, and it is only over the past few years that significant progress has been made. There is still much scope for further work, however, not just in developing more sophisticated numerics, but also in establishing more elaborate mathematical models of the underlying physics of the material. There are still quite simple flows where existing methodology fails to capture observed behaviour of the fluid.
A leading group, internationally, in this research field is that of the University of Wales Institute of non-Newtonian Fluid Mechanics, which is spread over the sister colleges of Aberystwyth, Bangor and Swansea. Overall, the Institute covers a wide range of rheological activities, not just CFD but also constitutive modelling, rheometry and experimental visualisation studies. The authors here represent the Swansea group, whose expertise lies in the areas of computer simulation of flows of polymeric materials and in their visualisation. The aim is to provide advanced knowledge, through a combined experimental investigation and computer simulation of the filling stage of injection moulding of multiple materials. Such complex processes are intended to be used to produce multi-layered polymer components but within a single injection step. The objective is to predict where and when to inject the different polymer components so as to achieve the distribution desired in the final product, which may, for example, have particular thermal, mechanical or electromagnetic properties associated with the individual layers. Examples would include food containers with protective barrier layers, shielded housings for electronic components, plastic components with high quality exterior finish. Another important application is in the recycling of plastics in which a component is constructed of old material surrounded by a thin layer of new polymer.
Another area of research is the investigation of coating processes, particularly with reference to the coating of wire and fibre-optic cables. The materials involved in the study are polyethylenes of various densities and the objective is to use simulation to indicate how best to design the geometry of the coating machinery. This should then lead to optimal process operation and product quality. Here reduction of stress imparted to the highly elastic polymer coatings through processing is of vital importance to avoid high levels of frozen-in stresses in the final product. This work has also involved advanced experimental characterisation of the polymer materials, work carried out by our partner group in Aberystwyth.
An area of research, which is of current interest for the Institute, is the flow of foodstuffs in processing. Here there are two areas of particular interest, namely multi-layered food products and mixing. The former is looking to transfer the multi-layer injection technology to the simulation of co-injection of multiple food components to produce novel fabricated food systems. The important point is the requirement to fabricate these in one injection step. A fundamental part of this technology is a simulation code which has the facility to track fluid particles, moving fronts and deformation patterns throughout the filling of complex moulds. The insight gained by such simulation allows both the construction of optimum mould configuration without expensive trial and error construction, and also the fabrication of products which would not otherwise be feasible with presently available methods.
Mixing is probably one of the most important processes in large scale food production. In the production of breads and many other baked products the quality of the mixing of the initial ingredients can have a very significant effect on the overall quality of the final product. Mixing is usually achieved in either batch or continuous mode using blades rotating in a fixed container, the walls of the container having various baffles. The rheology of the fluid dough is very complex and changes with time. The process is not well understood, and yet is a fundamental operation in the industry.
The Institute of non-Newtonian Fluid Mechanics operates an Industrial Club
which is open to membership by industrial organisations by subscription.
The Institute also runs six-monthly workshops devoted to specific aspects of
rheological fluid dynamics, including CFD. These very focused meetings attract
a wide international audience, including both leading academics and
industrialists. Details of these meetings and of all other aspects of the
Institute are available from:
Peter Townsend p. townsend@swansea.ac.uk
or
Mike Webster m.f. webster@swansea.ac.uk
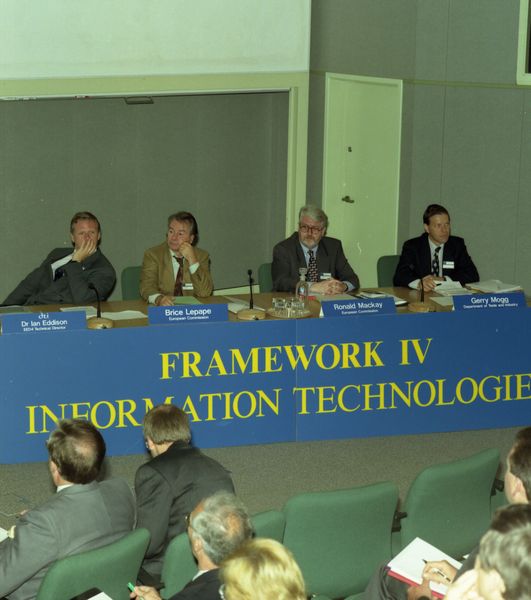
On 27 June 1996, Rutherford Appleton Laboratory (CLRC) again hosted a DTI FPIV IT Programme Information Day, this time in support of the June Calls for Proposals. Following the success of the ground breaking January Information Day, the June event was again video-conferenced, but this time another 3 sites were involved as well as the 2 that took part in the January event. Over 250 delegates attended at Rutherford Appleton Laboratory (CLRC), Newcastle-upon-Tyne, Daresbury Laboratory (CLRC) and Belfast; brought together courtesy of UKERNA's Superjanet network; additionally the proceedings were relayed to Dublin via ISDN link, adding an international dimension.
The event was chaired by Ian Eddison, Head of the DTI's ESPRIT Unit, who very ably handled the multi-site question and answer sessions. The Commission presenters were Brice LePape who addressed the Software Technologies domain of the June Call and Ronald McKay who addressed the Integration in Manufacture domain. Ronald McKay observed that he looked forward to the day when he could address such a geographically dispersed audience from Brussels.
The day was a great success, particularly in Newcastle (organised by the Regional Technology Centre North) where over 80% of the 100 strong audience indicated that they were inspired to make their first bids.
Diary Note: The success of the event has led DTI and Rutherford Appleton Laboratory (CLRC) to arrange another video-conferenced Information Day (on 23 January 1996). It will again link up several UK sites and it is hoped this event will include a mainland Europe site. This is in support of the major December 1995 Call.
Work on an agricultural vision guidance system has had a very successful outcome, with six Steeroid systems having successfully completed field trials in Australia and further prototypes undergoing evaluation in the United States. The Steeroid uses sight of the rows of crops for guidance and relieves the driver of the stressful task of maintaining accurate steering with respect to the plants. Such a system has been the goal of several international research teams for many years, but this seems likely to be the first to reach the marketplace, with its possible adoption by a world-leader in tractor manufacturing.
Further, current projects in the National Centre for Engineering in Agriculture are broadening the scope of the guidance research. A new project has begun to address the problem of initial marking in very large fields, while another concerns lateral control of a trailed implement. Systems with tactile sensors have already been supplied for guidance of cotton harvesters and experiments are under way in furrow-following probes. The vision work has found other applications in the sorting and grading of agricultural produce - a project based on broccoli heads is well advanced.
The early stages of development of the vision guidance project has already been reported in several papers. This summary is meant to focus on salient features of the present stage of development - the project is still something of a moving target.
Many added features of the system are not directly related to the performance and accuracy of the crop-following operation but concern the operator interface. A feature which has been given some importance is an in-cab display on which live images of the camera view are shown with superimposed graphics representing the data extracted by the computer.
It is fully acknowledged that the performance on which the system will be judged includes the farmer as part of the overall system. This involves calibration at the start of a field, and setting the clearance of cultivator tines to match the system's precision. The operator must have general trust in its operation, but must realise and anticipate circumstances in which automatic operation becomes unreasonable.
The vision interface is a card usually intended for multi-media applications. It allows a live panel to be inset on a VGA display. It takes a little more effort, however, to extract the data from the board and into a usable part of the host PC's memory at a useful rate. The project originally used a camcorder as a commercial option for the camera. Now, however, OEM cameras have dropped substantially in price.
The brightness of the image is represented by a two-dimensional array of eight-bit values. The primary task seen by researchers elsewhere was discriminating between the crop and the background field, made harder by light levels which could change from moment to moment. One approach was to count and analyse the distribution of brightness over all the pixels of the image. The researchers were thus faced with a massive information processing task to perform for each frame of data before analysis could even begin.
We have found a very much simpler approach to be successful. This starts with the premise that viewports will be located straddling each of the rows under scrutiny. It also depends on the concept of frame-to-frame adjustment so that data extracted as a by-product of other computations can be used for the incremental control of the next frame's threshold.
Within the viewport, a count is made of the pixels which exceed the threshold and are therefore deemed to be plant. The proportion of bright to total pixels is therefore known. The correct value of this proportion is a property of the plants' stage of development, varying from, say, 0.1 or less when the plants are newly emerged to 0.5 or more as the canopy closes. (Above this value the farmer would not wish to enter the crop with a vehicle unless harvesting it.)
If the proportion seen of bright pixels falls below the target value, the threshold is accordingly lowered by one count for the following frame. The target value itself is held in the computer as a settable parameter. It is increased or decreased by the farmer during start-of-field setup in a very simple way. Alternate rows of the monitor image show the camera view and an image quantised by the threshold. White bars are seen straddling the crop rows. By keying either of two buttons, the farmer can cause the bars to widen or shrink, until they match the perception of crop-row thickness.
Until the target is changed again, the threshold will adapt to variations in picture brightness to preserve the proportional density attributed to the crop. Because of the fuzzy boundaries of the crop rows, there is a great deal of latitude in this setting before performance starts to deteriorate.
The preferred line of attack for a number of several previous researchers was to seek data reduction by run-length encoding. The image, now quantised into the two values light and dark, was analysed in terms of its horizontal structure. For each horizontal line of the image, coordinates were noted where the data changed from light to dark or vice versa, giving a number of transition points. These were then paired off and averages taken to obtain estimates of the row centres, those for row y being (xn(y), y).
This certainly reduced the amount of data to be processed, but a new problem had to be faced. The rth transition did not necessarily relate to row r, since a glitch earlier in the data would throw in another pair of transitions and the count would be corrupted. The researchers had to look for transitions in the locality if they wished to put together a sequence of transitions on successive lines of the image (xr(y), y). Having found this sequence in values of x, a line of best fit could be matched by conventional regression.
Once again our own approach was much simpler. What was sought was the lateral displacement of the image of the row within the viewport, so that for the following frame the viewport could be displaced to track the row and a steering signal could be derived from that displacement. Instead of extracting edge data from the image, all that was necessary was to weigh it. The moment of the bright data points about the viewpoint centre enabled the 'centre of gravity' to be calculated by dividing by the count of bright pixels. Indeed, it would be no harder to weight the points according to their brightness, without quantisation - this was not done in practice since the quantised performance appeared to be superior and was faster to compute.
To give more flexibility to the system for curved rows or large deflections, the analysis also included an estimate of the angle of tilt of the row segment. Within the window, the computation found not merely the centre of gravity of the distributed points but also their axis of gyration. This enabled the window to be corrected by lateral shear so that it best conformed to the rows.
As a by product of the computation, the moment of inertia about the sheared row-estimate was known. This meant that it could be determined whether points were tightly bunched about the line of fit or scattered widely. The result was an estimate of the quality of that particular analysis in terms of its credibility as a clearly seen row. Only if the quality exceeded a threshold was the correction made to the viewport or the data used for steering. A count was made of the number of unusable row images in succession and if this exceeded ten then an audible warning was given and control reverted to manual.
Since three row-viewports are processed in each image and since frames are captured at a rate of at least ten per second, only a third of a second of eyes shut, straight ahead travel occurs before the warning.
Another widespread concern of other earlier researchers was the identification of coordinate transformations relating the origin of the perceived image to absolute field coordinates.
In the Steeroid system, the demanded steering angle is simply made proportional to the perceived lateral displacement of the rows. Since the viewports represent a focus some metres ahead of the vehicle, this signal will be the sum both of a term representing the lateral displacement of the vehicle and a term representing its angular heading relative to the row. This mix provides substantial damping of the response, which will effect an exponential decay of error with a distance constant equal to the distance from the focus of view to the rear axle.
All important parameters are held on computer disk within the system, loaded automatically at start up. Some of these are intrinsic within the system and some represent user settings.
The datum of the steering sensor can be fine-tuned by noting the steering feedback signal when the tractor has settled on course. The horizon, vanishing point and row separation are also important parameters of the analysis. They are set by the simple expedient of asking the operator to tap cursor keys until reference lines are aligned with the image on the screen. Steering is then performed in terms of deviation of the image from this datum. As well as setting the target density of the image, the operator can select any combination of the two chrominance signals in addition to the luminance. In particular, it is possible to select for greenness so that the analysis of the image is not corrupted by dry vegetable trash.
The viewports can be raised and lowered in the image, changing the distance of the focus ahead of the vehicle. There will also often be tanks attached to the front of the tractor which obstruct part of the view.
The real test of the system's effectiveness is, of course, the accuracy with which it follows the crop-rows and the nature of its recovery from a transient disturbance. Two sets of results are presented, the first being an artificial laboratory experiment and the second being an objective measurement of the real system when following a marked line.
The test shows the actual performance of the entire vehicle on a test run. Conditions were far from ideal. Wind was blowing up dust clouds from the marked-out track and the powdered-line markings were already broken and irregular. A new target was laid in the form of a length of stretched tape 15 millimetres in width. Rather than try to persuade it to lie flat, the tape was twisted with the result that the image quality fluctuated with a cycle of about one metre.
A second camera was mounted on the front axle, looking down on the tape. The record button was pressed and the tractor was driven along the tape at approximately one metre per second under automatic vision guidance. At the end of the run a ruler was briefly placed in the field of view to calibrate the camera.
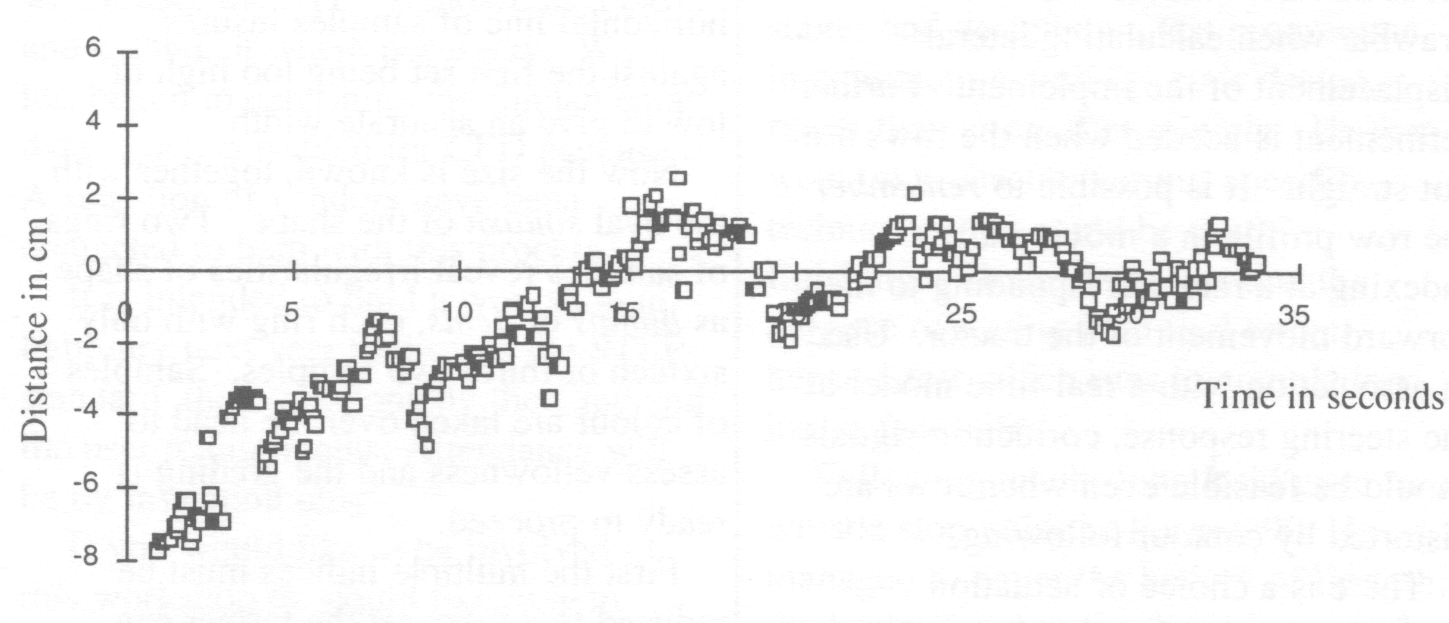
The video was played back in the laboratory through a duplicate of the guidance system. This system was now set the task of tracking the image of the target tape in the recording, logging its findings to disk as in the first test. Over three hundred readings were acquired in real time during the thirty-five seconds of the run. These are presented here untouched apart from scaling so that the y-axis represents centimetres of deflection from the line.
There are a few glitches from the analysis process but Figure 1 shows a response which meets the requirements of two-centimetre accuracy. There is seen to be an initial error when the system first acquires the line. This decays with a distance constant seen to be in the region of ten metres; of the order of the distance of the view focus ahead of the rear axis. For the ensuing twenty metres the deviation from the line does not exceed two centimetres. In field measurements, farmers have expressed great satisfaction with the performance. Fluctuations in path are no more than the fluctuations in the row crop and the system does indeed relieve the driver of a great deal of stress.
When the implement is trailed behind the tractor rather than being rigidly attached to it, guidance of the tractor alone is not enough. Systems are already available which move a toolbar laterally in response to an infra-red measurement of its position relative to the crop. The aim of the current project, however, is to integrate the control of both tractor and implement.
The location of the implement relative to the tractor is readily ascertained by measuring the drawbar angle or by a simple optical sensing using a rearward pointing sensor. There is a problem of resolution and precision, although on the move calibration with a nudge adjustment makes absolute accuracy unnecessary.
Determination of the position of the implement relative to the crop is now a function of both the tractor's lateral displacement and also its angle relative to the crop row. This latter term will be important, being multiplied by the substantial distance between the forward focus of view and the rear of the drawbar when calculating lateral displacement of the implement. Further refinement is needed when the rows are not straight. It is possible to remember the row profile in a moving array, indexing at a rate corresponding to the forward movement of the tractor. Used in association with a real-time model of the steering response, correction signals should be feasible even when rows are distorted by contour following.
There is a choice of actuation methods. Large planters already have typically four hydraulic rams which set the tool depth. Controlled individually, these would allow steering by differential drag. Some steering can be achieved by adding steering rams to the trailing wheels which carry the balance of the load. A number of experimental systems for manual control can already be found in Queensland.
It is not yet known how successful vision guidance will be for marking the initial furrows in large fields. The obvious technique of aiming for a marker beacon at the end of the field has a number of flaws. The furrow might be two kilometres in length. Even if the resolution of the camera were sufficient to identify an error of a few centimetres in mid-field, heat-haze on a sunny day would cause much greater shimmer than this accuracy would demand.
Initial approaches will include the use of a boom-mounted camera aligned with the nearest previous furrow and the use of an outlying marker furrow. In addition to the possibility of using vision to detect the dark line of a furrow, furrow-feeler systems have been developed with balls and skids which trail behind a forward pivot.
The steering subsystem of Steeroid, including the wheel-sensor, hydraulic control interface and microcomputer, has been employed in furrow-following and in a number of simpler control tasks. Stem-feeler rods are used to locate the crop for harvester guidance.
The vision approach to broccoli grading is also simple and pragmatic. With a target speed of five heads per second, there is little time for finesse. By taking samples across the head, its central axis can be estimated. Another line of samples reveals the height and the vertical mid-line. A further horizontal line of samples insures against the first set being too high or low to give an accurate width.
Now the size is known, together with the oval squash of the shape. Two rings of samples reveal irregularities of shape as bumps or dents, each ring with only sixteen or thirty two samples. Samples of colour are taken over the head to assess yellowness and the grading is ready to proceed.
First the multiple indices must be reduced to a fuzzy set the farmer can handle with ease. The rules are user-settable, so that a head can be grade 1 if oval <=5%, bumps <=2, dents <= 1, yellow <=0%. Size templates for deciding whether the head is huge, large, medium or small can be adjusted by means of a mouse. Further adjustment is possible of the ring-size for checking bumps and dents too.
Finally the selection is made that, for example, large grade I heads will proceed to station 2. In this way, the farmer interacts with the system in a readily understood way to adapt the grading standards to the changing state of the crop and of the markets.
Vision research and teaching have a tendency to emphasise such aspects as image enhancement, filtering, edge-detection, object recognition and template matching. All of these are computationally intensive, yet contribute very little to the extraction of steering data in a case such as ours, indeed it could be said that their use would be an impediment.
By concentrating on those aspects of data extraction necessary for steering, stressing the speed of processing and accessing only sparse image data, it has been possible to achieve a performance which is suitable for the task. Although the results presented here were captured at a speed of only one metre per second, the system performs well at twenty-five kilometres per hour - faster than most agricultural operations.
Similarly, extraction of the minimum of image data essential for the task enables us to achieve the broccoli grading task at five heads per second.
Billingsley J, Schoenfisch M, Vision-guided Agricultural Tractor, Australian Robot Association Conference, Robots for Competitive Industries, Brisbane, July 14-16, 1993.
Billingsley J, Schoenfisch M, Vision Systems in Agriculture, Proc Mechatronics and Machine Vision in Practice, Toowoomba, Australia, September 13-15 1994, pp 16-21.
The 5th EPSRC CFD Community Club School on Computational Fluid Dynamics will be held from 8 to 12 January 1996 at The Cosener's House, Abingdon. This is a one-week, intensive, residential, hands-on course covering many aspects of CFD.
The School will focus on overall solution strategies as well as problem discretisation. Implicit, explicit and pressure-correction solution techniques will be discussed. Their construction, stability requirements, accuracy and rate of convergence will be explored. A number of spatially centred and upwind discretisation schemes, including those for shock capturing, will be addressed. Several lectures will be devoted to turbulence modelling. Some time will be given to grid and mesh generation and the computational implications of modern CFD methods.
This year an early registration fee will be available to those registering and paying in full by 31 October.
A limited number of places will be available at a reduced fee for those in receipt of a SERC or EPSRC studentship or those holding a CASE award. These places will be allocated on a first-come, first-served basis so students are advised to apply early.
A full programme and registration form are available from Virginia Jones.
This service, which was advertised in the last ECN, is now in full operation and there are several papers available on the server. To find out how to submit or retrieve a paper, e-mail a message to cfdcc-pps@inf.rl.ac.uk (not cfdcc@inf.rl.ac.uk as previously advertised) containing the subject send info or, alternatively, consult our WWW page.
A big thank you to all those members who returned their membership survey. For those who did not reply we will be giving you another chance to avoid being removed from the membership list. Please fill in the card which you I should receive in the post and return it if I you would like to remain a member.
An article in the previous issue of this newsletter described the use of STEP methodology for systems integration of complex engineering systems. The STEP standard (ISO 10303) includes part 104, Finite I Element Analysis (FEA) which is about to be issued for its second Committee Draft Ballot with a Draft International Standard expected next year.
The CFDCC would like to extend the FEA model into the area of CFD including both finite volumes and finite difference. This would facilitate the transfer and sharing of data between CFD and CAD packages and also between CFD packages and software for other types of analysis (thermal, structural, etc).
A data model will be developed which uses the STEP standard as a basis and extends it where necessary. Work has begun to determine the fundamental data which is needed for CFD packages. A selection of vendors have been contacted to help with this process.
It is intended to hold a workshop in February next year to discuss the STEP standard, the work done by the Club and the user requirements. Attendance will be by invitation only.
If you would like to be involved in this workshop or would like to help define the data model then please contact Debbie Thomas.
A two day workshop on the above topic was organised by the CFDCC in July this year. The following is a report by one of the attendees on the course.
The emphasis throughout the course was on the practical aspects of achieving Quality Code; that the definition of satisfactory quality would vary subject to the specific constraints of each project, and that time spent on this definition, and then working to satisfy it, would be time well spent.
The course started with a general introduction to the area of software QA by Stuart Robinson who outlined the main procedures likely to be involved and introduced the idea of measuring quality with various metrics, a theme he expanded upon later talking about static and dynamic analysis of code.
Chris Greenough then talked about a structured approach to programming. The adoption of such an approach should lead to software that does the job required reliably and efficiently, and is both easy to modify and well documented. He outlined a rough timescale for software development; 25% design, 25% to 50% coding and at least 25% testing. Most of us felt this did not represent software development as we knew it! He also covered design strategies, comparing and contrasting top-down and bottom-up designs, and how good planning can avoid those last minute panics and re-writes.
Eric Thomas then talked about code testing. He made the rather uncomfortable point that all code contains errors. He outlined approaches that could be used to help effective testing, notably planning from the initial stages and designing a test programme in conjunction with the code design, rather than as an after-thought. He then went on to discuss various specific techniques that could be useful, finishing with the comment that the purpose of testing is to find errors, hence a test which runs to completion has in fact failed.
Following lunch, John Reid gave us a whistle stop guide to Fortran 90. He managed to cover the history of Fortran, the background to the development of the Fortran 90 standard, plus a tutorial covering the main features of the language without losing anyone on the way - a feat in itself considering the breadth of the subject. He also provided a useful list of compilers, tools and books available, which was supplemented by the experiences of the course participants.
We then moved on to the more hands-on side of the course. There were demonstrations of two commercial packages, the plusFort suite and the LDRA Testbed. The LDRA Testbed looked very pretty with lots of diagrams and charts, and came with a price to match. The plusFort suite of utilities did not appear quite as impressive but, listening to the vendor, appeared to have all the salient features. The acid test was to come the next day when we got to try these tools for ourselves.
The remainder of the afternoon was spent in teams coding the testing exercise set by Eric Thomas earlier in the day. Our objective was to write a program to carry out the defined task and to design a program of tests. We were asked to incorporate a deliberate mistake into our code, as the programs were to be shuffled and we would then all test another teams program.
When we were all satisfied with our work (and had checked our e-mail) we moved to Cosener's House in Abingdon for an excellent meal. Following this were two presentations by Chris Greenough on code portability and public domain tools. He covered several common coding habits which are in fact extensions to the standard, and can therefore lead to portability problems. He then covered other coding practices that can be ambiguously interpreted, and hence lead to unexpected behaviour. Following these he talked about some of the public domain software tools that are available. Having seen two commercial products in the afternoon it was interesting to find that many of the features used by the vendors to sell their products could be obtained either free or at very little cost.
The second day of the course was taken up with practical work. We started by implementing our testing plans on an anonymous program from those written the previous day. The testing took at least as long as the coding, so either we were doing something sensible or it was all going horribly wrong! When we all compared notes we had all found each others deliberate mistakes and between us had tested for all the conditions anticipated by those setting the challenge, which left us feeling relieved and happy.
We then went on to test the two commercial packages and some of the public domain tools described the previous evening on code we had brought along for the purpose. Our conclusions at the end of the day were that the more one paid the more visually impressive the user interface was, but that the programmer did not necessarily get any additional useful information. The sheer volume of information turned out by some sections of these packages was vast. So vast in fact that interpreting it could be a major task in itself This led us as a group to doubt the usefulness of some aspects of the packages. Having tried all these tools we concluded that the public domain tools would do a useful job, while the commercial packages looked prettier, and could provide documentary proof of your code quality testing if required, albeit at a price.
My thanks to all of you who have replied to indicate your continuing support for the Club. I shall be mailing you shortly. A bonus from the exercise is that we now have e-mail addresses for nearly all of the current members.
We have now had the AGOCG technical report reprinted at RAL, and have spare copies if anyone would like one (or knows anyone else who would like one). Please e-mail Virginia Jones, giving her the full postal address if outside RAL.
The Club is currently extending its activities to cover the use of virtual environment and virtual reality techniques in engineering research. These offer a potentially even more powerful means for interactively engaging the engineer in the solution and analysis of a range of problems. Two events are being planned for late autumn/winter this year: a seminar on Advanced 3D techniques for Visualization, and a Visualization Workshop.
A number of important issues have been identified by the Community Club, such as animation, virtual reality, multimedia presentations, collaborative visualization, and visualization for the non-expert.
Portable Software Tools for Parallel Architectures (PSTPA) is a five-year, £2.5M Programme of collaborative research funded by the UK Engineering and Physical Sciences Research Council. 15 projects have recently been started using the funds available.
Despite the forecast demand for the high performance computing power of parallel machines, the fact remains that programming such machines is still an intellectually demanding task. While there have been some significant recent advances (eg the evolution and widespread adoption of the PVM and MPI message passing standards, and the development of High Performance Fortran), there remains an urgent need for a greater understanding of the fundamentals, methods, and methodology of parallel software development to support a broad application base and to engender the next generation of parallel software tools.
The PSTP A Programme seeks in particular:
Programme-wide objectives include:
A long term goal is to hide the details of parallelism from the user, and this Programme also aims to address this. In the short term, however, it is necessary to provide tools which facilitate the exploitation of parallelism explicitly at an appropriate level for the community of application programmers. These tools will help in the expression, modelling, measurement, and management of parallel programs, as much as possible in a portable fashion.
The PSTPA Programme is complementary to an existing UK Parallel Applications Programme which has been running since 1991 through four Centres at Edinburgh, London, Oxford, and Southampton. That Programme, with £13M of UK government funding and matching contributions from industry. fosters applications projects exploring the adoption of parallel technology on industrial problems. Both ports of existing packages and new parallel applications have been undertaken. The results of that Programme, together with others worldwide, sharpen the requirements for portable software tools which the PSTPA Programme will address.
or more information on specific projects please contact me.
We are now seeing genuine support for THREADS (an autonomous unit of execution which works its way through code) appearing in recent Hardware and Software developments. THREADS are becoming a standard mechanism in which to construct the next generation of computing systems and applications.
Hardware architectures are now being constructed with multi-processor capability built-in. The most recent workstations from Sun have a 1-4 processor capacity. Similar advances within PC hardware is seeing a similar development with multi-processor systems being designed for Pentium and P6 processors.
Software has also kept pace on THREAD development with versions of UNIX (OSF/1, SOLARIS) and WINDOWS (WINDOWS-NT) both providing built-in support for multiprocessors within the operating systems. The User now has a computing platform which will support shrink-wrapped parallel applications to run on a wide variety of multi-processor systems.
The Developer has the ability to generate parallel and distributed applications that can now benefit from the multi-processor hardware and operating systems support. THREADS looks to be a key technology in the developer's arsenal.
The Parallel Processing Special Interest Group of the British Computer Society is hosting a THREADS meeting to provide a focus for the existing developments on-going in this field.
The THREADS meeting is being held at Imperial College, London, on Monday 18 December 1995.
