Contact us Heritage collections Image license terms
HOME ACL Associates Technology Literature Applications Society Software revisited
Further reading □ OverviewPaper 1Paper 2Paper 3Paper 4Paper 5Paper 6Paper 7Paper 8Paper 9Paper 10Paper 11Paper 12Paper 13Paper 14Paper 15Paper 16Paper 17Paper 18Paper 19Paper 20Paper 21Paper 22Paper 23Paper 24Paper 25 revPaper 25Paper 26Paper 27Paper 28Paper 29Paper 30Paper 31Paper 32Paper 33Paper 34Paper 35Paper E
ACD C&A INF CCD CISD Archives Contact us Heritage archives Image license terms

Search

   
ACLLiteratureProgress ReportsTechnical Papers :: Literature: FR80 Technical Papers
ACL ACD C&A INF CCD CISD Archives
Further reading

OverviewPaper 1Paper 2Paper 3Paper 4Paper 5Paper 6Paper 7Paper 8Paper 9Paper 10Paper 11Paper 12Paper 13Paper 14Paper 15Paper 16Paper 17Paper 18Paper 19Paper 20Paper 21Paper 22Paper 23Paper 24Paper 25 revPaper 25Paper 26Paper 27Paper 28Paper 29Paper 30Paper 31Paper 32Paper 33Paper 34Paper 35Paper E

Paper No 22: Drawing Map Projections

R E Thomas, J R Gallop

5 January 1976

This paper describes a FORTRAN routine MAPS which draws a map of the world. Various angles and projections are possible and lines of latitude and longitude can be drawn if desired. It can be used with SMOG or SPROGS and is a conversion of the routine previously provided with the SCFOR package.

It is being documented here in an internal paper, pending the setting up of a graphics library, with its own documentation. Some details of access may, therefore, be altered later.

Routine
SUBROUTINE MAPS (MTYPE,PLAT,PLONG,RADT,RADS,RUT,RUS,RCPX,RCPY,MSHAPE,MGRID,NC) 
Parameters
MTYPE
Type of projection. The following are available:
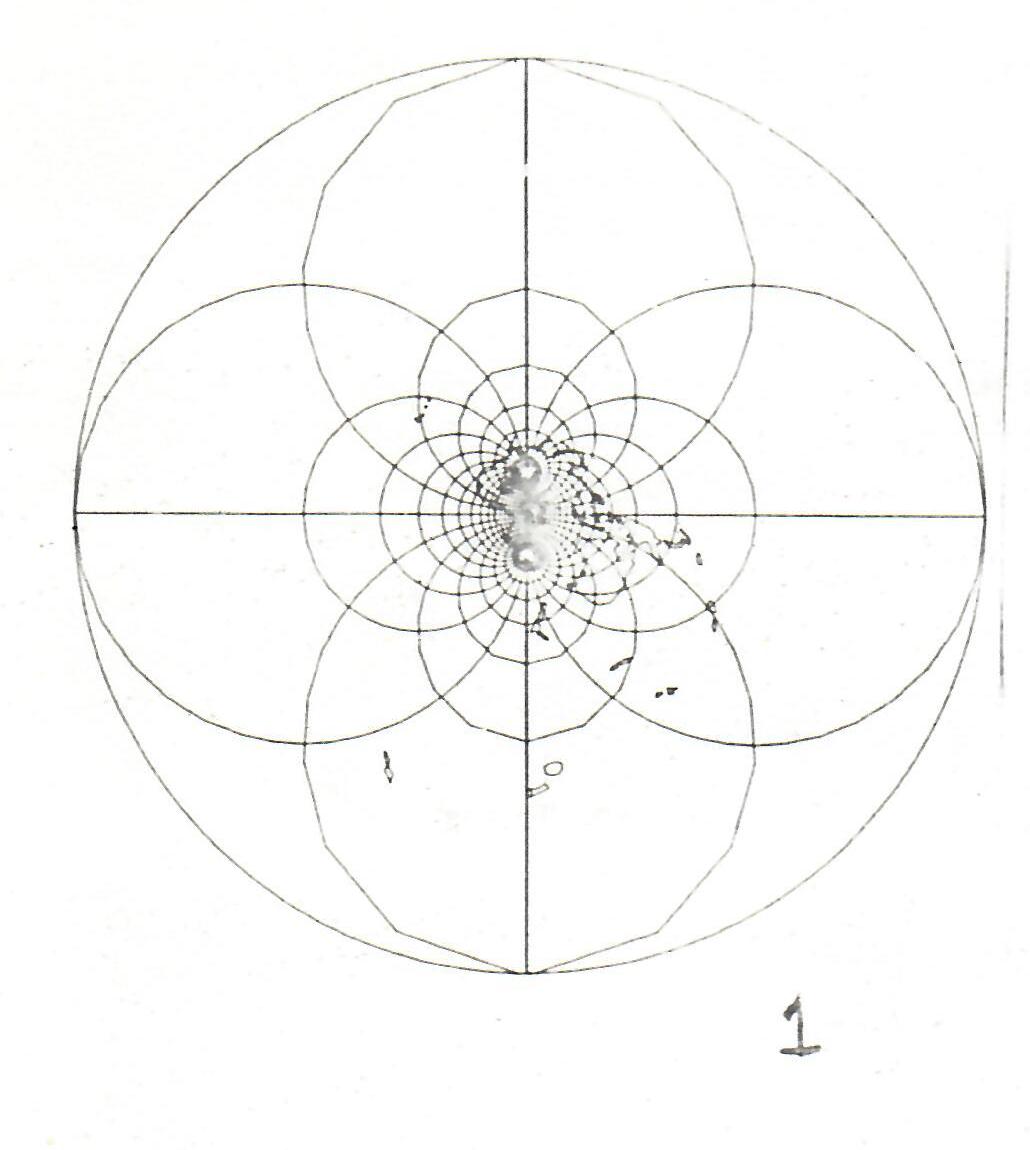
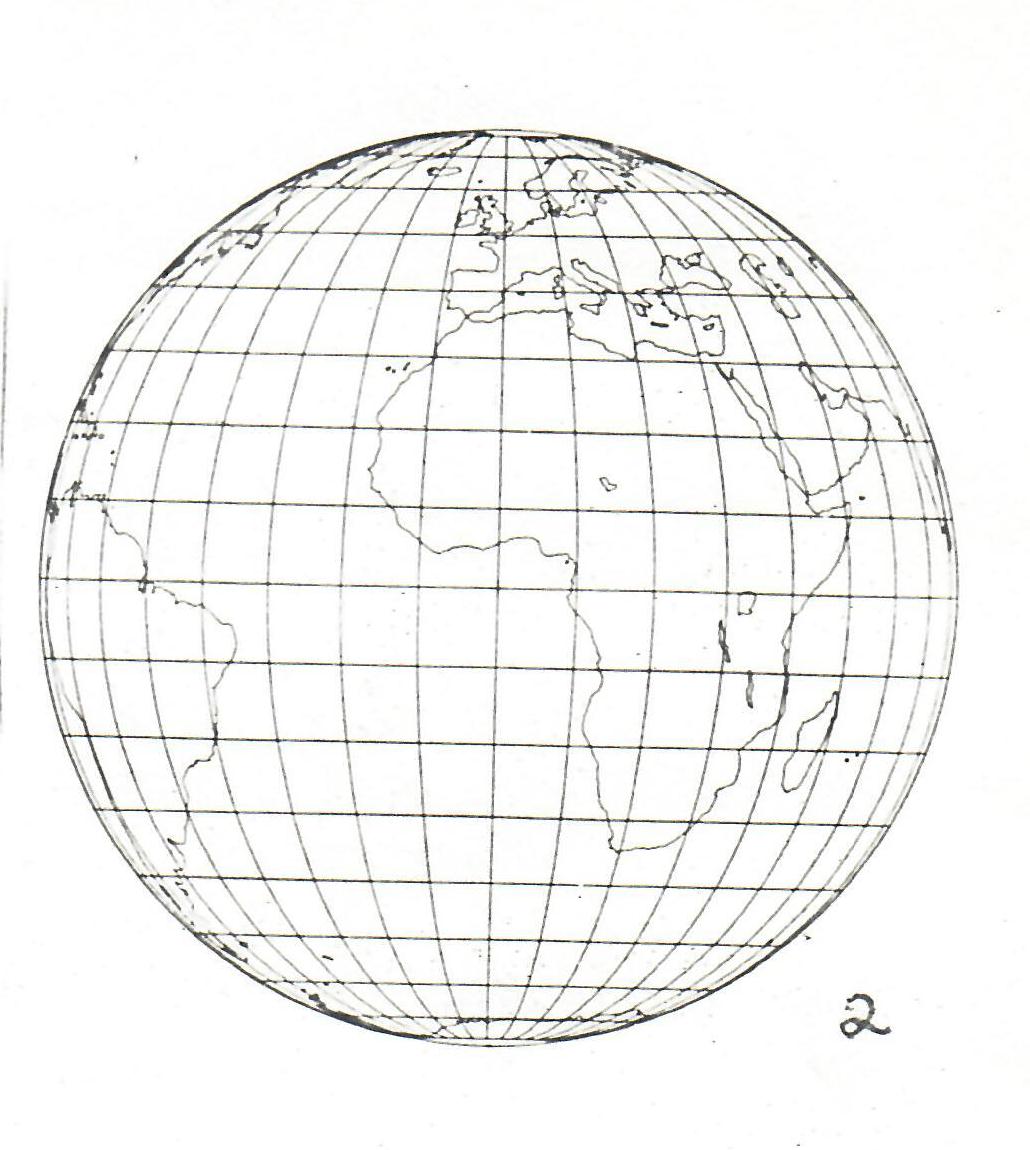
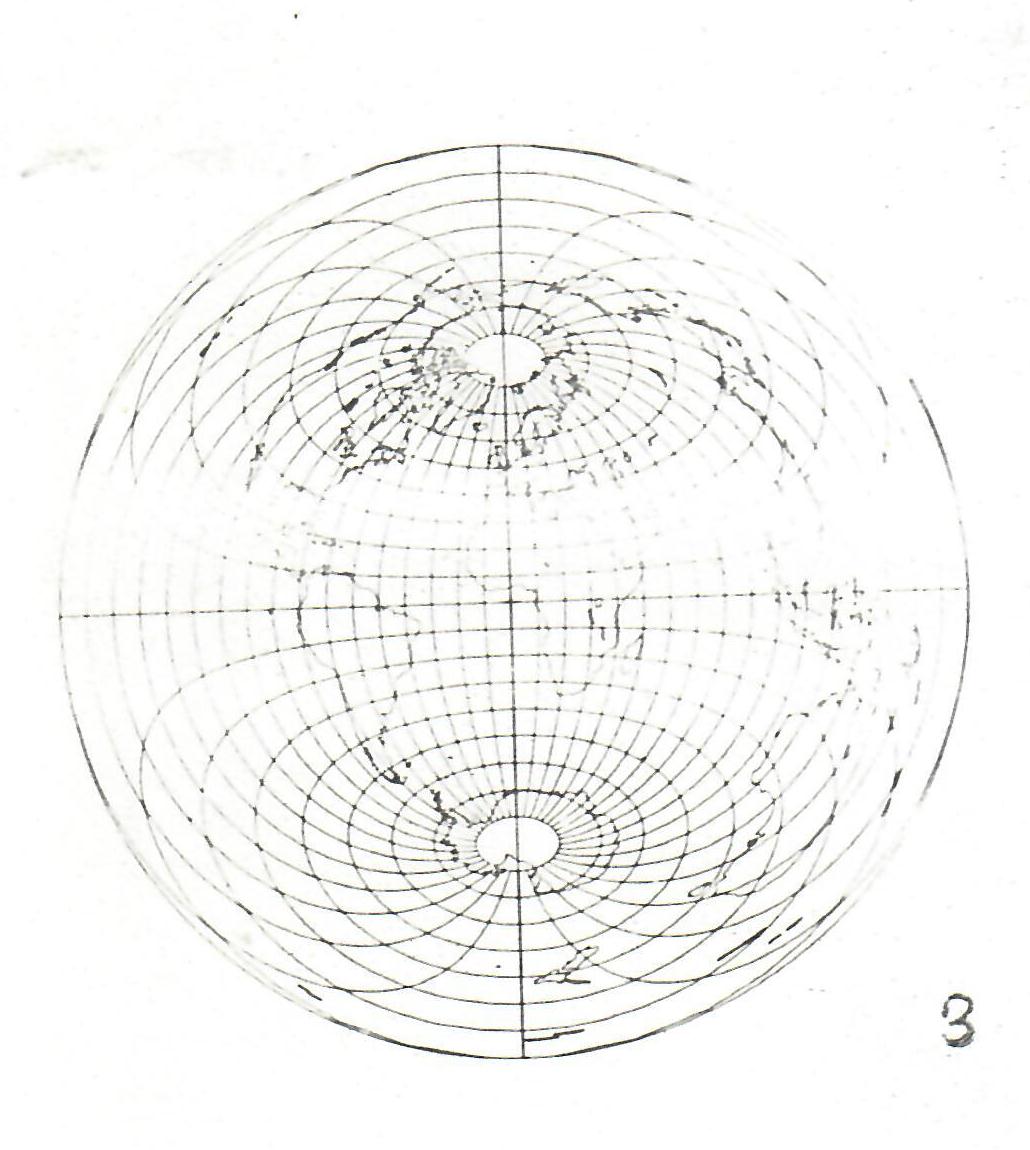
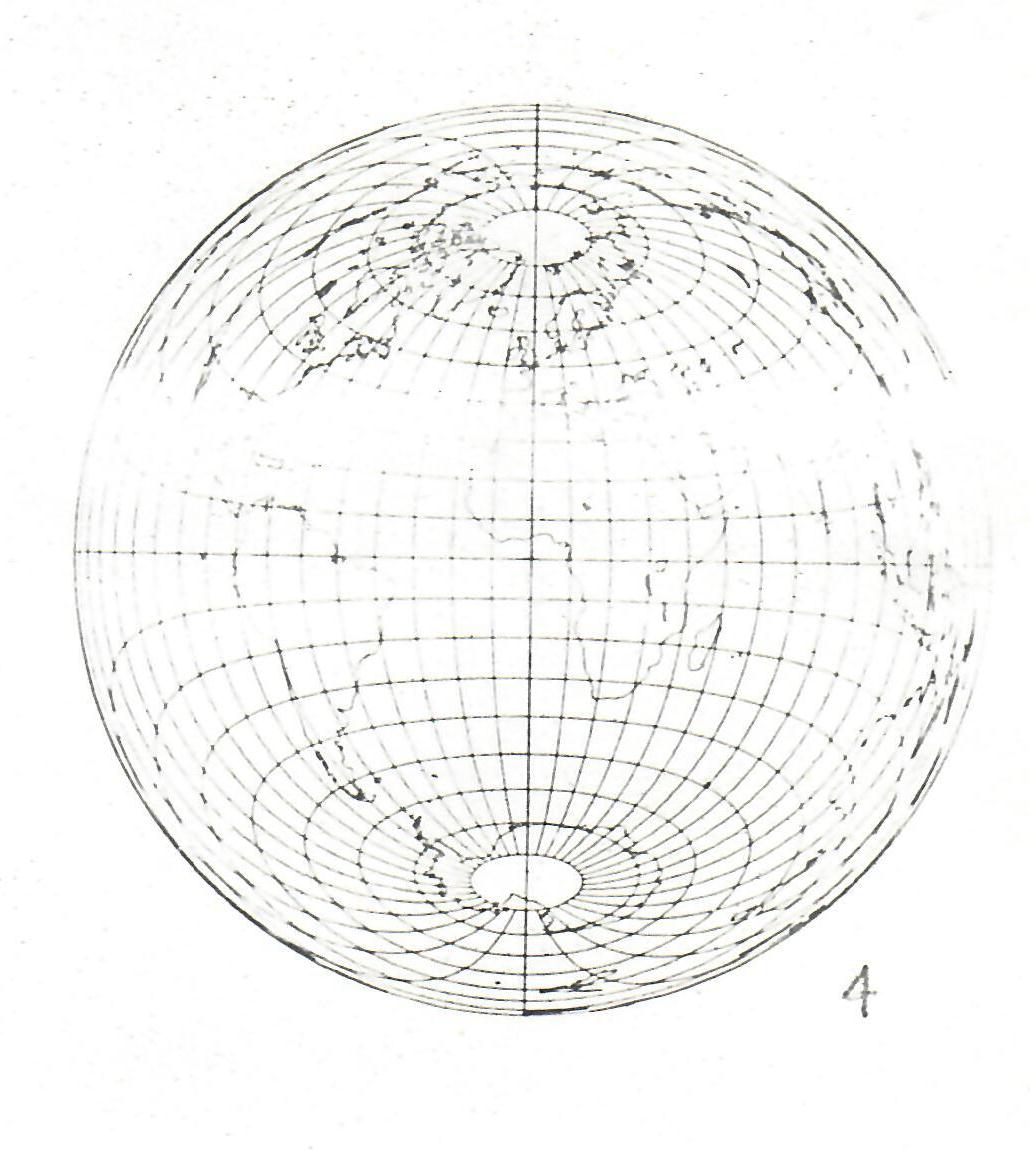
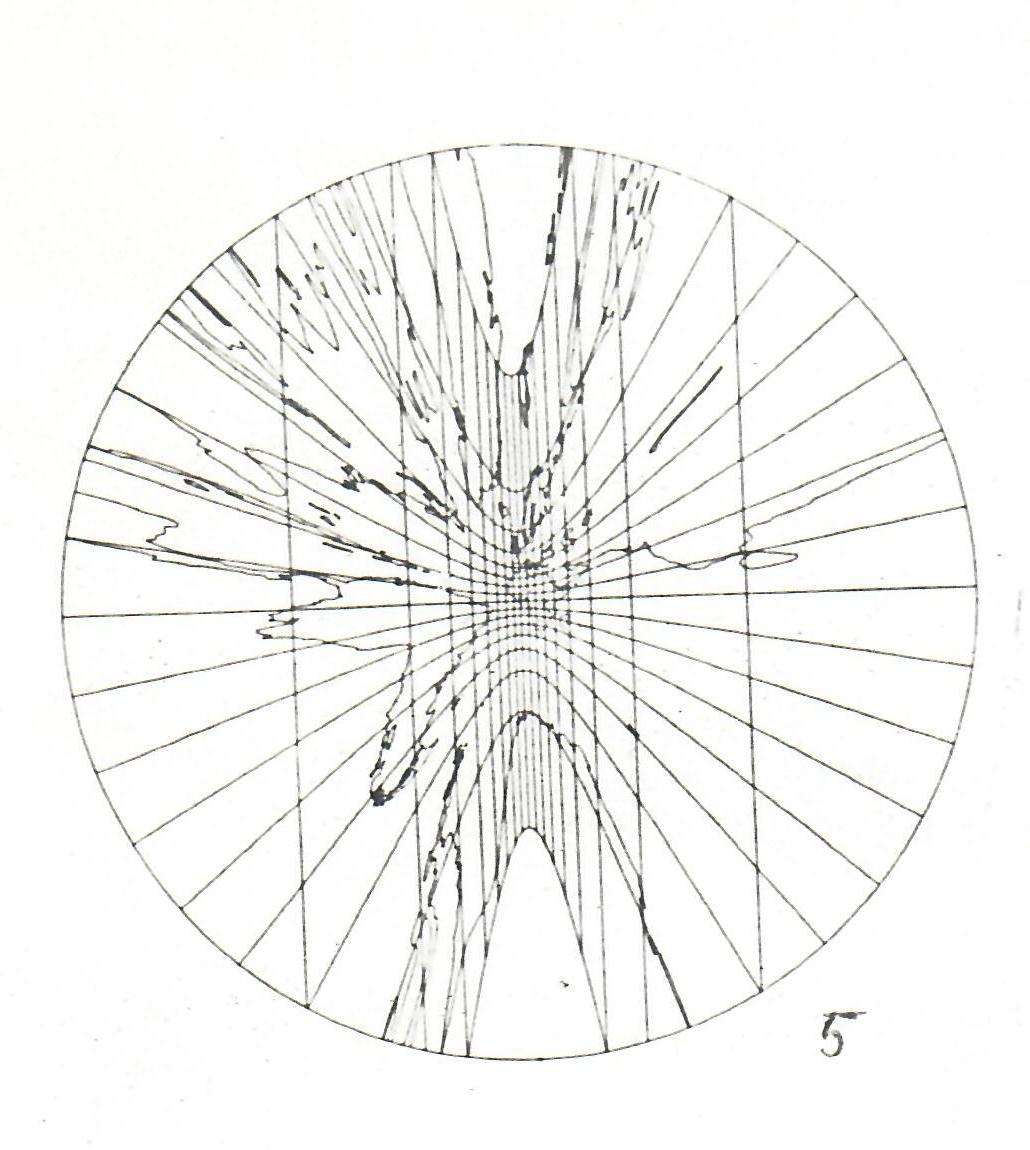
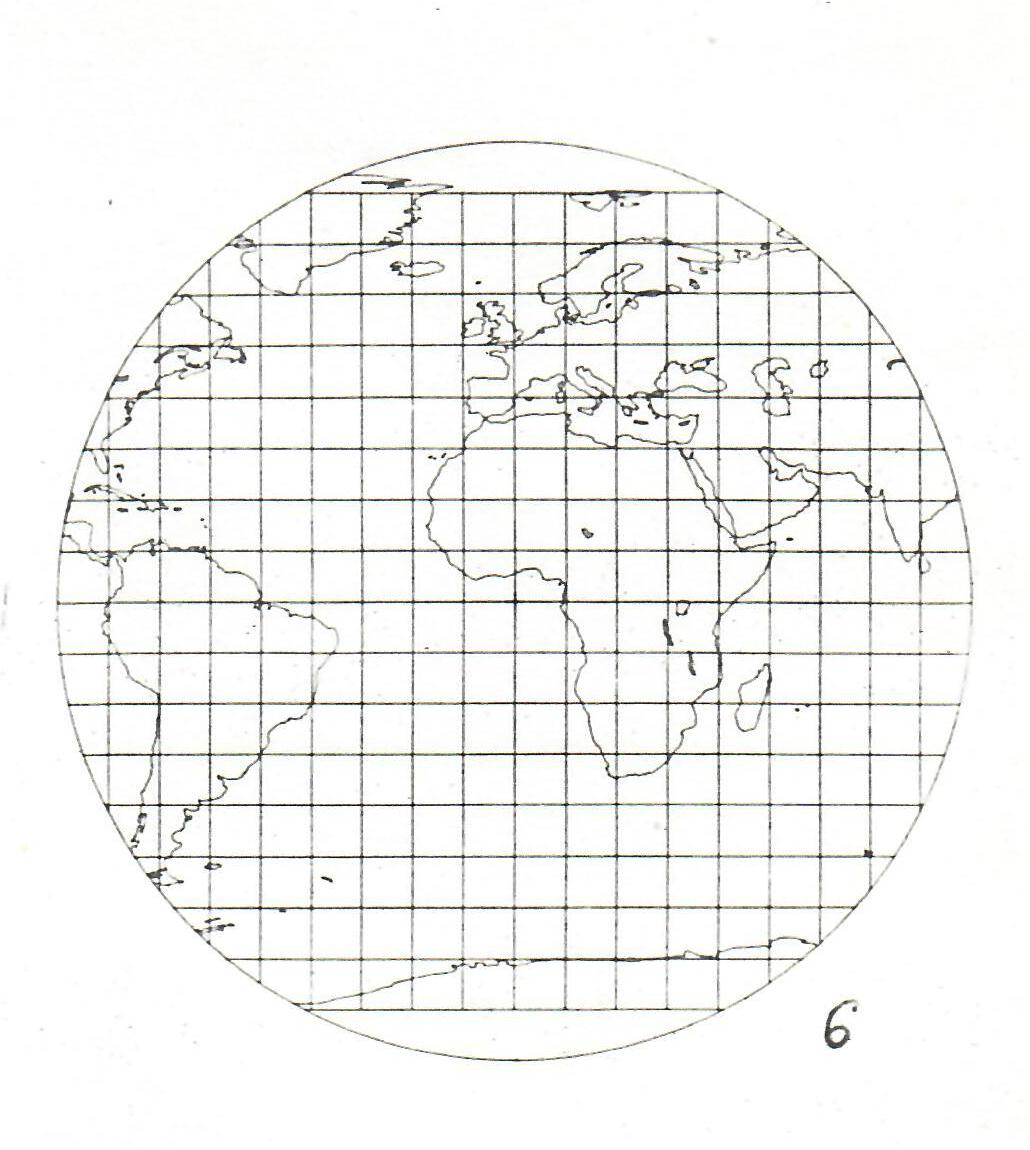
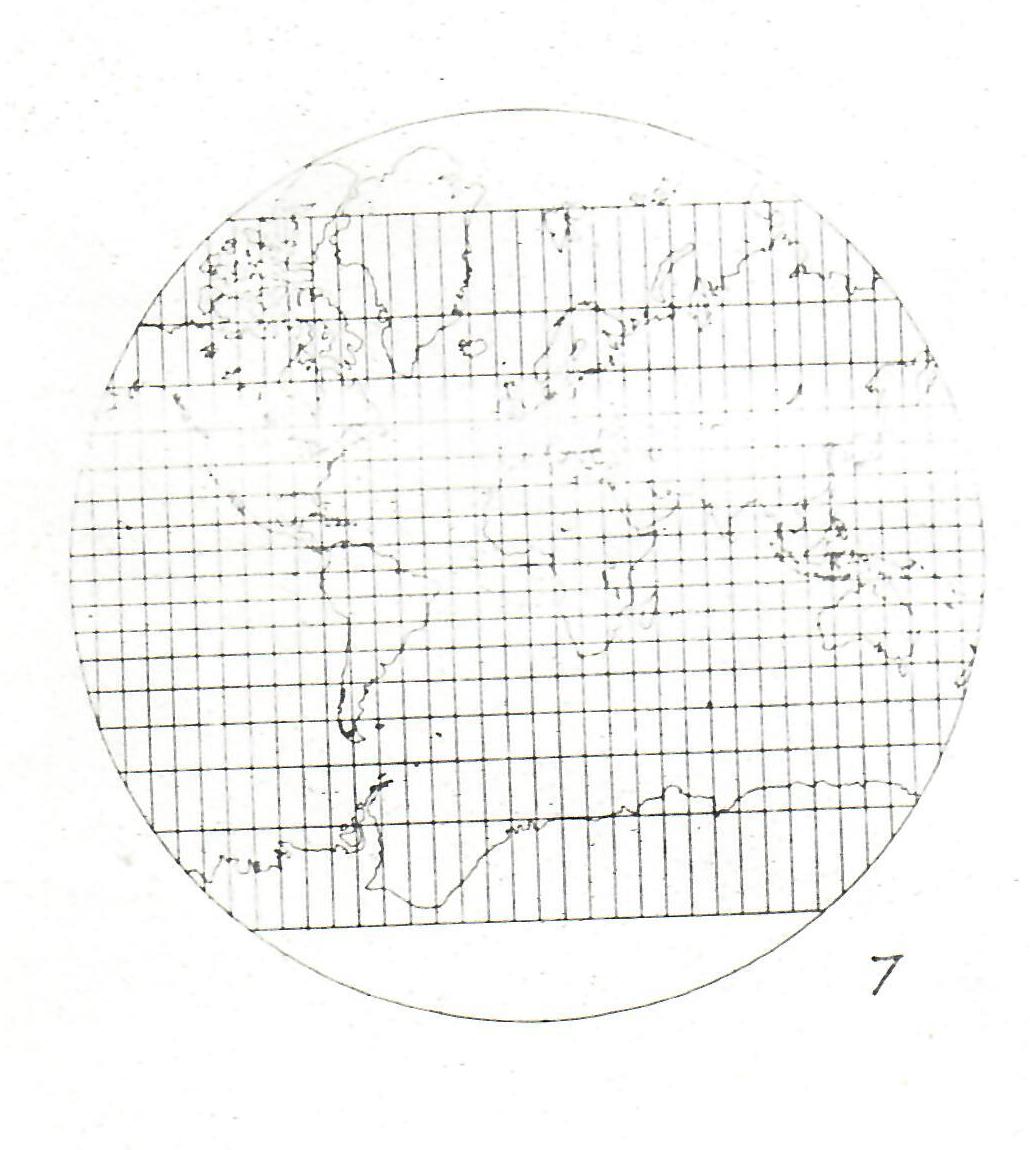
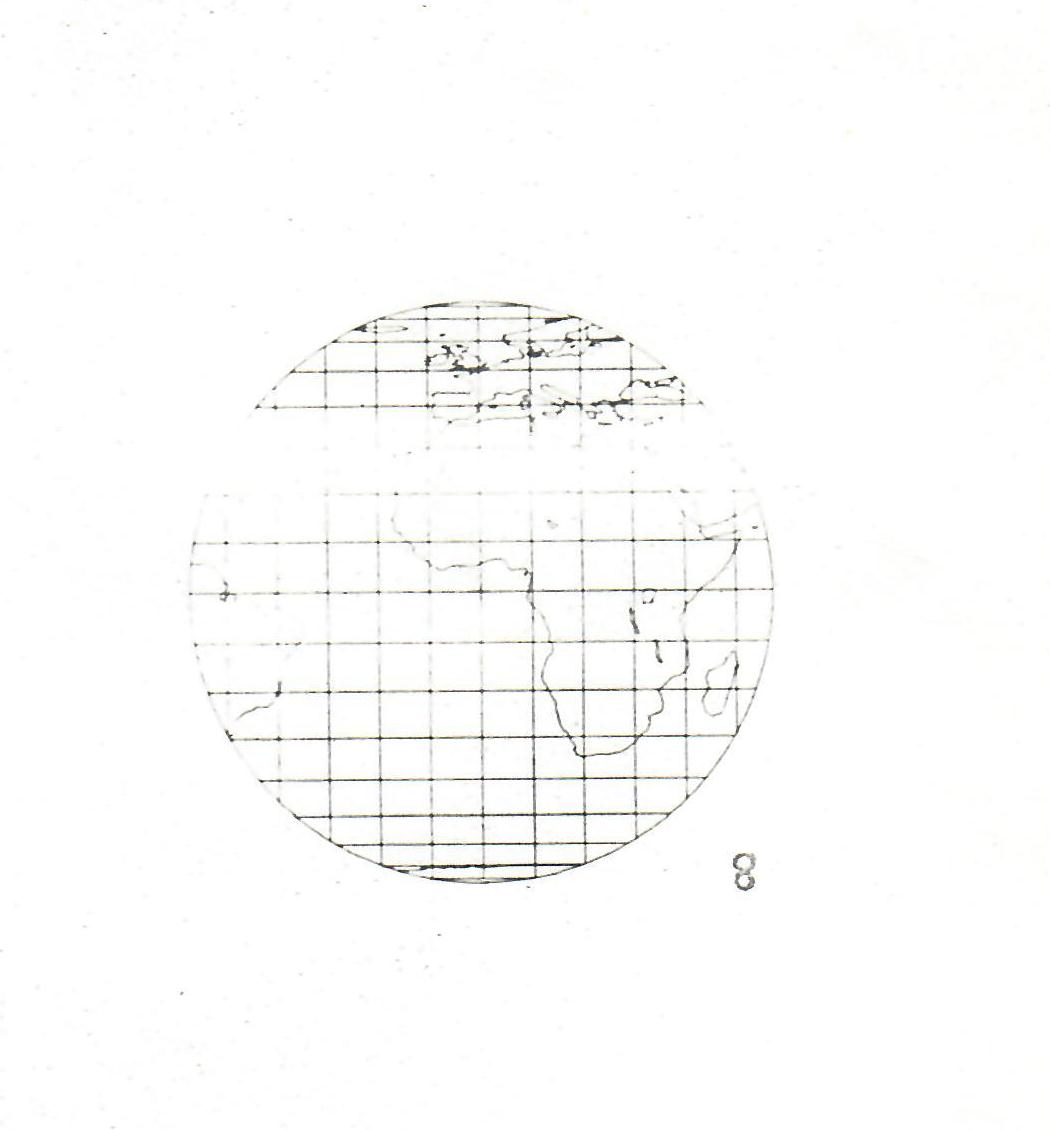
=l Stereographic Zenithal 
=2 Orthographic Zenithal 
=3 Equidistant Zenithal 
=4 Equal area Zenithal 
=5 Gnomonic Zenithal 
=6 Simple Cylindrical (Plate Carree) 
=7 Mercator's Cylindrical 
=8 Lambert's Equal Area Cylindrical 
PLAT, PLONG
Latitude and longitude of the centre of projection. N and E are positive, S and W negative. In degrees.
RADT, RADS
Angular radiuss from the centre to the top and side of the projection respectively. In degrees. The maximum allowable radii for the various projections are (in degrees):
  
Type (MTYPE)   Maximum radius   
  1                170   
  2                 90   
  3                170   
  4                170   
  5                 85   
  6                 90   
  7                 85   
  8                 90   
RUT, RUS
Number of coordinates. in the user-selected system from the centre of the projection to the top and side respectively.
RCPX, RCPY
X,Y of the centre of projection in the user's coordinate system.
MSHAPE
Shape of boundary (0 = circular frame, 1 = rectangular frame)
MGRID
Latitudes and longitudes will be plotted at intervals of MGRID degrees. If MGRID=0, none will be plotted.
NC
FORTRAN channel number connected to the data file containing world coast-line data. If NC is negative, no coast-line will be plotted. A program description statement must be provided and a #DA2 parameter must be included in the macro call (see Note (3)).

Global Names

The user should avoid the following names used by MAPS, as well as those used by the SPROGS, SMOG and FORTRAN Libraries. MAPS calls the following routines:

COORDS, DARCAB, DCOAST, DGRID, LOCEDG 

It uses the following COMMON block:

COMAPS 

Notes

  1. MAPS does not set up a coordinate system. The user must set up his own first. Since the data was originally set up for SD4020, the user's coordinate system must invert the y-axis to obtain upright maps. See the call to JLIMS in the example.
  2. The routines are accessible from the library file :GRAFLIB.MAPSEMI and this name must be included in a LIB parameter in a macro call (see the example).
  3. The coast-line data is contained in the file:
    :GRAFLIB.WORLDATA 
    
    which is just over 16K floating point numbers long. This file must be quoted in a #DA parameter to the macro call and the user must include a Program Description Segment to associate the same stream with a FORTRAN unit number. For instance:
    INPUT 3=DA2/UNFORMATTED/512 
    
    In the complete example which follows, NC=6 and unit 6 is associated with DA2 in the program description (USE and INPUT are virtually equivalent).
  4. The user's Program Description must also include those statements required by the appropriate graphics package (SMOG Manual, Appendix 2). The standard graphics PD segment is to be found in :SUBLIB.TASK-SPD, the user can look at this for reference, but must use his own Program Description.
  5. The user may wish to create his own coast-line data file for MAPS. The format of the first record is as follows:
    Word 1               Integer number of records to follow= N
    Words 2 to N+1       Integer counts of longitude/latitude pairs in each record. 
    
    Each subsequent record contains latitude and longitude pairs as floating point values (-ve for South and west). The coordinate pair (0.0,0.0) indicates a break in a connected coast-line. The maximum number of coordinate pairs allowed altogether is 8338. The maximum number of data records is 17. Note that the integers in the first record must be COMPRESSed - only one word each; ie the FORTRAN program which writes them must include COMPRESS INTEGER AND LOGICAL in the Program Description.

Example

If the program shown below is in a file MAPTEST then the following SMOG call can be used to run it. The program draws each projection once:

SMOG *CRMAPTEST,OPT,LIB:GRAFLIB.MAPSEHI,#DA2:GRAFLIB.WORLDATA,JT170SECS,TI160SECS 
      LIST 
      PROGRAM(MAPT)
      ABNORMAL FUNCTIONS
      COMPRESS INTEGER AND LOGICAL
      OUTPUT 98*LP0
      OUTPUT 12=LP5
      OUTPUT 13=LP6
      USE 6=DA2/UNFORMATTED/512
      END
      MASTER MAPTEST
C
C***  TEST OF NEW SHORELINE
C     USING MAXIMUM RADII, AND CIRCULAR SHAPE
C
      CALL FRHCM
      CALL CINE
      CALL JLIMS(0,1023,1023,0,1,1)
C
C***  CIRCULAR BOUNDARY
C
      MSHAPE=0
C
C***  DRAW ALL TYPES OF MAP
C
      DO 10 MTYPE=1,8
      CALL MAPS(MTYPE,0.,0.,RAD(MTYPE),RAD(MTYPE),511.,511.,511.,511.
     *,MSHAPE,10,6)
      CALL ADVFLM
   10 CONTINUE
C
C***  ENDPROGRAM
C
      CALL ENDSPR
      STOP OK
      END

Fig 1: Sterographic Zenithal

Fig 1: Sterographic Zenithal
Full image ⇗
© UKRI Science and Technology Facilities Council

Fig 2: Orthographic Zenithal

Fig 2: Orthographic Zenithal
Full image ⇗
© UKRI Science and Technology Facilities Council

Fig 3: Equidistant Zenithal

Fig 3: Equidistant Zenithal
Full image ⇗
© UKRI Science and Technology Facilities Council

Fig 4: Equal area Zenithal

Fig 4: Equal area Zenithal
Full image ⇗
© UKRI Science and Technology Facilities Council

Fig 5: Gnomic Zenithal

Fig 5: Gnomic Zenithal
Full image ⇗
© UKRI Science and Technology Facilities Council

Fig 6: Simple Cylindrical (Plate Carree)

Fig 6: Simple Cylindrical (Plate Carree)
Full image ⇗
© UKRI Science and Technology Facilities Council

Fig 7: Mercator's Cylindrical

Fig 7: Mercator's Cylindrical
Full image ⇗
© UKRI Science and Technology Facilities Council

Fig 8:  Lambert's Equal Area Cylindrical

Fig 8: Lambert's Equal Area Cylindrical
Full image ⇗
© UKRI Science and Technology Facilities Council
⇑ Top of page
© Chilton Computing and UKRI Science and Technology Facilities Council webmaster@chilton-computing.org.uk
Our thanks to UKRI Science and Technology Facilities Council for hosting this site