
This feature is of use for pictorial representation and only of limited use for line drawings. The latter can probably be better represented by dashed and dotted lines. Applications of the grey-scale or variable intensity feature of the FR80 might include artificial surface texturing or the reconstruction of digitised photographs. The latter could range from processed X-ray images to satellite recordings of surface areas.
It has been claimed that the eye can distinguish up to 20 levels of grey, although others have stated a limit of 13. Visitors from the BBC have said that 256 levels are required in order to reproduce an image correctly. They are probably all correct, the apparent inconsistency being that they have not indicated precisely what it is they are looking at. For instance:
     film can be viewed directly (transmitted light)
     a paper print... ... (reflected light)
     a microdensitometer can look at film
     a digitized image can be displayed on a TV monitor
A real world subject obviously contributes to an image over the full density range by infinitesimal amounts. When a film is processed the resultant curve looks like this:
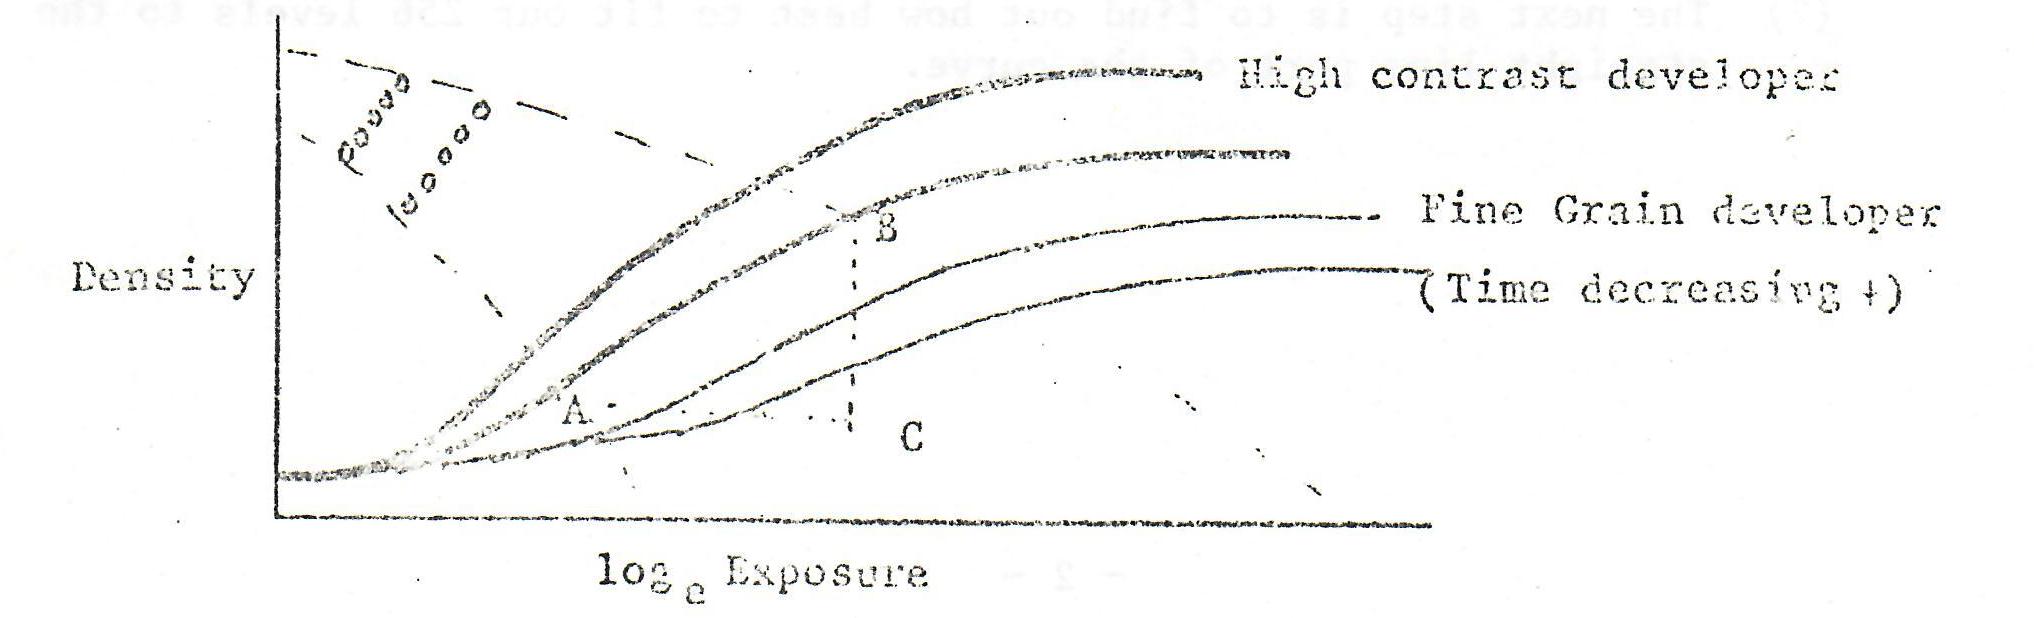
The straight line portion AB is termed the Density Range whilst the Tangent BC/AC is called Gamma and defines contrast.
Although there is no theoretical reason for restricting ourselves to the straight line portion of the curve, in practical terms it is necessary in order to allow for variations in processing, film age or batch, and phosphor ageing. In fact, using somewhat less than the full range would seem desirable due to the range itself changing as shown above. There will thus inevitably be variation in absolute density from one run to the next, but this should not be more than 0.02 (the MacBeth densitometer scale goes down to 0.01 with smaller subdivision assessed by eye).
Assuming that the beam intensity 'base' level does not change (and that the exposure resulting from one unit increase in the FR80 intensity command gives a unit increase on a logarithmic scale) the resultant operator Contrast control can give the following effect:
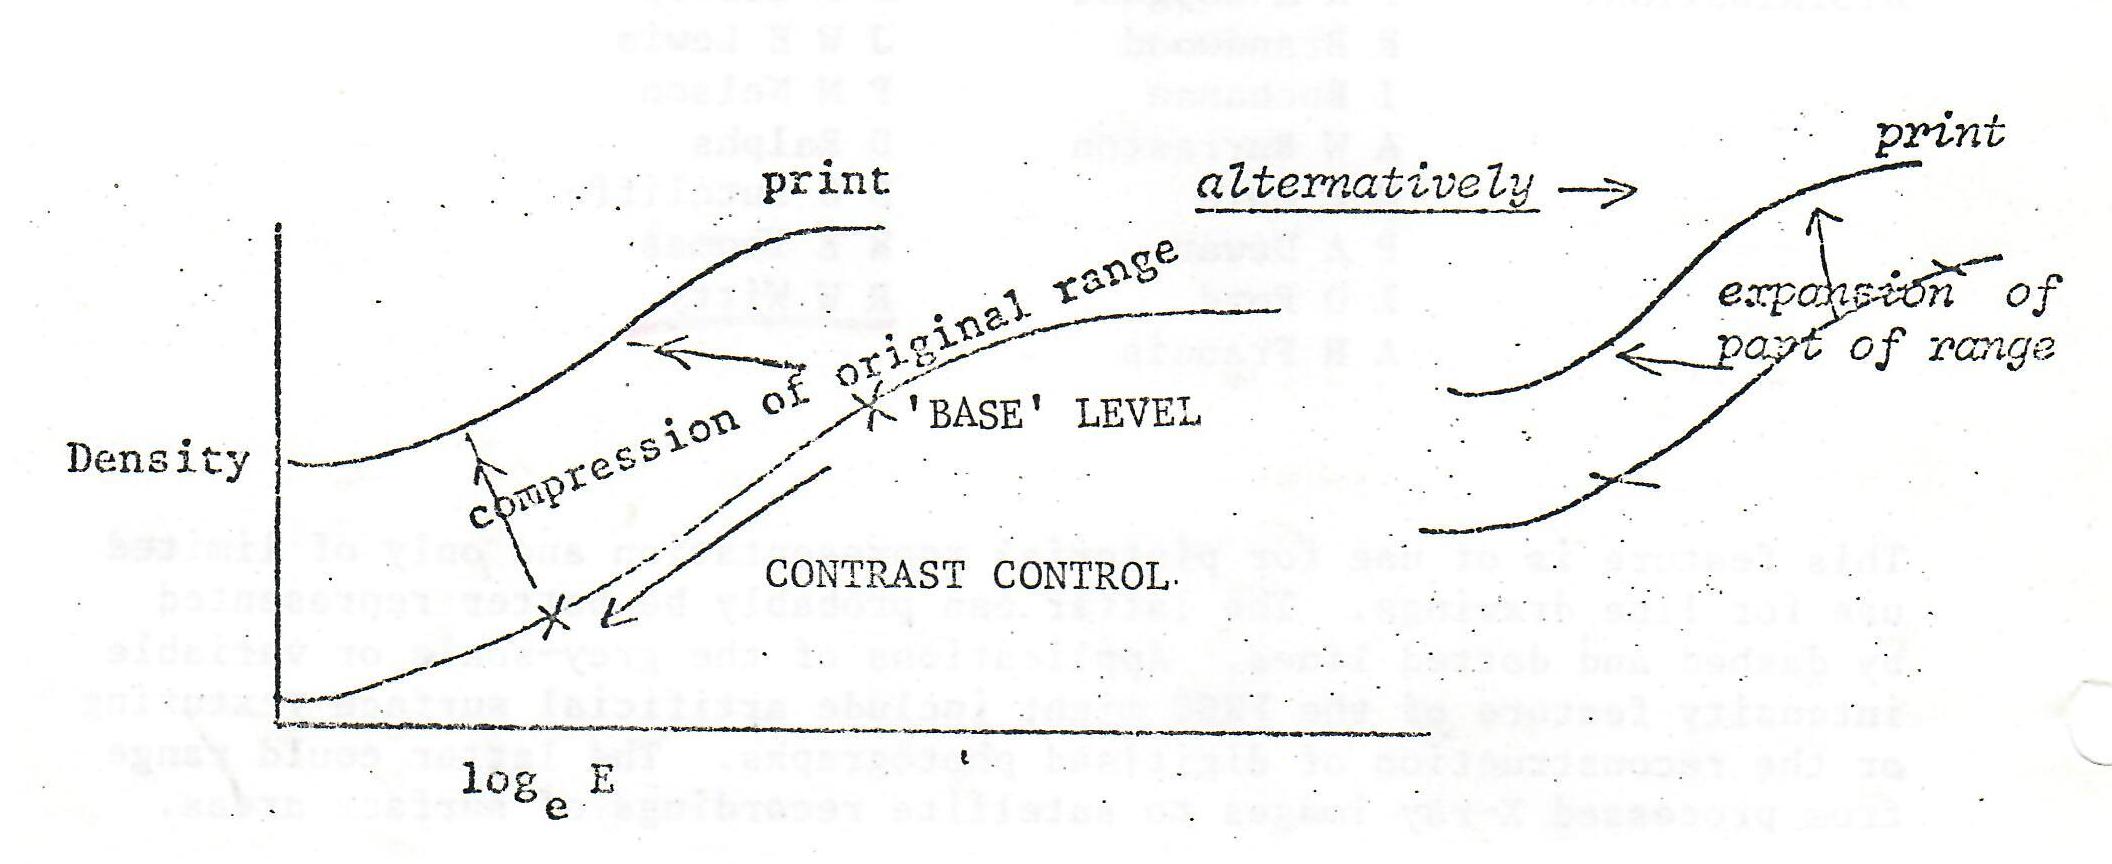
It is conceivable that the intensity range on the FR80 will go beyond the straight line portion at either end. It is also likely that a continuous density range could result, certainly as far as the eye is concerned.
(1) It seems clear that we have to establish what range we have with our current film and processing. In order to increase the range it may mean that we have to change film stock and do the processing elsewhere. This will certainly be the case if pressure marks cannot be eliminated from processing.
(2) The next step is to find out how best to fit our 256 levels to the straight line part of the curve.
(3) Finally, we have to calibrate the image over the recording area. There being no 'beam-splitter' on the FR80 it is almost impossible to conceive of a uniform recording over the complete area. With most devices, it is usual to have a control path of light, so that the intensity at a particular point can be verified and unintentional variations compensated for by modifying exposure times. This is not the case on the FR80. Additionally, beam current is modified, not exposure time, in order to obtain different intensities.
Possible effects contributing to non-uniformity over the recording area are:
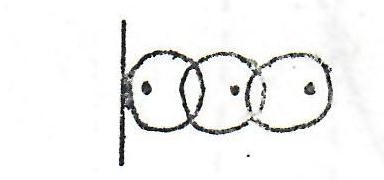
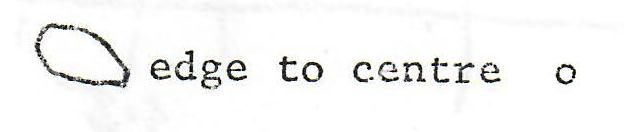
(1) Edge effects due to the properties of phosphors (halation)
(2) Phosphor activity variation
(3) Spot shape variation
(4) Spot positioning variation (pin-cushioning)
Assuming we concentrate on 35mm, it might be possible to calibrate complete frames at several intensity settings and hold a correction table either in the host or on the FR80 to automatically allow for the cumulative effect of these variations.
The question then arises as to how one is to produce the image in the first place bearing in mind the finite size of the spot of the FR80 and that of the microdensitometer used for measuring. The spot size will also vary depending on the intensity level.
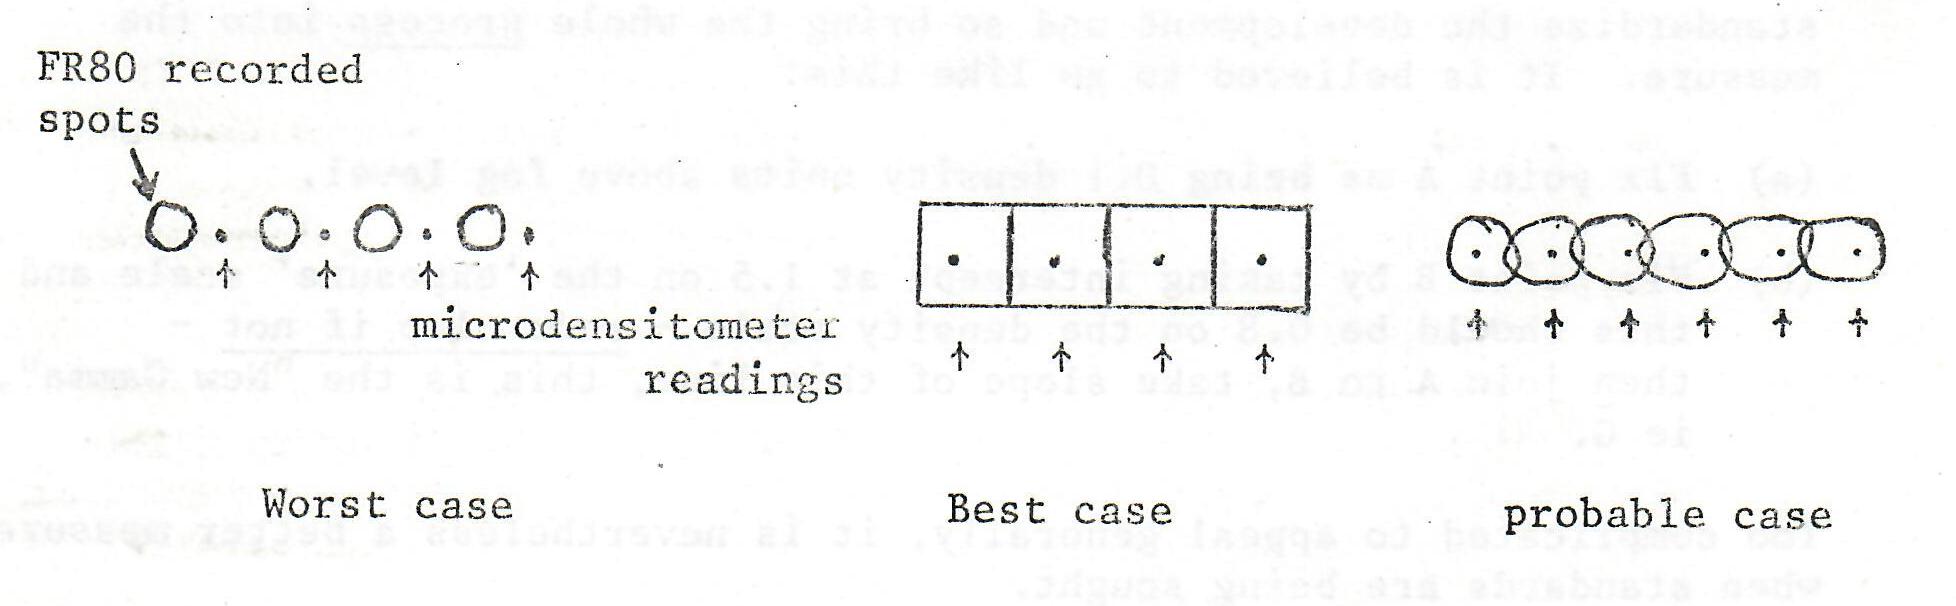
Minimum Spot Size FR.80 = 7 raster positions = 0.0004" (0.0016" maximum)
Size of image = 16384 over 0.980" (1 raster= 0.0000598" approx)
Microdensitometer Spot Size: 25 microns, 50 microns, 100 microns ( 1 micron = 0.001in approx)
As always one is beset by "New" definitions of "Old" concepts. Take "GAMMA" - the most recent definition seen is the following (note that the definition involves the processing as well):
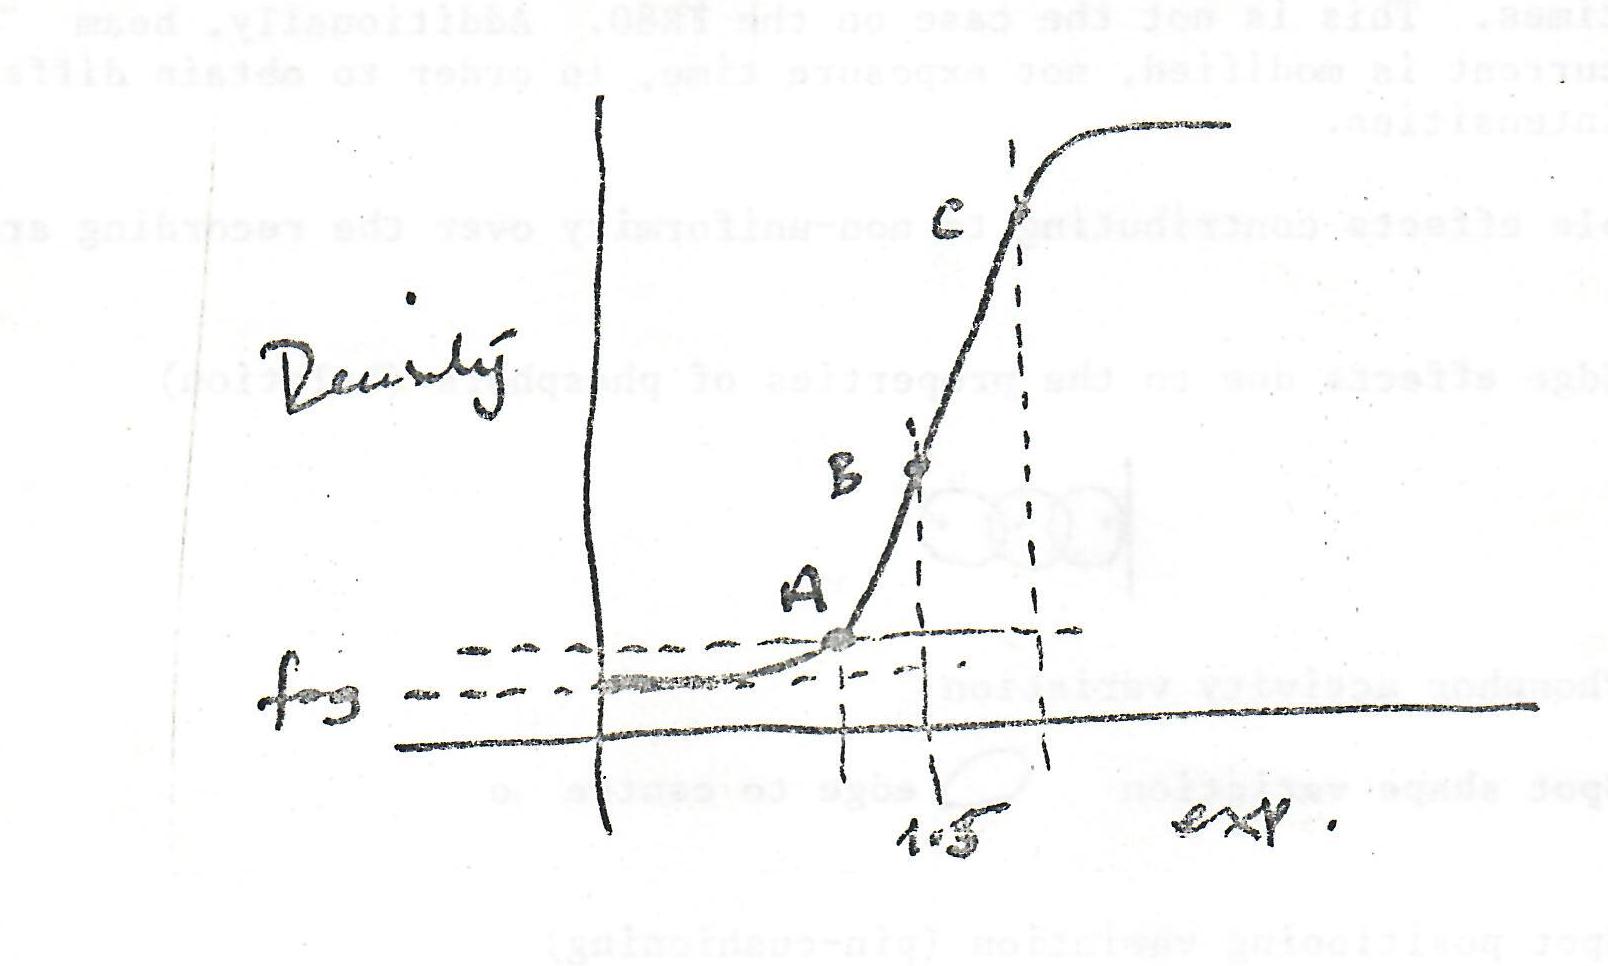
1. The "old" (I believe ASA/BSI) system specified two points eg A and C on the curve such that the slope at A was 0.3 x slope at C having fixed the points one could then draw a line through them and the slope of this line was "Gamma". Obviously developer-dependent, a new measure was sought - hence 2.
2. From 1962 the new measure G (Gee with vertical bar on top bar) replaced gamma and serves to standardize the development and so bring the whole process into the measure. It is believed to go like this:
(a) Fix point A as being 0.1 density units above fog level.
(b) Fix point B by taking intercept at 1.5 on the 'exposure' scale and this should be 0.8 on the density scale - redevelop if not - then join A to B, take slope of this line, this is the "New Gamma", ie G.
Too complicated to appeal generally, it is nevertheless a better measure when standards are being sought.
