
The picture on the front cover shows the initial structured grid used to compute subsonic flow over an aerofoil. The grid will subsequently be refined as the calculation proceeds to capture greater detail of the flow properties. (See Advanced Flow Simulation.)
Processing tape data is a major activity of users of the Atlas Centre VM system. There are over 70,000 user magnetic tapes here, and with the cost of tapes at least two orders of magnitude less than mainframe disks, this situation is going to continue.
The new "transparent tape staging" system, developed at the Atlas Centre, has been used here since 3rd October 1990 for all VM access to user tape data. Its workings, some of its benefits, and the unusual disk I/O algorithm which reduces delays are briefly described in this article.
The system was designed to provide a more effective interface between jobs and tapes than simply having human operators mount the tapes on drives used directly by the jobs. That simple approach has many drawbacks. These can be lessened by various schemes, such as installing more tape drives or installing robots for mounting the tapes, but alone these are not a very cost effective or satisfactory solution.
The basic idea of tape staging is that, instead of processing data directly on the tape, a job processes a copy of the data held on disk. If a copy of the particular tape required is not already on disk, the tape must be mounted and the data copied onto disk. If the job changes the tape data on disk, then afterwards the real tape must be mounted and the new data copied out onto it. Data is deleted from disk to make room for new tape data.
There are many advantages with this approach. Fewer tape drives are required - tapes are mounted only for the relatively quick copy process. Disk space is much cheaper than tapes mounted in drives. Interactive use of tapes is possible without tying up drives. Data from one tape can be read from disk by more than one job at once. Data on the "tape" can be accessed randomly. If enough disk space is available tape data may remain on disk until its next use, avoiding the delays and human action required for a real tape mount.
The system in effect simulates "virtual tapes* the same way as VM simulates other virtual devices. Just like a tape drive, the system handles whole tapes consisting of a series of blocks and tapemarks and is not concerned with the meaning or structure of the data in the blocks. The staging software is completely transparent and no changes to jobs are required, so all jobs immediately benefit from staging.
The system owns disk space (only enough for the currently open tapes) on which tape data is stored while jobs are using it. The system extends the basic tape staging concept by using space in our StorageTek Automated Cartridge System to hold the contents of recently used (in the last few weeks) but not actually active tapes. Data can be rapidly copied from the ACS onto disk for another job wishing to process the data, without operator intervention. Often this copying is overlapped with the job processing an earlier tape. Tape data which has not been used recently will need to be copied into the system, which requires the operator to mount the tape. Data written onto tapes by jobs is written back to the real tape shortly after the job ends, as well as being kept in the ACS. The system moves tape data between disk, ACS tape, and real tape automatically, trying to maximize the usefulness of the data on disk and in the ACS. (Figure 1)
All the usual CMS tape applications and user programs work without change with transparently staged tapes. Label processing, multiple files per tape, multivolume datasets, end-of-volume (tape full) etc are all handled as usual, in the user's machine, just as they would be for a real tape.
Clearly this staging subsystem processes a lot of tapes and performs a lot of I/O to manual tape drives, ACS tape drives, and disks. About a third of all I/O done to VM minidisks at Atlas is done to minidisks of the transparent tape staging system. The copy operations between disk, manual tape and ACS tape should all be as fast as possible, to minimize delays to jobs and because the number of tape drives is limited.
Ten manual IBM and eight robot-mounted StorageTek 3480 tape drives are available here, although they are shared with other VM subsystems and the Cray system. These drives sustain about 2.6Mb/sec with large blocks.
The disks used are IBM 3380s. In essence, these consist of several platters with a magnetic recording surface on each face, spinning at 60rps. Data is recorded in almost 3000 concentric tracks on each surface. Each surface has a head on an access arm for reading and writing data. The arm moves all heads in and out together to select the required track. Data is recorded on a track as a serial string of bits, split up into blocks with gaps between. Each track can hold up to 47476 bytes. Data can be transferred via only one head at a time, so the maximum possible data rate to one disk is 60*47476 = 2.7Mb/sec (M=2*#20). The difficulty is achieving this in practice for reads and writes on a busy system.
The transparent tape staging system uses "unoriented fulltrack I/O". In essence, each track is formatted into several equal blocks and every read or write operation reads or writes in one revolution the contents of all the blocks on a track, starting with the one to reach the head next. With the data of each block is written a "block identifier". Since the blocks on a track are read and written from any point round the track, the blocks may be presented to the reading application in any cyclic permutation. The "block identifier* tells the reading application which block is which. Figure 2 shows five blocks being written to a track and then being read starting from a different point. Except while moving disk heads, almost all the time can be spent transferring data. The maximum wasted time before data transfer starts is one block.
This scheme has many advantages over ordinary (oriented) disk algorithms which read and write specific blocks in a specific order. For large sequential transfers, the highest possible data rates are sustained with minimal memory requirement; for random I/O, high data rates are achieved even for small single track transfers. Ordinary schemes only come close to the maximum speed with multitrack transfers and large memory buffers. Other I/O requests on the same disk or data path are blocked for no more than one disk revolution.
This system now handles all VM user tape data, 3,000-4,000 requests for tapes each week. A job's requirements for tape volumes are no longer used as a constraint for scheduling the execution of jobs. Many jobs each use large numbers of tapes (many over 20, some over 100). Almost half of all requests for tapes are satisfied immediately - the data is already on disk, either because it has been used in the last hour or so or has been pre-loaded for a multitape job while it was processing its previous tape. Almost another half of the requests are satisfied with about a two minute delay - the data is copied to disk from the ACS. About 10% of requests need a real human operator tape mount.
SAS is a large, easy to use, flexible system for data analysis. Its name of Statistical Analysis System is misleading because although the Base software contains statistical routines, it also contains routines for manipulating data and producing output in the form of charts, tables, histograms and graphs. This means that SAS can be used as a report writer with a minimum amount of programming. SAS can handle virtually any form of input data but is particularly suitable for data with a regular structure.
A SAS program consists of a number of steps put together in the sequence needed by the user. There are two types of steps, DATA steps and PROC steps and most SAS programs have at least one of each.
A DATA step generally reads data and creates a SAS dataset containing that data. The SAS dataset also contains information like the name, length and position of variables, which SAS will use in later steps. Selection of values and variables can also be done in the DATA step and SAS datasets can be combined together in various ways.
A PROC step uses one of the many SAS procedures to process a SAS dataset. Depending on the procedure, PROC steps can produce output such as graphs, calculated values or new SAS datasets.
The program below deals with data about students (name, sex, age, height and weight). The first DATA step reads observations from a source called STUDY and stores them in a SAS dataset called HTWT. This is sorted into order of sex followed by age in a PROC step using the SORT procedure. The PRINT procedure is then used to produce lists grouped by sex and age. In the second DATA step, the observations for male students aged 16 and with weight > 200lbs are selected from the SAS dataset HTWT and put into a dataset called HEAVY. This is then printed in a single list.
DATA HTWT;
  INFILE STUDY;
  INPUT NAME $ 1-10 SEX $ AGE HEIGHT WEIGHT;
PROC SORT;
  BY SEX AGE;
PROC PRINT;
  BY SEX AGE;
DATA HEAVY;
  SET HTWT;
  IF AGE = 16 AND SEX = 'M' AND WEIGHT >200;
PROC PRINT;
The Base SAS software provides tools for:
SAS is designed so that other SAS software products can be integrated with the Base software, and four of these are licensed at RAL.
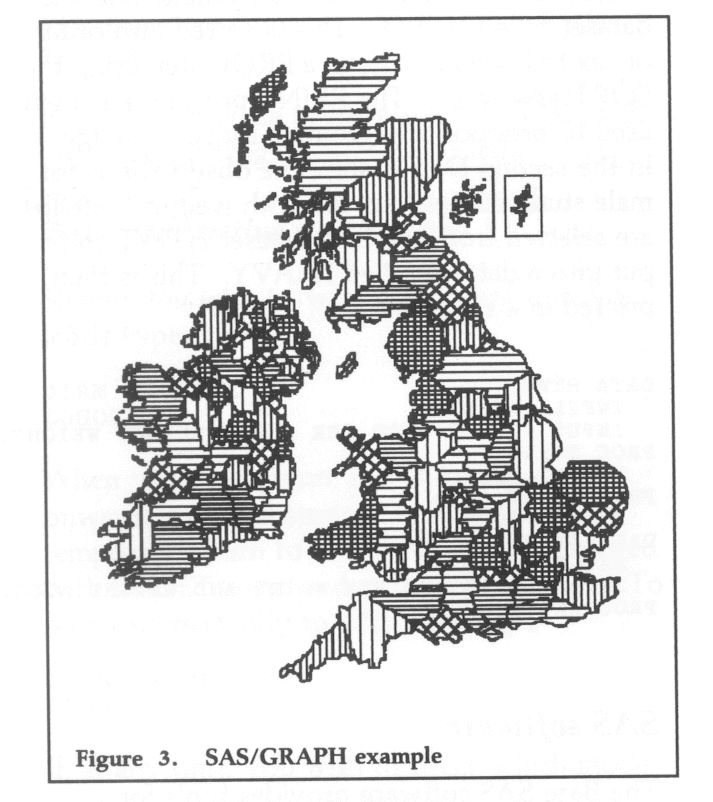
SAS/GRAPH allows users to display their SAS results in a graphical form on a colour terminal or to print the graphical output on a hardcopy device. The procedures produce charts, plots and maps and it is possible to combine maps with other forms of output. SAS/GRAPH uses default colours, type fonts and fill patterns so that it is very easy to produce a chart and then change from the default values if necessary, using the GOPTIONS statement.
There are five main procedures and a number of supplementary ones:
Work is being done in CCD to make it easy to direct the output from SAS/GRAPH to the particular hardcopy devices we have available.
The map in the example was produced using the GMAP procedure in a SAS program of a few lines. It was electronically processed for FLAGSHIP with IBM's Image View Utility.
This product is the Version 6 successor to what was originally termed SAS/SQL-DS when installed on the RAL CMS System in 1989. It represents the SQL part in a whole series of database interfacing products known as SAS/ ACCESS, other interfaces being to ORACLE, DB2 etc. The big benefit is being able to combine the storage and retrieval advantages of a relational database with the analytical and report writing capabilities of SAS without needing special programming tricks. The SQL procedure in Base SAS (new to Version 6) is complemented by procs ACCESS and DBLOAD in the product itself (roughly replacing SQLEXT and SQLLOAD):
The upgrade to Version 6 involved rewriting the SAS System in the C language (previously PU1). Upwards compatibility has been maintained, so that Version 5 data libraries can still be read. Existing user code may require minor changes, or if not, advantage can be taken of enhanced statement and procedure options. The ability to compile, store and execute SAS programs has now arrived, however the source code needs to be saved for recompilation under future SAS releases. A major new concept is MEA, Multiple Engine Architecture. The architecture supports a number of access methods (engines) and allows SAS to process any type of file as if it were a SAS dataset.
New windows (such as LIBNAME, HELP and OPTIONS) are on offer in the interactive Display Manager. There are many new informats, formats and system options. There is even limited correction of misspelt keywords! The SAS statement FILENAME is now recommended instead of CMS FILEDEF as it reduces processing time. Setting up or changing of options now needs to be done in a file named CONFIG SAS rather than PROFILE SAS. It is no longer possible to get away with inserting data lines or using the CARDS statement within a SAS macro. With Version 6, a machine storage size of 7 Mbs is advisable to prevent possible problems.
SAS/GRAPH has been restructured and SAS/FSP enhanced. Five new statistical procedures have been introduced, all statistical software now being removed to the separate product SAS/STAT. This will continue to be provided on RAL CMS.
Testing of Version 6.06 is almost complete and a NEWS file will inform users when it becomes the production system.
SAS sell a large range of manuals and they are well designed and thorough. The basic reference manual is now in two parts but it is easy to use and well indexed. There is also an Introductory Guide and a manual specifically for CMS users of SAS.
RAL have written their own introductory document to SAS which is intended to give an overview of the system. Anyone interested can access it by typing FIND SAS WRITEUP on CMS. SAS also provide a large number of sample programs which give a good idea of the capabilities of SAS. Details of how to run these are given in the RAL introductory document.
SAS is available at RAL on CMS, but user support is limited. Typing "FIND SAS" on CMS will show the help files available on SAS. SAS can be run interactively, non-interactively or in batch (non-interactive running consisting of calling SAS with a program stored in a CMS file). For users with full-screen terminals there is a full-screen interactive facility (entered by default). This provides a windowed screen where you enter SAS statements in the lower half and see the SAS log in the upper half.
The AMBER program (Assisted Model Building with Energy Refinement) is now available on the Cray X-MP/416 at RAL. AMBER is a general purpose molecular mechanics and dynamics program designed for the refinement of macro molecular conformations using an analytical potential energy function. The empirical parameters for the potential function have been derived from both experimental results and ab initio quantum chemical calculations on smaller molecules of diverse chemical structure. The transferability of these parameters to related systems has been the success of the molecular mechanics approach to study the conformations of proteins and nucleic acids which would otherwise be an impossible task. AMBER is divided into several modules, the first four of which must normally be run in sequence. The function of individual modules are described below.
Plotting instructions may be generated from the PREP and EDIT data preparation modules. For a macro molecule created from the LINK database, and possibly several PREP runs, it is necessary to use plot information generated in EDIT as only this will contain topologically correct coordinates.
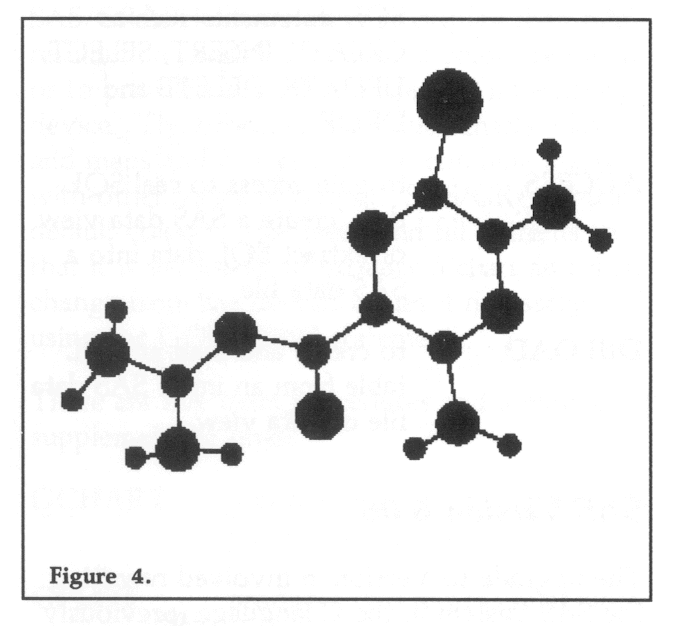
A UNIRAS program has been written to interpret the AMBER plot instructions generated in EDIT and display either a wire frame or ball and stick representation of an individual molecule, or an animation sequence using the output of an AMBER molecular dynamics simulation. Graphical output may either be stored as a metafile for future examination or viewed interactively using an environment such as X-Windows.
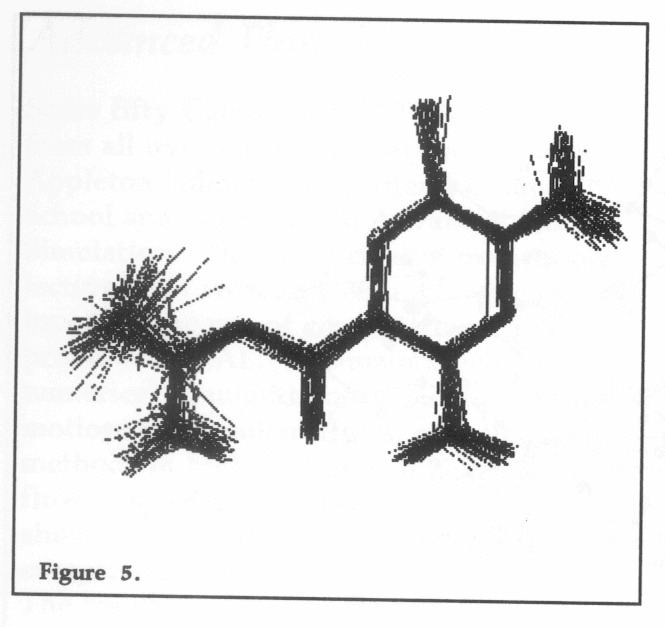
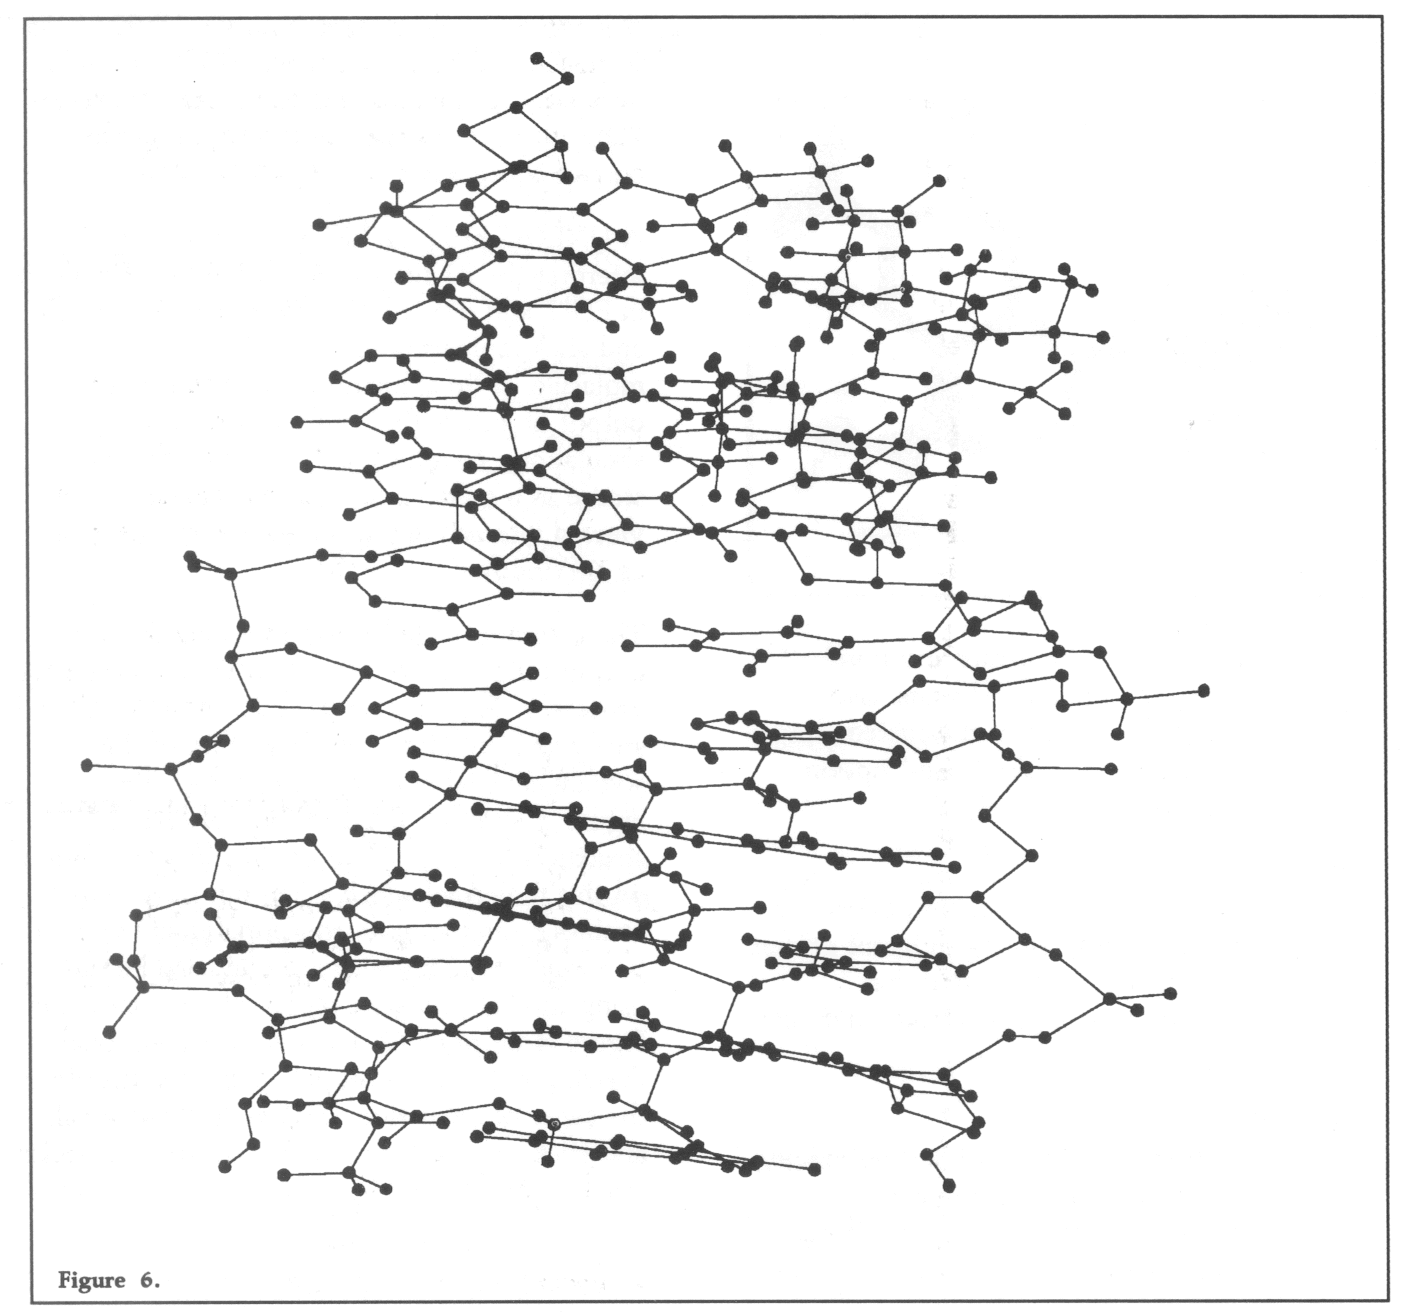
The diagrams included in this article show output obtained from the AMBER graphics post processor. Figure 4 shows a ball and stick representation of the structure of the sodium channel blocking drug Amiloride. Figure 5 shows a superposition of fifty structures from a molecular dynamics simulation on this molecule, which when run interactively enables a sample of its conformational space to be visualised. The sequence may also be run using the ball and stick representation shown in Figure 4, however the additional drawing reduces the output speed and therefore the sense of animation. Figure 6 shows a ball and stick representation of the trios tin molecular system containing 554 atoms.
The AMBER modules are named as the lower case versions of the names given above, prefixed by the letter r i.e. rprep, rminm, rnode etc, and may all be run in batch using a standard UNICOS job description. The Atlas Cray User Guide should be consulted for more information on the submission of batch jobs from either the IBM or VAX front ends. The number of file assignments and the FORTRAN units to which they are connected vary from module to module, as do memory and CPU requirements. (Detailed information for each module is outside the scope of this general article but will be available to users interested in running the program.)
AMBER is also implemented on the IBM 3090. Information on running the program under CMS is available on request.
Those interested in using AMBER under UNICOS or CMS should contact me.
Some fifty Computational Fluid Dynamicists from all over Europe met at the Rutherford Appleton Laboratory to attend a summer school and workshop in Advanced Flow Simulation. They participated in tutorials, lectures and working seminars which involved the use of computational facilities provided at RAL. The main themes were numerical simulation of turbulence, particle motions in turbulent flows, and numerical methods in high Reynolds number fluid flows, especially compressible flow with shocks. Some useful new concepts and comparisons of computer codes resulted. The results will be published later this year in an ERCOFTAC workshop series.
The European Research Community for Flow Turbulence and Combustion (ERCOFTAC) is a network of research centres and research groups in academic, government and industrial organisations with members in most European countries (currently only those in the European Community and EFTA). Its main aims are:
ERCOFTAC has an administrative headquarters in Brussels and a co-ordination centre in Lausanne. An important means of promoting the aims of ERCOFT AC is the holding of an annual Summer School and the Workshop, the first of which was held at the Lyon-Grenoble Pilot Centre. (The Pilot Centres provide the local co-ordination in the different European countries; RAL and Manchester are the Pilot Centres within the UK.) These Summer Schools have some features that are common to other scientific summer schools and workshops, but other features that are unique, and the whole range of activities is certainly not found in any other scientific or engineering summer school. For instance, a final day is devoted to the presentation of the interim results of the summer school, for the participants to learn from each other and for outside visitors, especially those from industry and other research groups, to hear about the projects.
The follow up activities of the workshop are:
The school, which was self-funding was held under the auspices of ERCOFTAC and supported by generous sponsorship from SERC, British industry and the American Naval and Air Force Offices.
Professor J C R Hunt (Cambridge) gave a general review of common concepts of turbulence and the different methods of modelling and simulating turbulent flows, including the recently developed fast method of Kinematic Simulation for approximately representing the time evolving structure of turbulent flows with known statistics without the necessity of computing solutions to the dynamic equation. He emphasised the recent contribution of computational methods to provide insight into the eddy structure of turbulent flows and how this can be related to the statistical description of turbulence and statistical models. The eddy structure can particularly affect the motions of particles. Dr M Savill (Cambridge) gave a review of engineering models for the statistical moments of velocity fields in turbulence, and described the recent ERCOFTAC workshop in Lausanne (March 1990) which had demonstrated the sensitivity of these models to the assumptions contained in them and to their numerical evaluation (grids and boundary conditions).
Dr G Kleiser (DLR Gottingen) described some of the recent advances in understanding and modelling the way in which laminar flows become turbulent. Dr P J Mason (UK Meteorological Office) and Dr P Yoke (Queen Mary and Westfield) reviewed the Large Eddy Simulation (LES) method of simulating turbulent flows. Dr Mason described work at very large Reynolds numbers computing the time evolution of large scales with the effects of small scales being modelled statistically and Dr P Voke described how LES is used by his group for engineering turbulent flow at moderate Reynolds number (eg Re - 104), when most of the significant scales of motions can be computed directly and the modelling of the smallest scales is unimportant. LES codes require substantial computation time (typically - 102 hours on a large super computer even for an element of an engineering problem eg flow in an expanding pipe).
Dr J P Chollet (Grenoble) described the methods of direct simulation of turbulence and its application to shear flows, whilst Dr J P Bertoglio (Ecole Centrale, Lyon) described a different approach to calculating high Re turbulence by the use of a statistical EDQNM model for the second order two-point spectra whose central assumption concerns the nonlinear transfer process between fluctuations with different wavenumbers. Professor G Gouesbet (Rouen) lectured on practical computational modelling of the random movement of particles in turbulent flows. He and his colleagues had studied a wide class of problems. The models range from the forces on the particles, stochastic modelling of particle trajectories cutting through eddies because of inertial and buoyancy forces, and then modelling how higher concentrations of particles affect the turbulence (by extra terms in the K-8 equation).
This problem was attempted by three groups. Drs Voke and Yang from the Turbulence Unit at QMW used their Large Eddy Simulation code. Dr S Watson from Admiralty Research Laboratory used the Cham code PHOENICS. These computations converged to solutions that were shown to depend on the input turbulence profile. The AEA Technology code Flow 3D was used by S Hartley and Dr I S Jones to study the same problem. Although broad agreements were obtained several important differences were also noted in the solutions. These will be worked on further.
In this problem the distribution of surface pressure and shear stress in a 3-dimensional flow over a semi-ellipsoid had to be calculated. Again three separate groups worked on the problems. PHOENICS (Dr S Watson) utilizes a K-8 model for the Reynold stresses. FLOWSTAR (Drs Feug and J C R Hunt) evaluates the linearised solutions of perturbed turbulent boundary layer over a surface undulation (or roughness change). Finally Dr D Howard (Oxford University Computing Laboratory) used his own 2 dimensional code using the K-8 approach but a different finite volume solver. Detailed comparisons will be made between the different cases when all the results are available.
The third project was to compute how the detailed structure of homogeneous turbulence changes in the presence of a stable density gradient, using the EDQNM model, (described in the lecture of Bertoglio. Dr L van Haren brought the code with him and this was mounted on the RAL Cray X-MP. During the workshop it was decided to explore how the initial anisotropy of turbulence influences are affected by stable stratification. An interesting feature of these results for initially anisotropic turbulence with no vertical component in the turbulence was to show how the non-linear processes induced vertical fluctuations which then tended to be suppressed by the stratification. This problem was formulated by van Haren, Bertoglio and Hunt during the workshop and the main results were obtained within the two week period.
Lectures were given by six people covering the major areas of activity on adaptive grids. Dr N P Weatherill (University College, Swansea) began the lectures and gave an overview of mesh generation techniques which included discussions on structured multiblock methods and the unstructured grid technique based upon the Delaunay criterion. Dr M Berzins (University of Leeds) discussed in detail aspects related to error indicators. Dr D Catherall (Royal Aerospace Establishment, Famborough) described techniques whereby points in the field could be moved from regions of low errors or calm regions of the flowfield to regions which require more resolution. Professor E Onate (Institute for Numerical Methods, Barcelona, Spain) discussed the numerical aspects of adaptivity for incompressible flows using finite element techniques based upon the Taylor-Galerkin method. Dr Ravocholl (Dassult Industries, Paris, France) described work on adaptivity techniques used in the European Space Shuttle project Hermes and Professor K Morgan gave an in depth explanation of the use of unstructured adaptivity techniques based upon the advancing front method with application of the background grid and remeshing techniques.
Participants in this group were assigned particular test case problems. Several computer codes were mounted on the RAL computers such that adaptivity based upon the Delaunay triangulation, advancing front method and structured elliptic solvers could be explored. A range of flow solvers were also available and these included codes based upon the finite element Taylor Galerkin procedure, the Jameson centred finite volume code and an upwind code based upon a kinetic flux vector splitting method. A variety of test case computations were set.
These computations were performed on the SUN workstations and on the Cray X-MP, accessed on site or via the fast link from the Cosener's House.
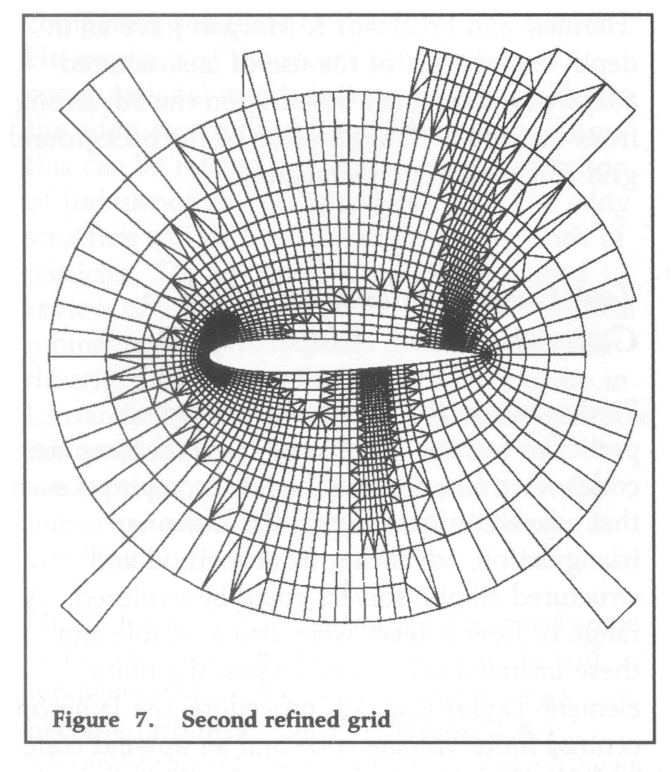
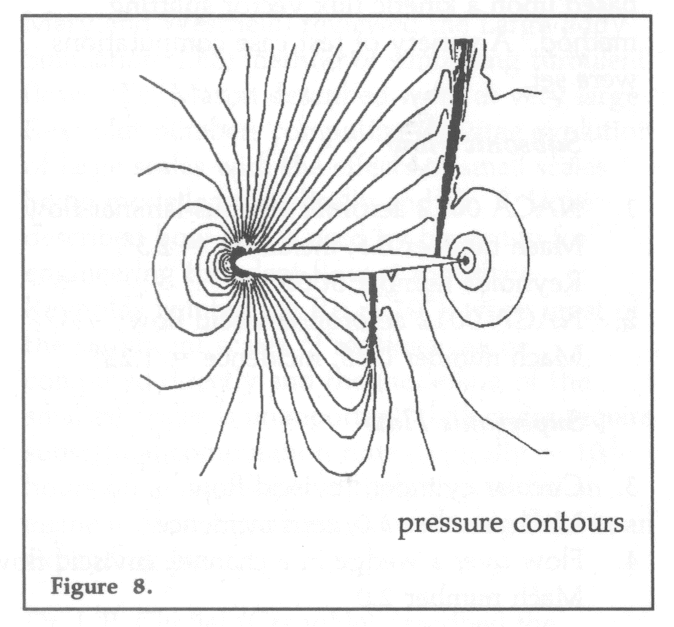
One successful computation was made for test case 1, whilst four different codes successfully computed the flow for test case 2. These results, obtained by a variety of approaches, demonstrated some of the advantages and disadvantages of the different methods. As an indication of the type of results and improvements achieved through grid adaption, Figure 7 shows the grids obtained from a finite volume based flow algorithm on a structured quadrilateral grid after several stages of refinement. (The initial grid is illustrated on the front page of this issue.) Computations on this first grid would only capture the gross details of the flow. Pressure contours obtained from the refined grid show clearly all the details of the flow including shock fronts etc, see Figure 8.
Test cases 3 and 4 were completed by two different computer codes, the results obtained were from a finite element Taylor Galerkin flow algorithm using an advancing front grid generator and from a finite volume flow algorithm with a Delaunay grid generation approach. Comparisons between the different approaches indicated that in all adaptivity techniques the shock waves were captured over a number of cells.
A preliminary report of the meeting has been produced and a limited number of copies distributed. Full proceedings and reported activities of the summer school will be published by Cambridge University Press later this year.
For further information, contact Dr D J Nicholas, Advanced Research Computing Unit, Atlas Centre.
As long ago as 1971 the Atlas Computer Laboratory (now part of the Rutherford Appleton Laboratory) had the foresight to understand the value of a new collaborative project that was just beginning. The Nottingham Algorithms Group, as it was then called, proposed to pool resources to create libraries of mathematical and statistical subroutines.
Now, of course, the Algol 60 library development has long ceased, other language developments have come and gone (like Algol 68) and the challenges of Ada and C have since been met by the NAG project. One line of development has been consistently maintained since those early days - the NAG Fortran Library. True, the Fortran of 1991 is Fortran 77 and emphasis in the coding practice is now on clarity and portability.
In this article I will seek to explain how the NAG Fortran Library has adapted and continues to adapt to the changing requirements and demands of the research community. Finally, I give two examples of how today it is still playing a vital role in the country's efforts to obtain maximum research benefits from its monetary and manpower investments.
Initially the project brought together ICL 1906 sites; the absence of any decent mathematical and statistical software on these machines was indeed the catalyst for NAG. Computing on these systems was simple, single-processor and mainly batch computing. The NAG mark 1 and mark 2 libraries reflected the single-machine objectives.
Between mark 4 and mark 5 releases of the library a very intensive effort was made to make the library accessible from other machines, like the IBM 370 range of machines that had been installed at the University of Cambridge. This brought new challenges. ICL machines were 48 bit machines, binary arithmetic. The IBM machines had only 32 bits and had hexadecimal arithmetic. Clearly the single-precision calculations that were satisfactory on the ICL were now highly dubious for IBM-like systems. So NAG produced both single and double precision libraries.
There were other problems too, which I mention for historical interest. In particular there was no real standard to dictate to compiler writers what should happen when statements of the form
DO 1 I=2,N
were encountered when N took the value 1 or less. Some systems always executed the statements within the loop once, others did not. It was remarkable that routines that successfully inverted non-singular matrices of large order, N, were prone to failure when N = 1.
So was born the concept of portability and a subset language of Fortran 66 that NAG contributors were encouraged to use.
The technology stood NAG in good stead and the library rapidly spread to over eighty different machine ranges. A new challenge then ensued. SERC were amongst the first to realise the potential of the individual workstation and encouraged NAG to implement its library on the PERQ machines. In itself this was not too difficult because of the previous work in making the NAG library source truly portable. The problem that NAG faced was that at the same time that workstations were entering the scene, the larger mainframes were also entering a new era.
The Cray-1 machine was an example of a vector machine that needed specially written code to exploit the hardware potential of the computer. From a maintenance point of view, this presented severe problems for NAG as it sought to meet demand from the workstation, ordinary mainframe and vector-machine users. To support many different base versions of the software was unrealistic and yet supercomputer users were hardly likely to be satisfied by simple compilations of the serial code.
A compromise strategy was formed in which a small subset of the NAG library was tuned to suit the various vector architectures. In the main this subset comprised linear algebra routines which lay at the heart of many of the NAG routines.
As machines of varying architectures became ever more prolific, even this approach became difficult for NAG to maintain and so the concept was developed further. A serious effort made to persuade manufacturers to provide special, highly-tuned kernel routines that could be used by software developers such as NAG. An international standardisation activity to define the names, argument lists and specification of a suitable set of kernel routines was initiated.
Thus was born the BLAS - Basic Linear Algebra Subprograms. Since that time a second wave of new machine architectures having a hierarchical file structure have led to a further set of BLAS being agreed, the Level 3 BLAS. Reports on the BLAS work are available from NAG.
The BLAS activities have made it possible today for NAG to offer its libraries to SERC users of workstations, mainframes and to users of the IBM 3090 and Cray supercomputers.
Of course, outside these activities, the SERC has played a central role in the exploitation of the Transputer. The full and proper implementation of numerical and statistical routines on transputer networks remains a research topic. NAG is involved in a number of European ventures to explore these possibilities. At the same time it has produced a single-transputer library to assist those who need the immediate functionality offered by the present NAG Library.
Because NAG is designed to provide those essential mathematical and statistical capabilities that are at the heart of so much scientific calculation, its availability is taken very much for granted. Consequently, feed-back we receive on NAG usage is limited, though were researchers to look closely at their programs the probability is that they would find NAG routines at the heart of their systems.
NAG is always keen to hear of users' stories and has numerous outlets should anyone care to add to their list of publications. Amongst the outlets are the NAG newsletters, the NAGUA conference and NAGUA newsletters. So if you have used NAG library software in any of your projects please let us know. Comments favourable or otherwise would also be appreciated at any time.
One application we can mention involves the Starlink project. Here NAG least-squares fitting, deconvolution routines and non-parametric statistics are used as part of image data analysis software. (In a future article we hope to describe how the SERC and NAG have successfully collaborated on other software ventures, including the areas of image processing, graphics and Finite Elements.)
In European joint projects RAL has played an active role. Coming to a successful conclusion recently, the RAL-led project, Everest, produced semi-conductor analysis software encompassing fifteen NAG routines. Principally these lay in the area of ordinary differential equations. Their availability saved the partners many man-years of effort that was more usefully employed addressing issues more central to the research project itself.
The NAG Library has continued to evolve to adapt to the varying demands of the user and the machine architectures. The contents have grown with every mark, to produce an extensive and useful tool to all scientific computer users. The SERC can be proud to have been involved with the project from its outset and to have given it support along the way.
